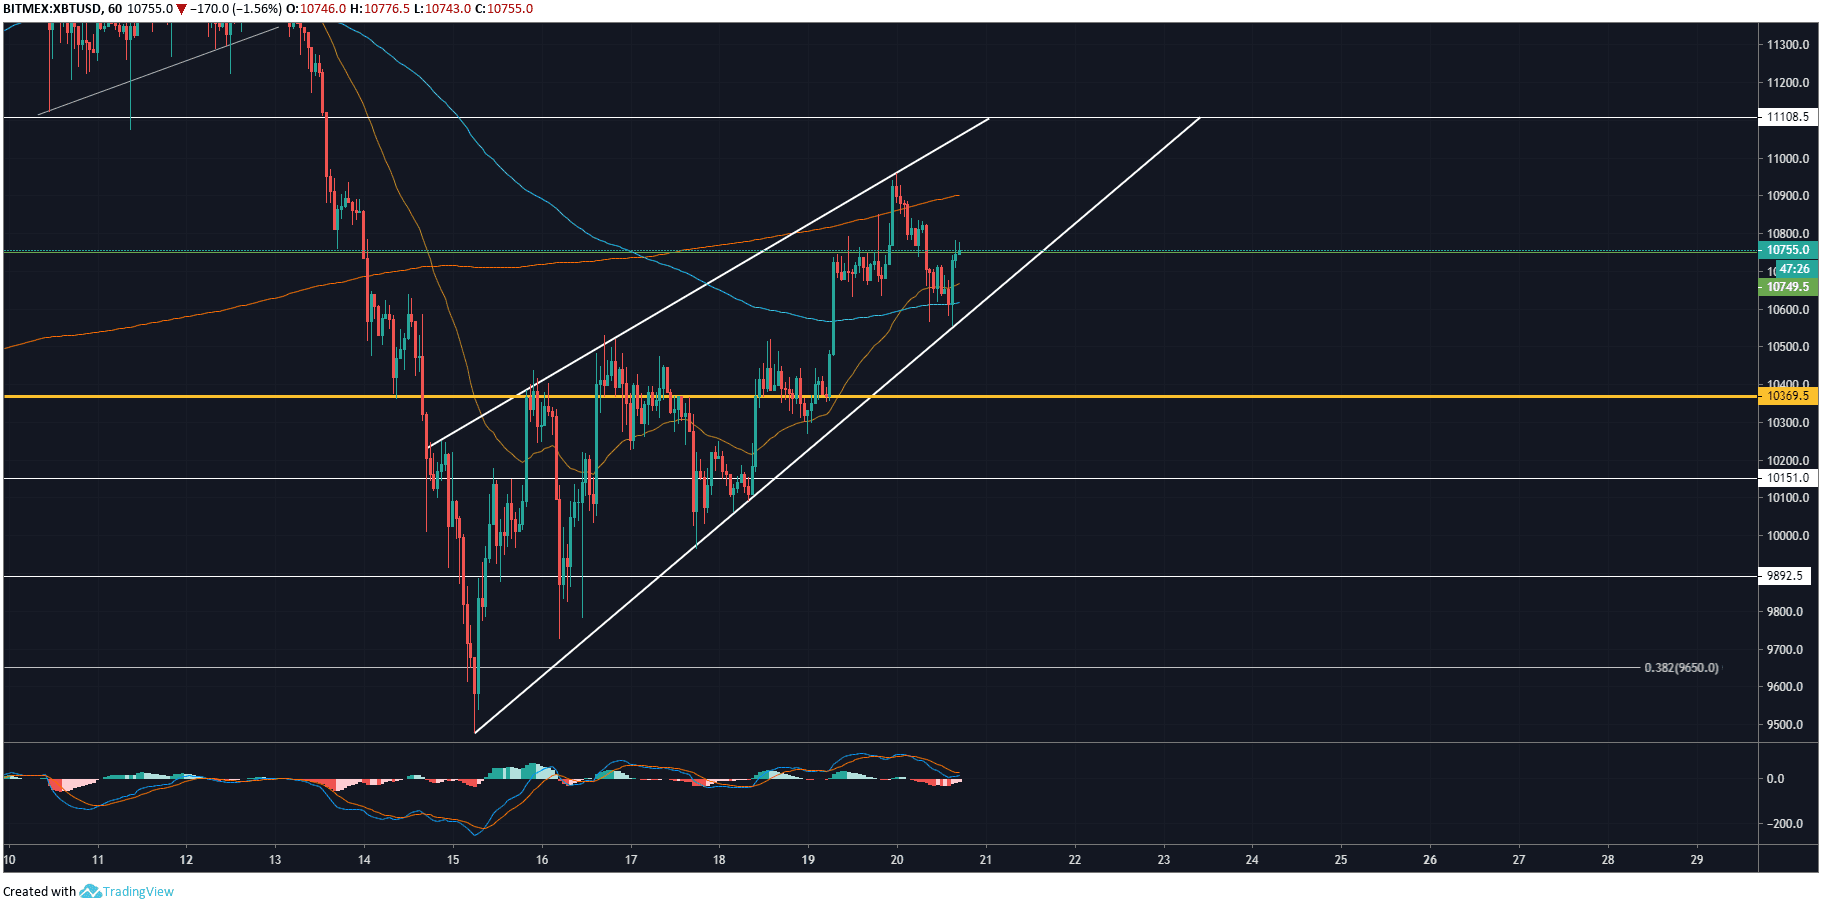
Over the last 5 days, Bitcoin has bounced off the 0.382 Fibonacci level as mentioned in my previous analysis. Since then price levels have risen sharply testing resistance just shy of $11,000. An influx of new volume could propel price levels to $12,000 next week.
Bitcoin 1-Hour Analysis

On the 1 hour chart for XBT/USD, we can see the formation of the recent ascending wedge. Similar to a rising wedge, however different in the sense that ascending wedges form prior to a down-trend and rising wedges form prior to an up-trend. Despite Bitcoin rising from $9,600 to $10,900 over the last 5 days, no real momentum has built upon MACD and price action has been reasonably slow and steady thus forming such a tight channel.
It’s difficult to gauge whether the slow and steady price action indicates weakness in the uptrend, or strength at this point, however, we’ll know over the coming days. If price levels break down through the wedge support we know the uptrend was unsustainable and will likely re-test $9,600. Adversely, if the resistance point around $11,100 it’s likely that this resistance point will then become a support level.
If price levels do break-down, confirmation of a new short-term downtrend will arrive once price action drops below the POC (Point of Control) level at $10,350. This is the strongest support before $9,600 and will be useful when trying to gauge the strength of the potential break-down through the wedge support as mentioned.
4-Hour Analysis
![]()
On the 4 hour chart for XBT/USD, we can see the orange 500-day moving average has finally caught up to the current market price action, sitting just below at $10,200. This is a sign of consolidation which is evident on Bitcoin over the last few months since the high of $14,000, and will also act as a strong support level.
The last three candles can be seen bouncing off of the 4 hour POC (Point of Control) at $10,560 within the ascending wedge. This a sign that perhaps the trend isn’t as weak as it appears on the 1-hour chart. There will need to be a large amount of selling pressure entering the market during the break-down in order for support levels at $9,600, $9,890, and $10,200 to be broken.
200 EMA (blue line) is sat right below the current market price and appears to be levelling out. This will also act as a strong support level. This in conjunction with POC right below the market price indicates strength in the current short-term trend. This will be confirmed once the resistance at $11,100 and $11,250 is broken.
Do you think Bitcoin will break through the resistance at $11,100? Please leave your thoughts in the comments below!
This article is strictly for educational purposes and should not be construed as financial advice.
Images via Shutterstock, XBT/USD charts by Tradingview
The Rundown
The post appeared first on Bitcoinist


