Quick recap: Bitcoin was trading inside a tight range over the weekend. Once the Monday’s Wall Street futures started trading on Sunday afternoon (U.S timezone) – Bitcoin price followed along.
The futures forecasted a 2-3% significant declines. At that time, Bitcoin was fighting to stay on top of the $8900 – $9000 crucial support range, after an intra-day loss of $400, breaking down the mentioned range.
However, as the major U.S. indices got greener during Monday’s trading day – Bitcoin followed along. Did someone say the correlation to the global markets is back?
The S&P 500 had seen a 3.5% jump during the day. Bitcoin had reached $9600 as its current daily high.
What’s Next?
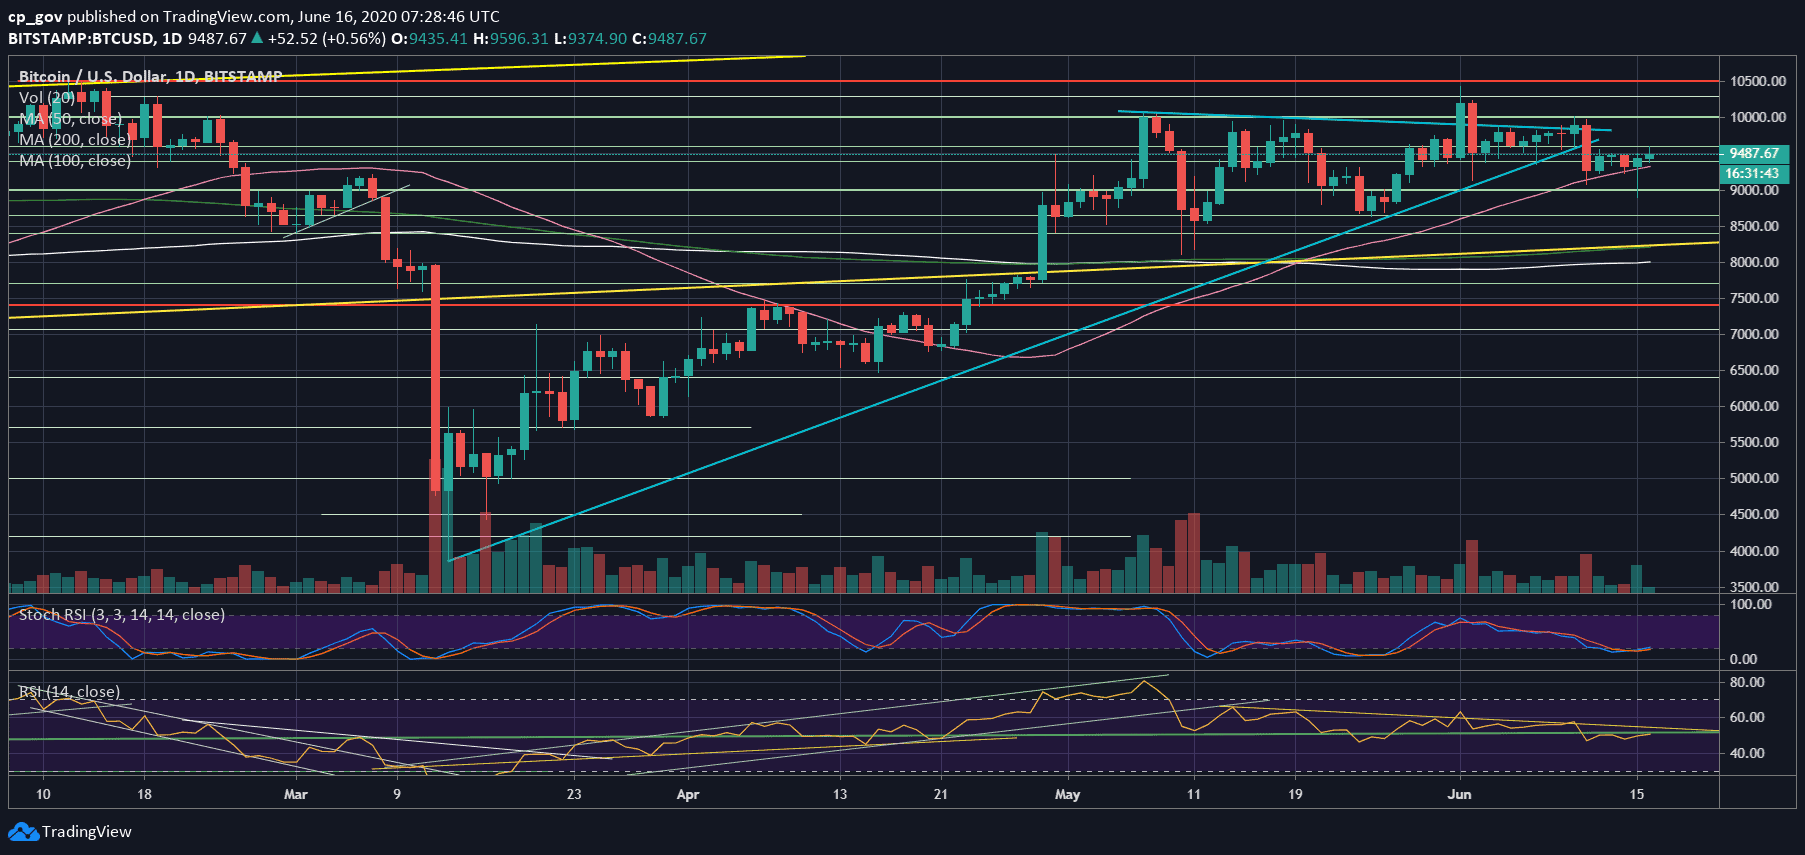
As of writing these lines, the direction is not yet clear, in my opinion. From the bullish side, Bitcoin maintained the critical support zone around $9K, and looking at the weekly overview, the current week’s candle is a beautiful Doji candle, which holds the critical ascending 2015 trend-line (need to close above $9300 for that).
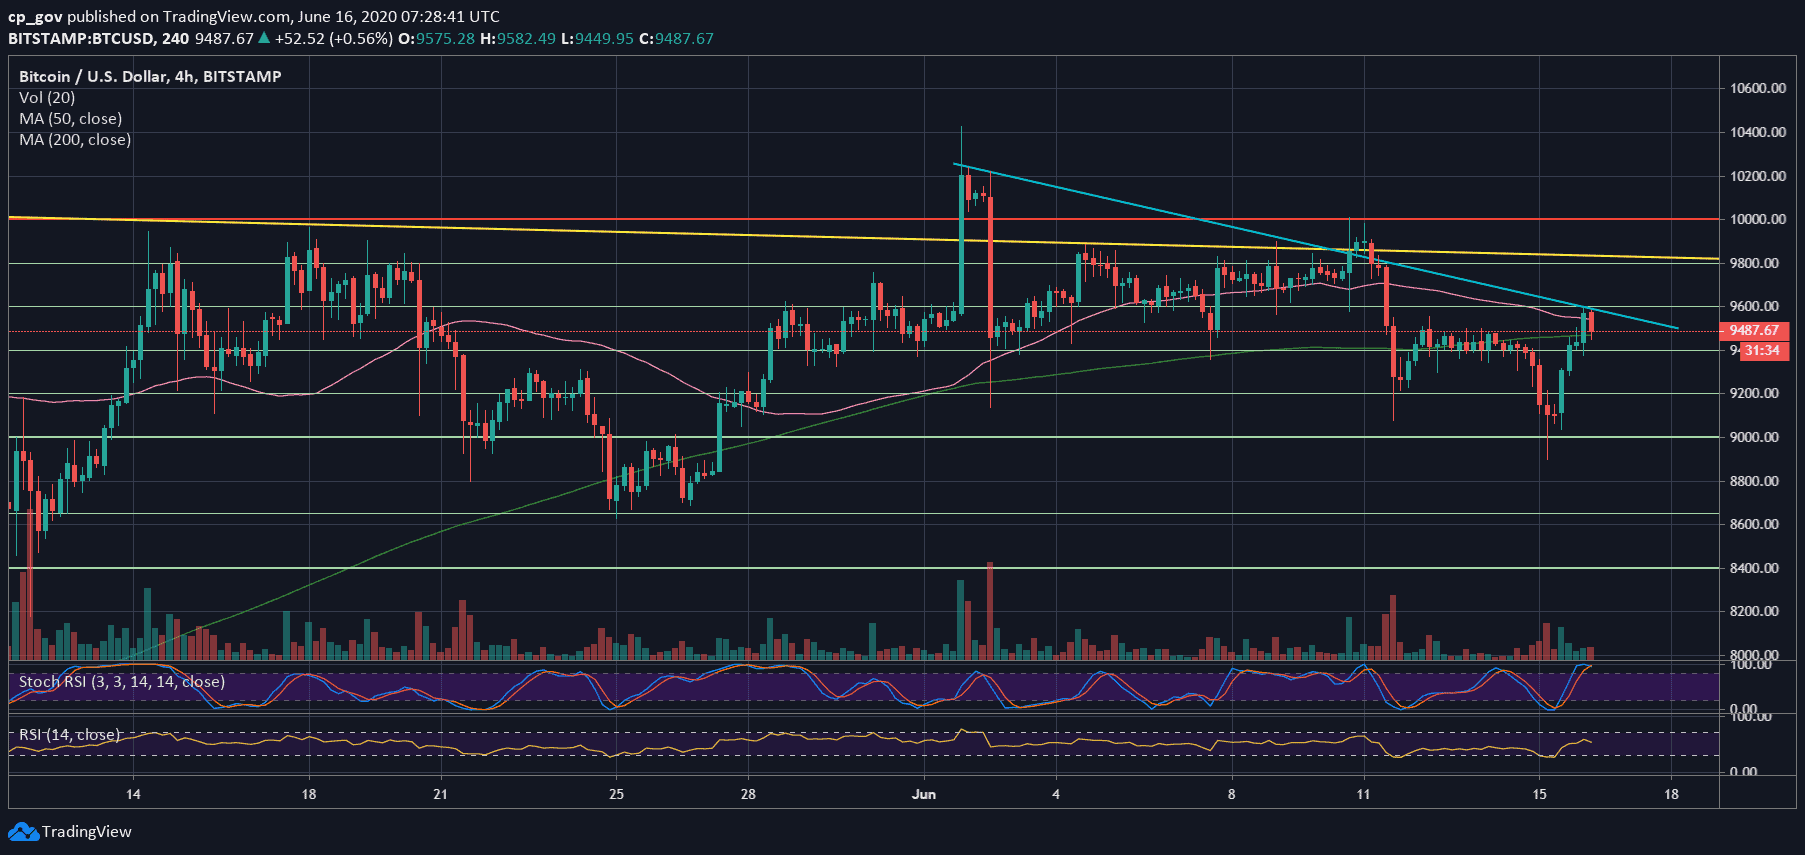
However, on the other hand, the daily RSI cannot break above 50, as of writing these lines. Bitcoin is now facing the $9600 as the first level of resistance (the marked blue trend-line on the 4-hour chart) but will also look to break the lower-high trajectory, which is textbook bearish.
The latter will happen only when creating a new higher high above $9800, which is the next resistance after $9600. Further above lies the psychological $10,000.
From the other side, Bitcoin marks $9350 – $9400 as the first support level. This includes the 50-days moving average line (the pink line on the following daily chart).
Further down lies $9200 (weak support) before yesterday’s low at $8900 – $9000.
Despite the excitement, yesterday’s reversal was not followed by a significant amount of volume in total. However, another bearish red flag – the volume of the sell-off was higher than the volume of the buyers during the second half of the day.
Total Market Cap: $268 billion
Bitcoin Market Cap: $174.7 billion
BTC Dominance Index: 65.2%
*Data by CoinGecko
BTC/USD BitStamp 4-Hour Chart
BTC/USD BitStamp 1-Day Chart
The post Bitcoin Price Analysis: BTC Sees Huge $700 Rebound, But Now Is The Real Test appeared first on CryptoPotato.
The post appeared first on CryptoPotato


