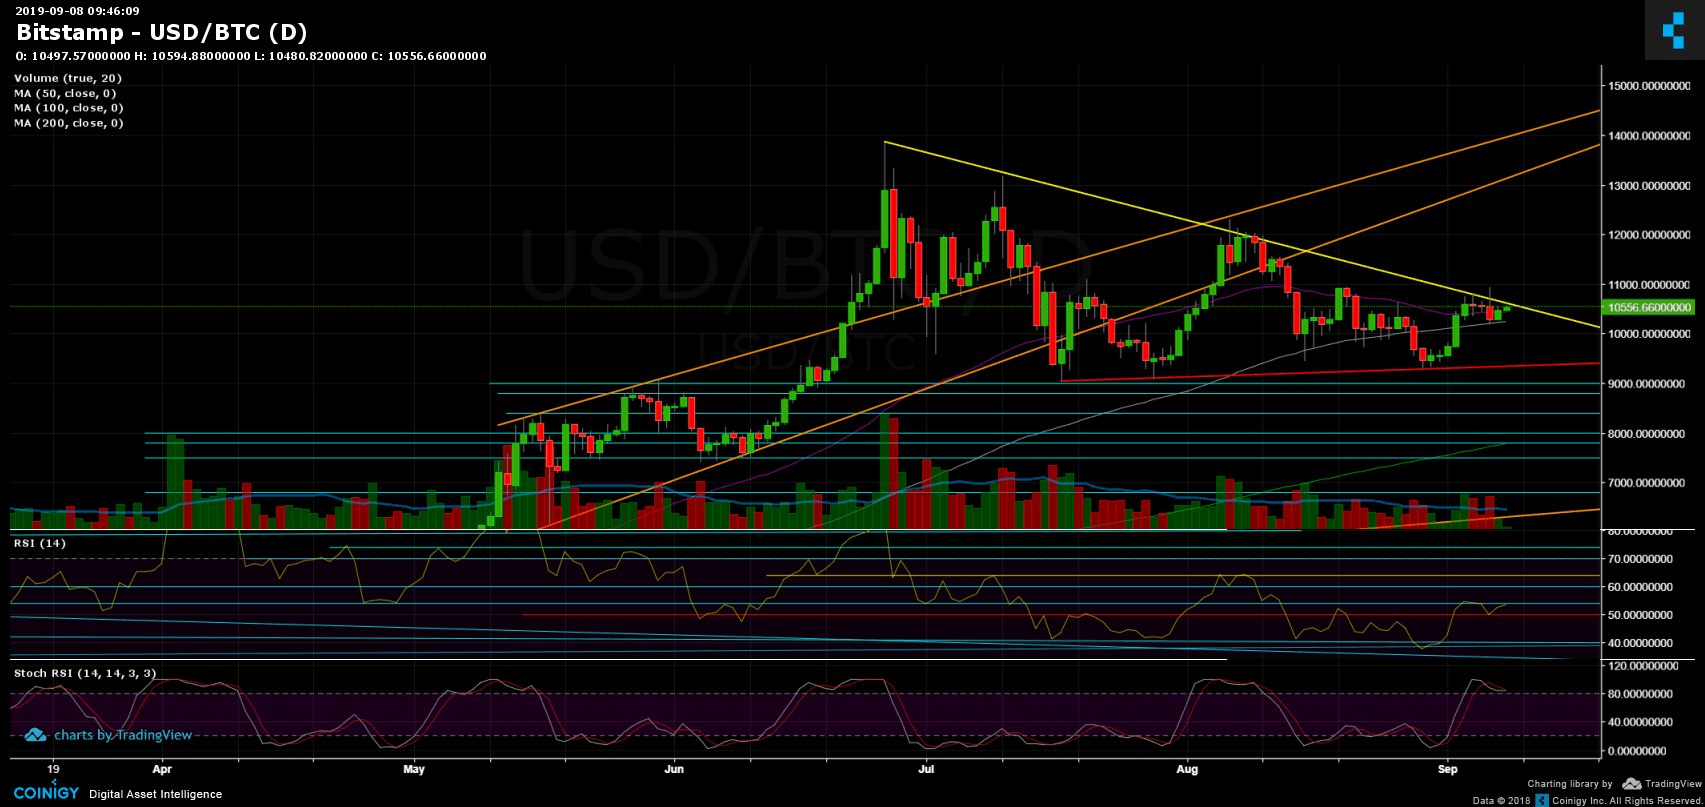
In the last analysis, we had mentioned the crucial descending trend-line, marked with yellow on the following daily chart. This line is ‘preventing’ Bitcoin from discovering new highs since June 26, when Bitcoin reached $13,880 as the 2019 high.
The resisting line was tested for the fourth time, and as it seemed like a breakout is knocking, it turned to be a false one – producing a decent red candle on the daily, with a wick above the line. The hit was hard: Bitcoin plunged $700 in a matter of minutes. Bakkt warehousing or not, we look on the charts, that tells the whole story.
Bitcoin found support on the 100-days moving average line (marked white), not surprisingly, since that line was supporting the coin nicely for the past three weeks.
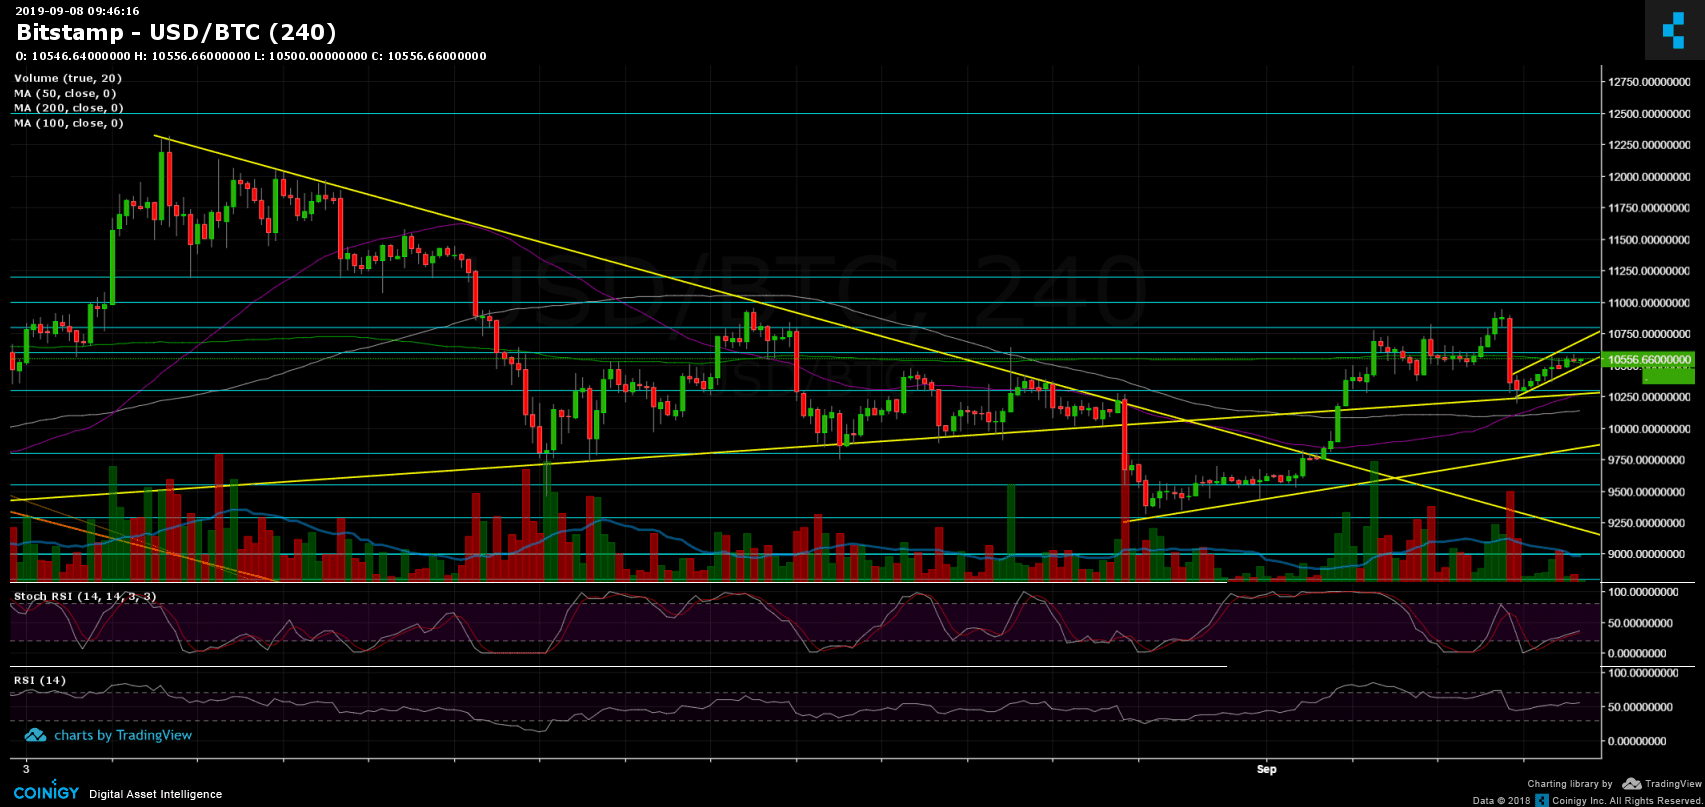
Since the colossal plunge, Bitcoin is slowly recovering and clearly seen as a bear flag on the 4-hour chart. The flag will play out in case of a breakdown and is likely to send Bitcoin back to the $10,000 level if not beyond. This kind of formation usually tends to break to the downside; however, there is always a chance that it will break above (less probability, but things change quickly).
Total Market Cap: $268 billion
Bitcoin Market Cap: $188 billion
BTC Dominance Index: 70.2%
*Data by CoinGecko
Key Levels to Watch
– Support/Resistance:
Bitcoin is aiming for the long-term descending trend-line one more time, at around $10,600. In case of a breakout, the next major boundary is still the $10,800 – $11,000, which is a tough resistance zone with a lot of sellers. A breakout above $11,200 – and things will likely to look much bullish for Bitcoin in the bigger picture.
From below, the first level of support is the 50-days moving average line (marked purple), at around $10,430. Next is the mentioned 100-days MA currently at $10,250, along with the weekly low at $10,200. Next support is found at $10,000 and $9,800.
– Daily chart’s RSI: After encountering a strong resistance around 54-55 (mentioned on our previous analysis), the RSI is reaching there again. Double top or finally a higher high? Soon we will see. In the meantime, the stochastic RSI did make the cross-over at the oversold territory, which ignited the $700 plunge two days ago. As of now, it is again in a decision point.
– Trading Volume: Despite the price action from the past days, the volume is still not significant and far from the average level of May – July.
BTC/USD BitStamp 4-Hour Chart
BTC/USD BitStamp 1-Day Chart
More news for you:
The post appeared first on CryptoPotato


