Bitcoin’s volatility is breaking records, as the primary cryptocurrency approaches its third halving in a few hours.
After yesterday 20% plunge to $8K, Bitcoin had recovered more than halfway. As of writing these lines, Bitcoin is trading around the $9000 mark.
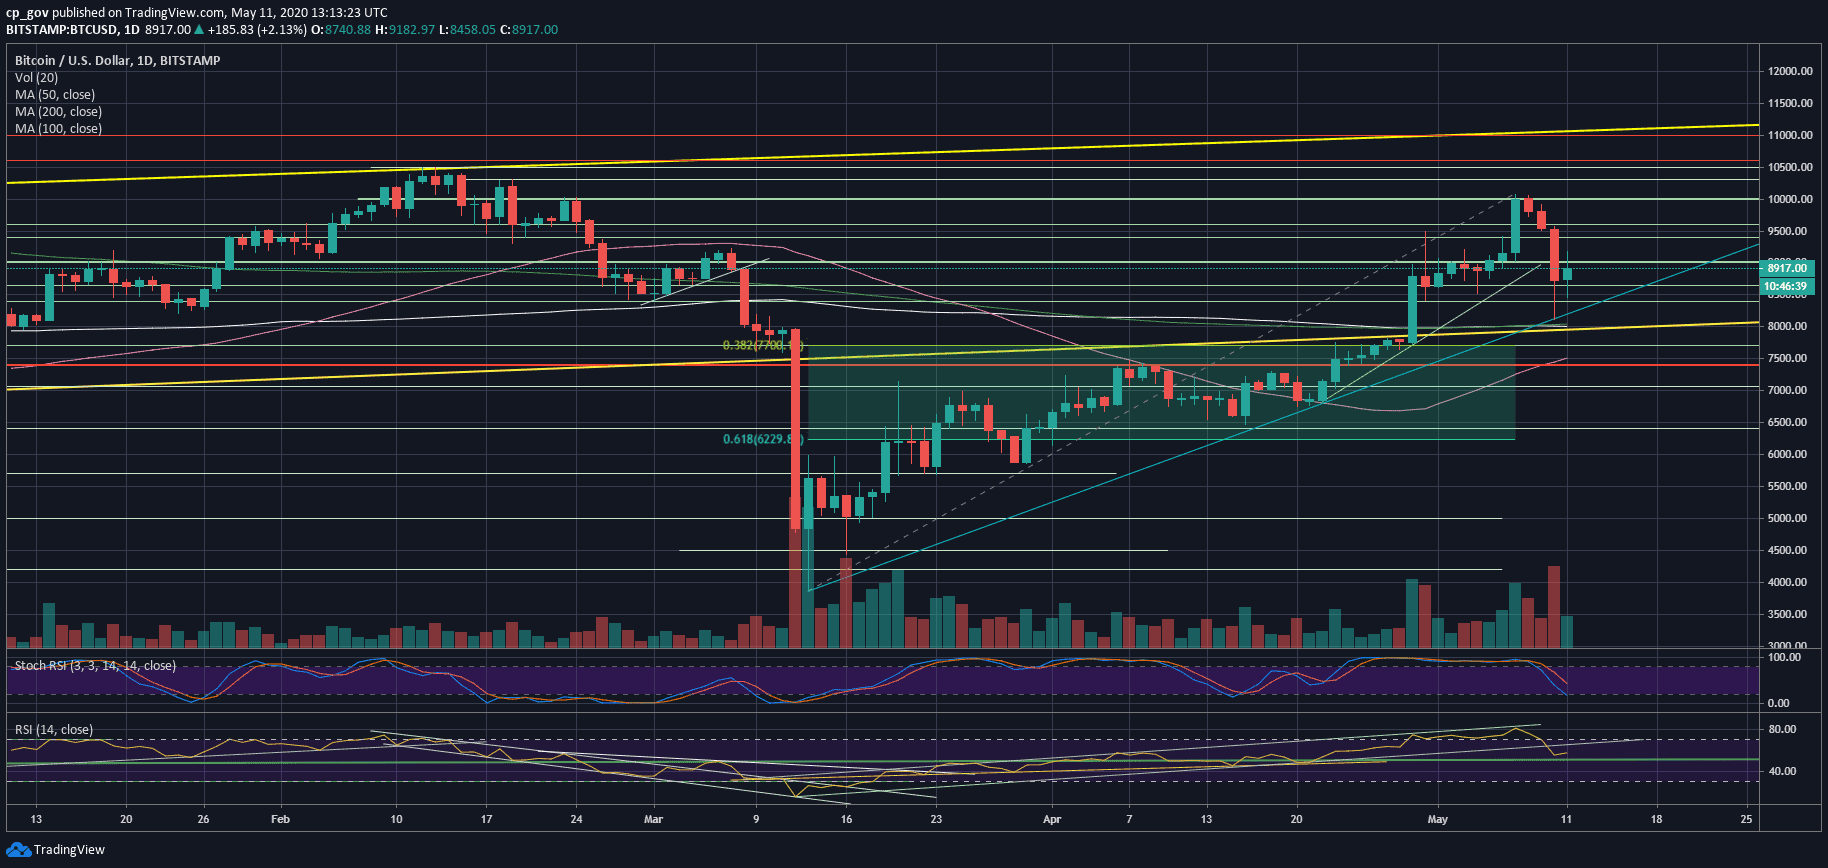
As we stated here on yesterday’s BTC analysis, the violent plunge that took place on Sunday found strong support at the $8K price zone, which includes the 200 and the 100 days moving average lines, along with the ascending trend-line which started forming on March 12, 2020.
These were the “good news” of yesterday’s price decrease. As we can witness today, it was some good news indeed.
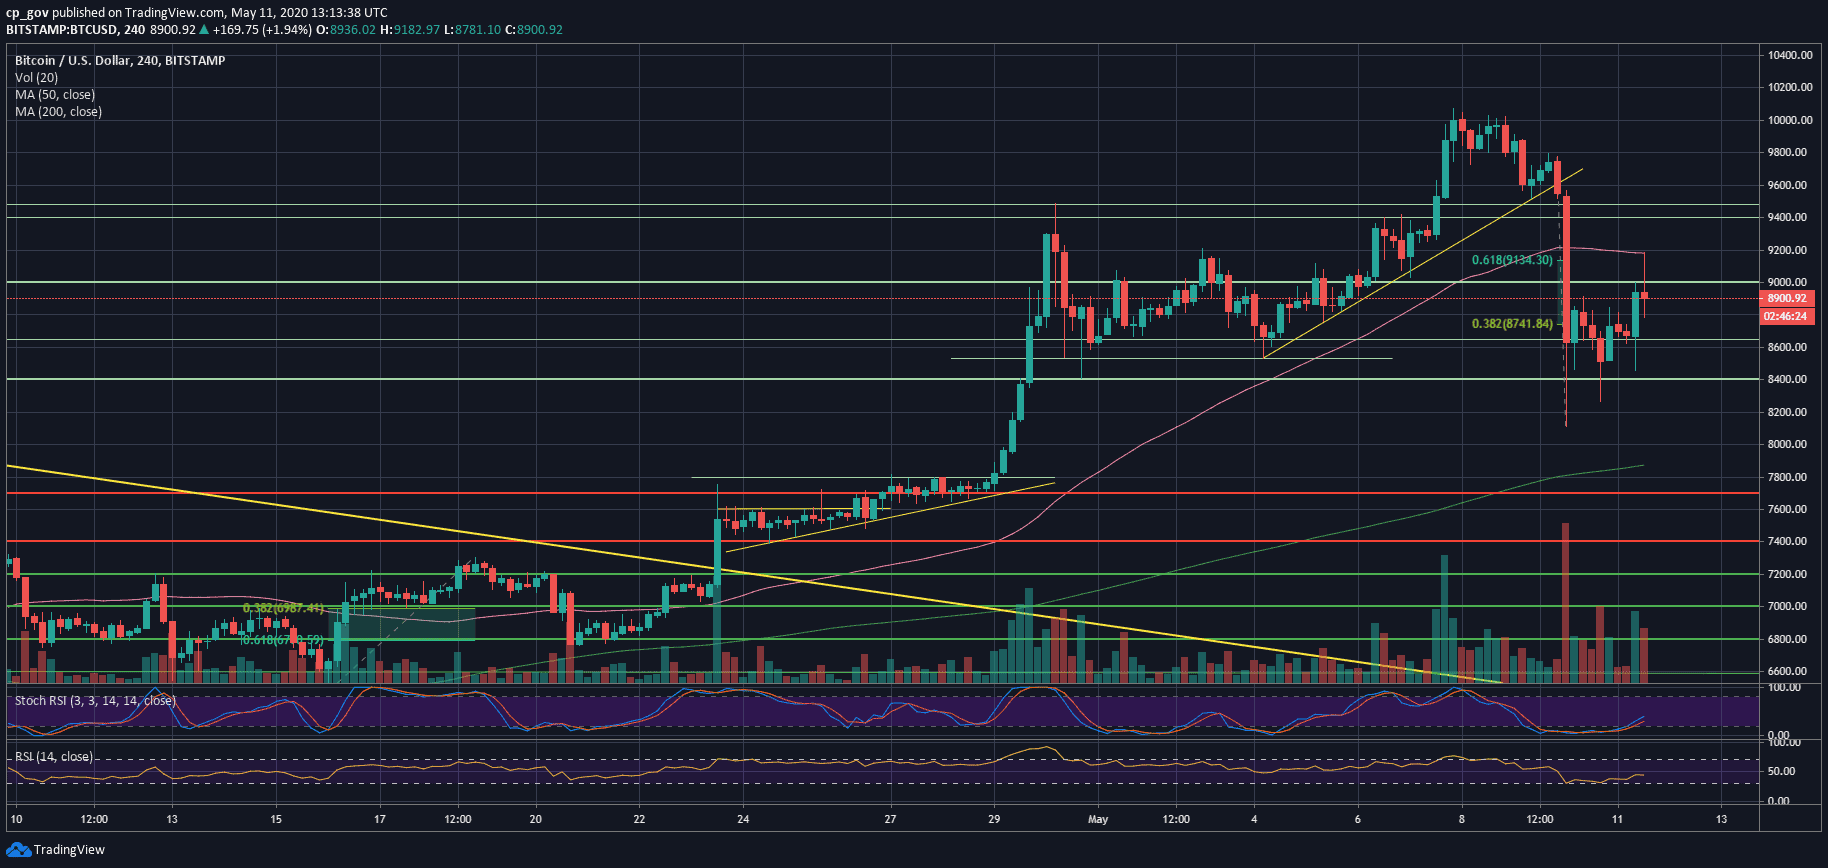
Earlier today, Bitcoin was trading mostly between $8600 – $8800 and over the past hour Bitcoin broke out – surged to $9200, retraced in minutes back to $8800 – and currently trading around the $9K mark. The current daily high lies almost at $9200.
This is not a coincidence – the $9130 – $9200 was mentioned yesterday as a challenging resistance area for Bitcoin since it is the Golden Fibonacci (61.8%) retracement level of the Sunday’s plunge.
The Halving Is Here
The halving takes place once every four years. Typically, we are expecting high volatility in the coming hours until the actual halving, which will happened once block number 630,000 is mined.
Due to the expected volatility to both ways, sometimes it is wise to sit aside and wait for the storm to pass, instead of trading and getting stopped out following this unique event. This is particularly true for beginners in trading.
Total Market Cap: $243 billion
Bitcoin Market Cap: $164.5 billion
BTC Dominance Index: 67.5%
*Data by CoinGecko
Key Support & Resistance Levels To Watch
Support and Resistance
As of writing these lines, the first level of support is now at $8800, followed by $8600. In case the last two level do not hold, then today’s low, around $8400 will be the next level of support.
Further below lies the $8K level, which includes the MA-200 and MA-100, followed by $7700, which is also the 38.2% Fibonacci retracement level (since the March 12 recovery).
From above, the first level of resistance is now the mentioned-above area of $9130 – $9200 area, which is the Golden Fib level and the daily high. This is followed by $9400 – $9500, $9800, and $10,000.
Trading Volume
Sunday’s volume was the highest volume day since April 29-30, when Bitcoin surged from $7700 to $9600. This is mainly because the huge amount of long liquidations.
BTC/USD BitStamp 4-Hour Chart
BTC/USD BitStamp 1-Day Chart
The post Bitcoin Price Analysis: Despite $1000 Recovery, Traders Must Be Aware of Extreme Volatility As The Halving Approaches appeared first on CryptoPotato.
The post appeared first on CryptoPotato


