View
- Bitcoin’s five-day winning run, the longest in a month, has neutralized the short-term bearish view. A UTC close above the lower high of $10,956 created on Aug. 20 is needed for a bullish revival.
- Volumes picked up on Tuesday, adding credence to Monday’s triangle breakout on the daily chart. So, a rise to $10,956 may be on the cards.
- The probability of a move above $10,956 would weaken if the prices drop below key the crucial support at $10,286 on the hourly chart. Acceptance below that level could yield a deeper drop into four figures.
Bitcoin (BTC) has charted its longest daily winning run in a month, but is yet to confirm a short-term bullish revival with a move above key resistance near $11,000.
The premier cryptocurrency eked out 2.24 percent gains on Tuesday, having risen by 0.95, 0.15, 1.81, and 6.32 percent on Friday, Saturday, Sunday, and Monday, respectively, according to Bitstamp data.
That five-day winning streak is the longest since early August. Back then, BTC rallied over the seven straight days from July 30 to Aug. 5.
The longest daily winning run of 2019 is the eight-day rising trend observed from July 19 to July 26, which produced a rally from $9,000 to a 17-month high of $13,880.
With the latest five-day upwards climb, BTC has largely recovered its drop from the Aug. 21 high of $10,807 to a one-month low of $9,320 on Aug. 29. The cryptocurrency clocked a high of $10,807 yesterday and was changing hands at $10,570 at time of writing (prices from Bitstamp).
The bounce has neutralized the short-term bearish view put forward by the range breakdown witnessed on Aug. 28 and the outlook would turn bullish if prices print a UTC close above $10,956 (Aug. 20 high), invalidating the lower-highs setup, as discussed yesterday.
The probability of BTC challenging $10,956 has increased in the last 24 hours, according to the technical charts.
Daily chart

BTC jumped 6 percent on Monday, confirming an upside break of a descending triangle pattern, a bullish development.
Monday’s move lacked volume support and looked unsustainable. Prices, however, rose to a 13-day high of $10,783 yesterday with buying volume (green bar) hitting the highest level since Aug. 15 – the day BTC charted a quick recovery from $9,467 to levels above $10,000.
That’s given the triangle breakout credence and prices could rise to $10,956 in the next day or two.
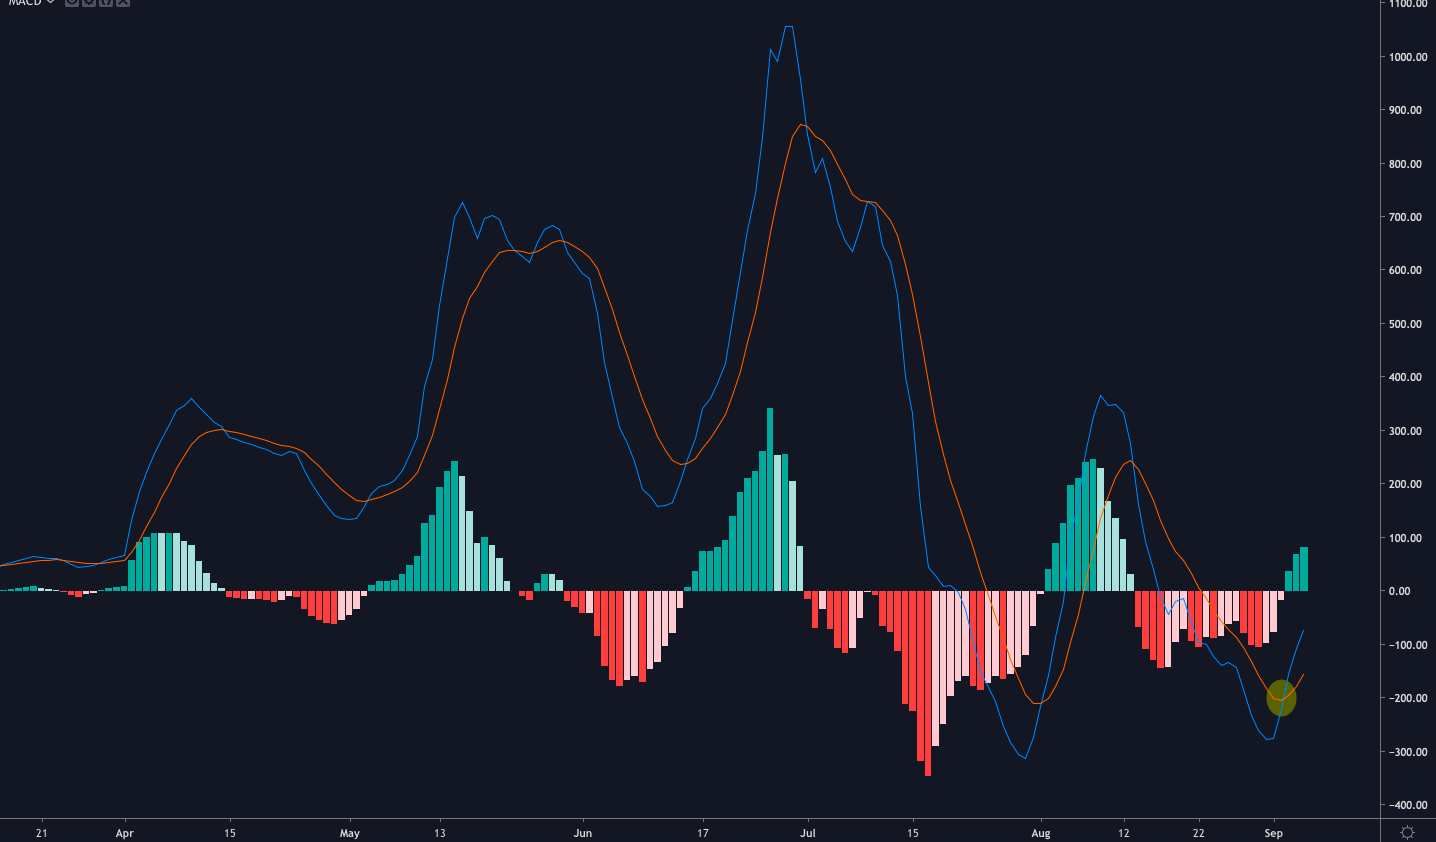
Supporting the bullish case is the moving average convergence divergence (MACD) histogram’s move above zero and an above-50 reading on the relative strength index (RSI). The 5- and 10-day moving averages have also produced a bullish crossover.
A high-volume daily close above $10,956 would open the doors to the next major resistance lined up at $12,000.
Hourly and weekly charts

BTC is trapped in a falling channel on the hourly chart (above left) and is currently bouncing up from the rising trendline support.
An upside breakout – an hourly close above the upper edge of the channel at $10,637 – would imply a resumption of the five-day winning run and further boost the prospects of a move above the bearish lower high of $10,956.
The bullish case, however, would weaken if prices find acceptance below the rising trendline and dive below $10,286 (horizontal support line). That would shift the focus back to the bearish indicators on the weekly chart (above right) and could yield a deeper drop to levels below $10,000.
On the weekly chart, the 5- and 10-week MAs have produced a bearish crossover and the MACD histogram is reporting bearish conditions for the first time since February. Other indicators are also biased bearish, as discussed yesterday.
Disclosure: The author holds no cryptocurrency assets at the time of writing.
Bitcoin image via Shutterstock; charts by Trading View
Bitcoin Short of Bull Target Despite Five Days of Price Gains
The post appeared first on Crypto Asset Home


