Disclaimer: The findings of the following article are the sole opinion of the writer and should not be taken as investment advice
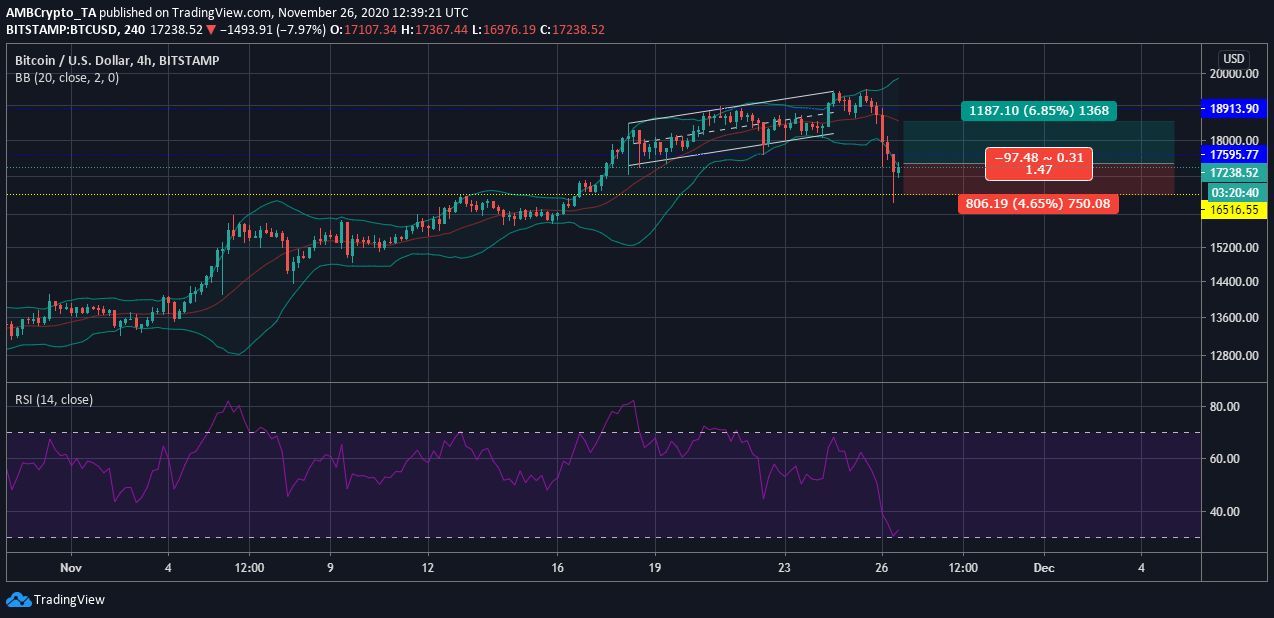
The value of Bitcoin had been appreciating without any hiccups for the past one month, until quite recently. In fact, over the past 48 hours, soon after Bitcoin climbed to a local top of $19,490, BTC fell dramatically on the charts, with the cryptocurrency’s value noted to be $17,238, at the time of writing.
In fact, Bitcoin’s price was observed to have broken out of an ascending channel, with the coin’s momentum claiming to hit a peak in the market.
Bitcoin 4-hour chart


Source: BTC/USD on TradingView
The attached chart indicated that as Bitcoin reached its peak, the volatility in the market started to rise. The aforementioned volatility in a bullish market signaled a possible reversal, one took place sooner rather than later. The price broke out of an ascending channel, downwards, and dipped under its immediate support at $16,516 briefly, before bouncing back. However, traders do expect to see the price rise momentarily and can assume long positions.
Reasoning
The rise in volatility is evidenced by the Bollinger Bands that were diverging, at the time of writing. The cryptocurrency’s fall in value gave rise to bearish sentiment in the market, with Bitcoin dropping close to the overbought zone.
The Relative Strength Index noted that BTC was retracing from the support at 30 and was moving up. This northbound momentum could stabilize Bitcoin’s price and provide an opportunity for the traders to long the coin.
Positions
Entry for a Long position: $17,336
Take Profit: $18,523.10
Stop Loss: $16,889
Risk/Reward Ratio: 2.66
Conclusion
The present value of BTC may have been depleted by corrections, but it will move up, at least briefly, to stabilize. There is a resistance level at $17,595, but the cryptocurrency might be able to push through this and traders can make a profit at $18.5k.
The post appeared first on AMBCrypto


