Disclaimer: The findings of the following article should not be taken as investment advice and the latter is the sole opinion of the writer
Bitcoin has been under immense bearish pressure lately. For the 2nd time in a week, Bitcoin tested its support line at $11,361. In fact, it was also observed that Bitcoin had tested its support lines more than its resistance at $12,000, in the month of August. With the Bitcoin market largely under the bear’s grip since topping off at $12,400, the likelihood of Bitcoin dropping below $11,000 seemed to be rising with every passing day.
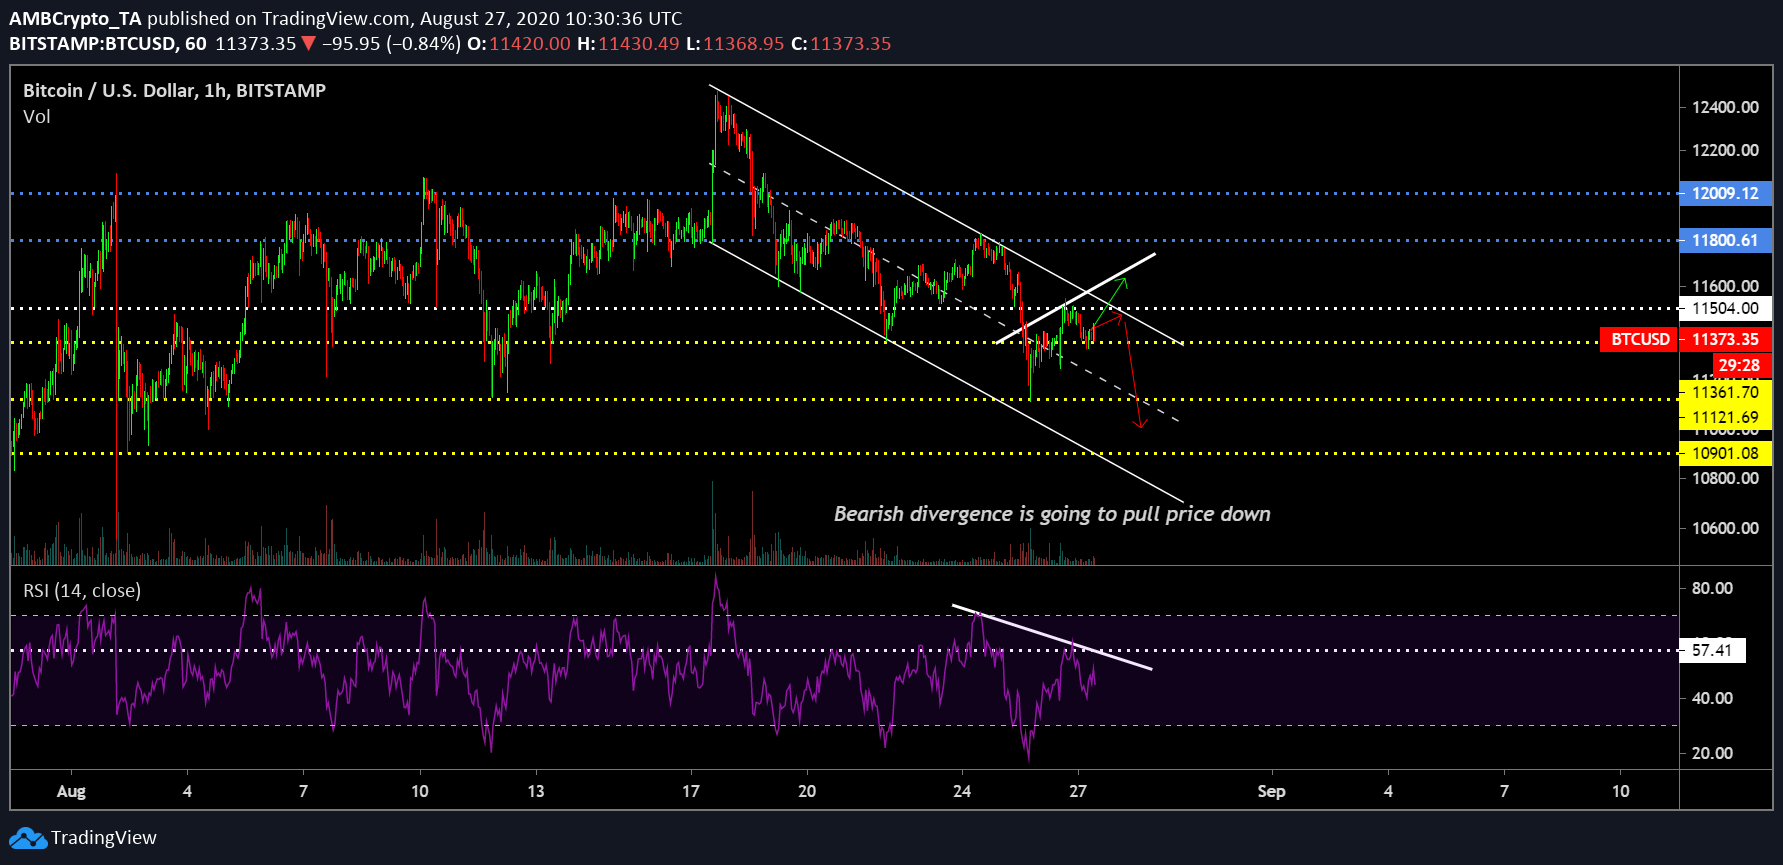
Bitcoin 1-hour chart


Source: BTC/USD on TradingView
On observing Bitcoin’s 1-hour chart, the short-term turnaround seemed actually bullish. Facilitating a descending channel pattern carries bullish implications and the press time trend indicated that Bitcoin might actually register a recovery from here on. However, the overall trend was extremely against the rise in value, at the time of writing. The likelihood of a bullish turnaround will improve if Bitcoin is able to consolidate its position above the weekly resistance of $11,504 for an extended period.
Hence, considering the high selling pressure, it is likelier that Bitcoin will depreciate further below $11,361 over the next few days. Here, the major giveaway was the creation of bearish divergence. As observed on the charts, the Relative Strength Index has been declining over the past few days, with Bitcoin registering only a minor recovery on the charts. Therefore, the likelihood of another price pullback increases significantly due to such an indication.
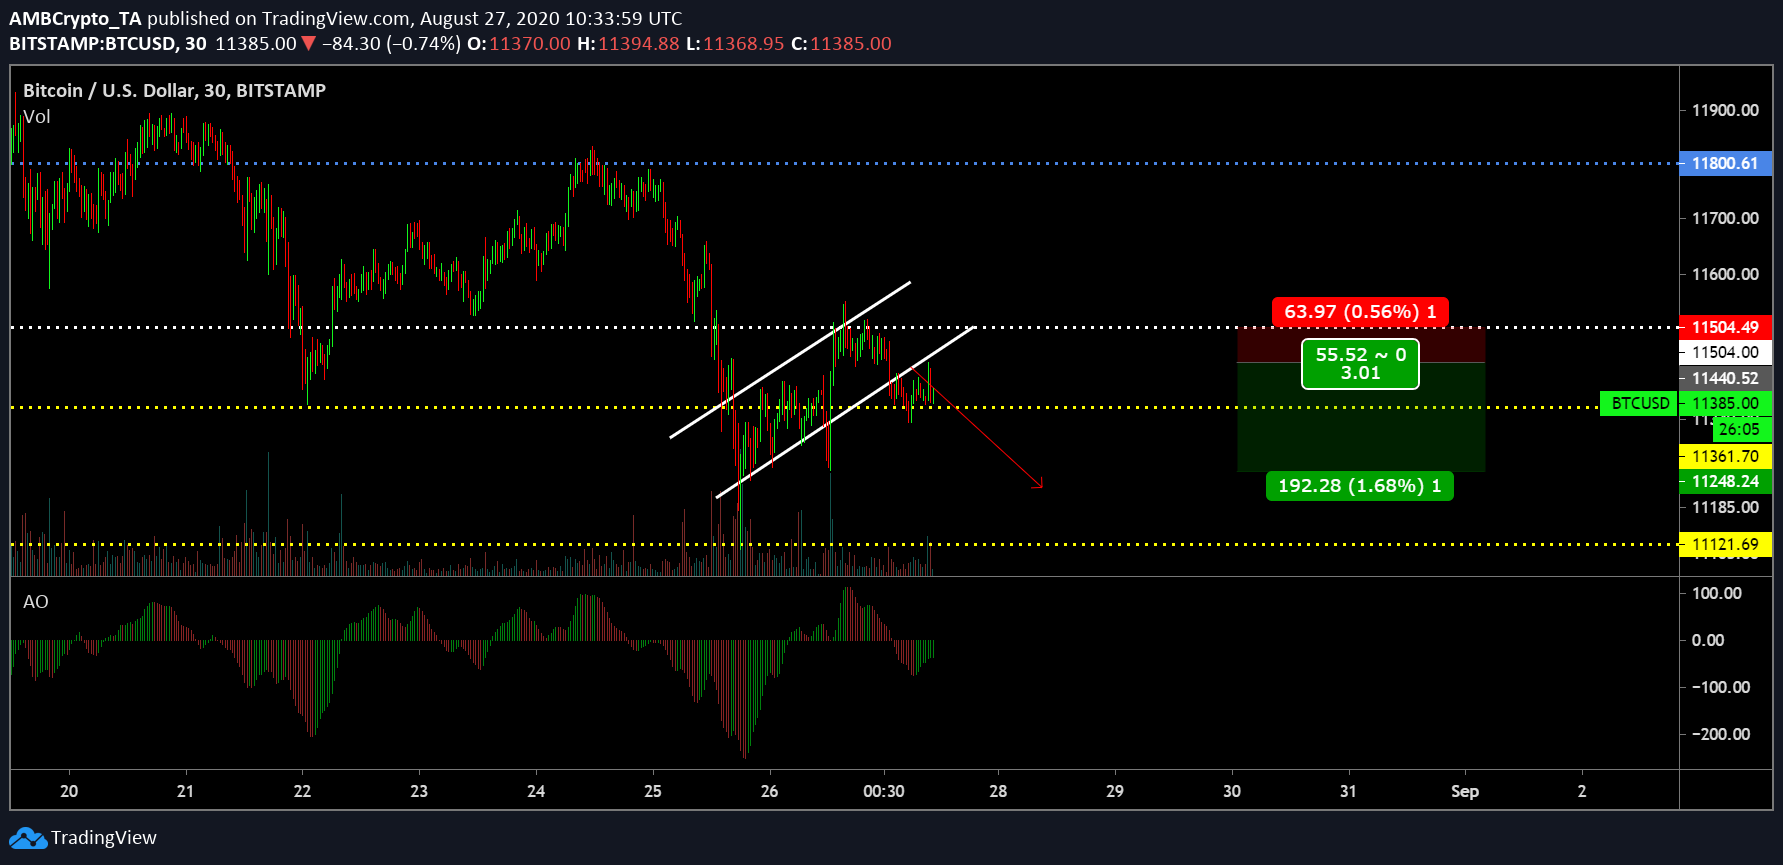
Bitcoin 30-min chart


Source: BTC/USD on TradingView
With the possibility of another decline opening up, there is a window of opportunity for a short position in the market. Traders looking to make a quick profit may enter a sell position at $11,440 with a stop-loss placed at the immediate resistance of $11,504. With the drop percentage uncertain, Bitcoin may decline down to $11,250, allowing the placement of taking profit order at $11,248. The trade allocates a Risk/Reward ratio of 3.01x, possibly materializing within the next few days.
With the Awesome Oscillator pointing to decreasing bullish momentum, a reversal seemed imminent at press time, with the bears returning to the short-term market.
Conclusion
Bitcoin will note a drop below $11,300 within the next 24-48 hours.
The post appeared first on AMBCrypto


