Disclaimer: The findings of the following analysis should materialize over the next 24-hours
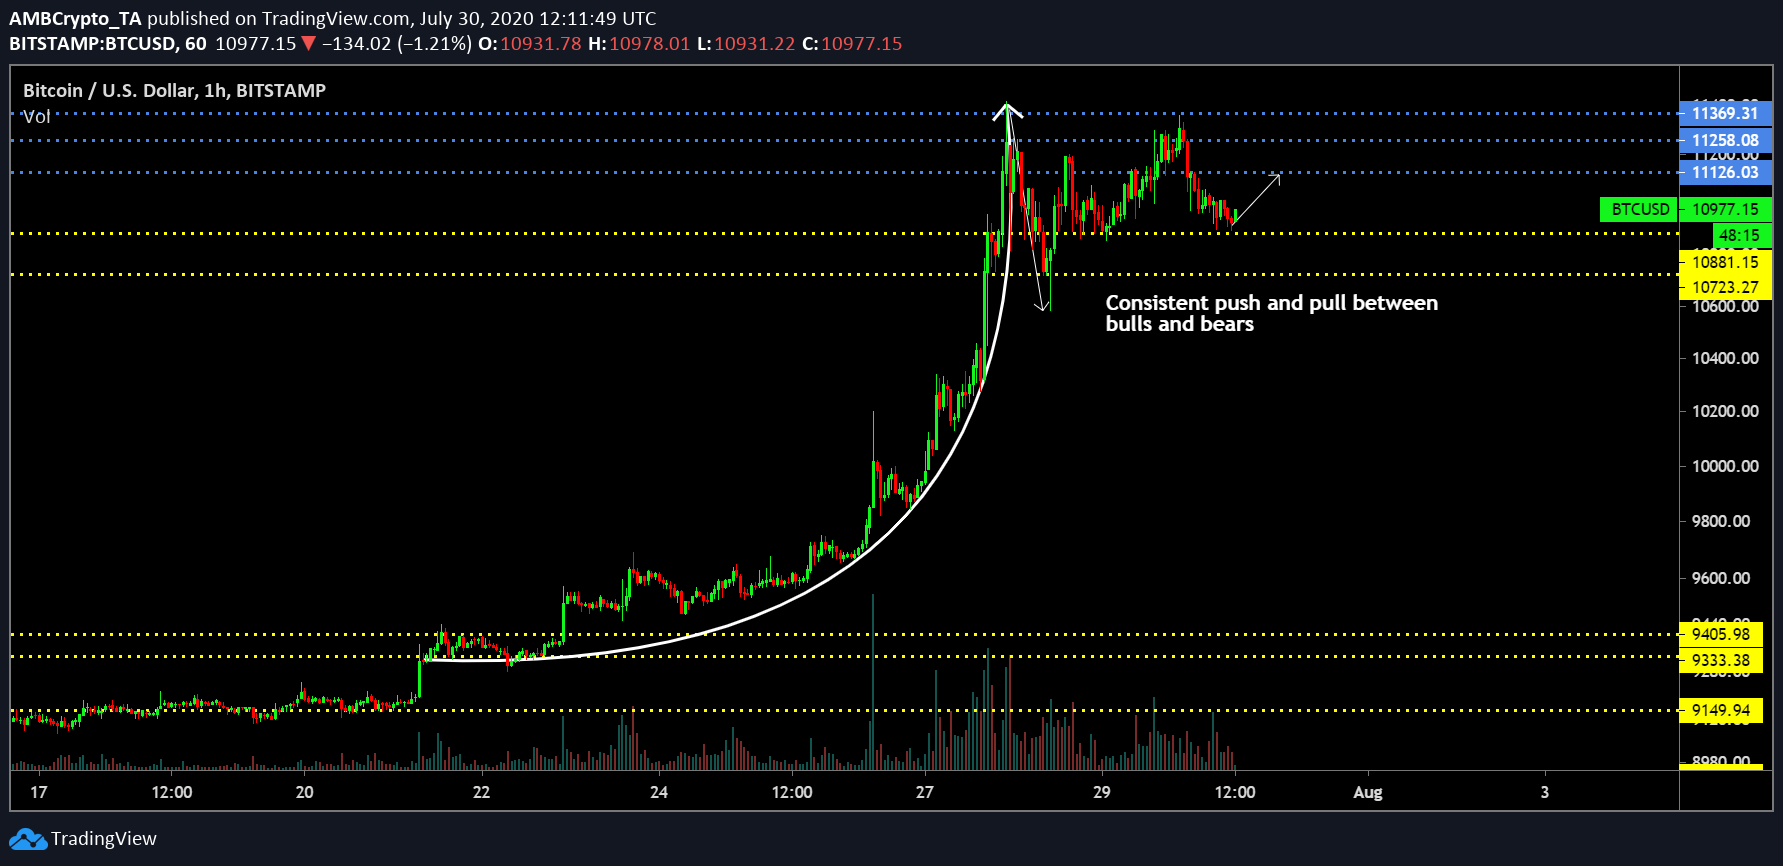
Bitcoin has been brimming with bullish momentum lately, but the world’s largest digital asset could be reaching the end of its rope. Between 21 July 7:00 UTC and 27 July 22:00 UTC, Bitcoin’s price literally spiked within the parabolic curve illustrated below and this was followed by a timely breakout on the charts.
Bitcoin 1-hour chart


Source: BTC/USD on TradingView
Until the breakout, the bulls had kept its hands (Or hooves) on the wheel, while the bears took the backseat. However, since then, it has been a case of a power struggle between the trends as a continuous push and pull trend has led to range consolidation. From a price perspective, it is positive since Bitcoin is sustaining itself at a higher range. However, another breakout seemed imminent, at the time of writing.
Upon analysis, it is possible Bitcoin will register another bounceback from its support at $10,880, while going on to re-test the range around $11,000. Subsequent resistance levels lay at $11,126, $11,258 and $11,369. In fact, the resistance at $11,126 will most likely be met over the next 24-hours.
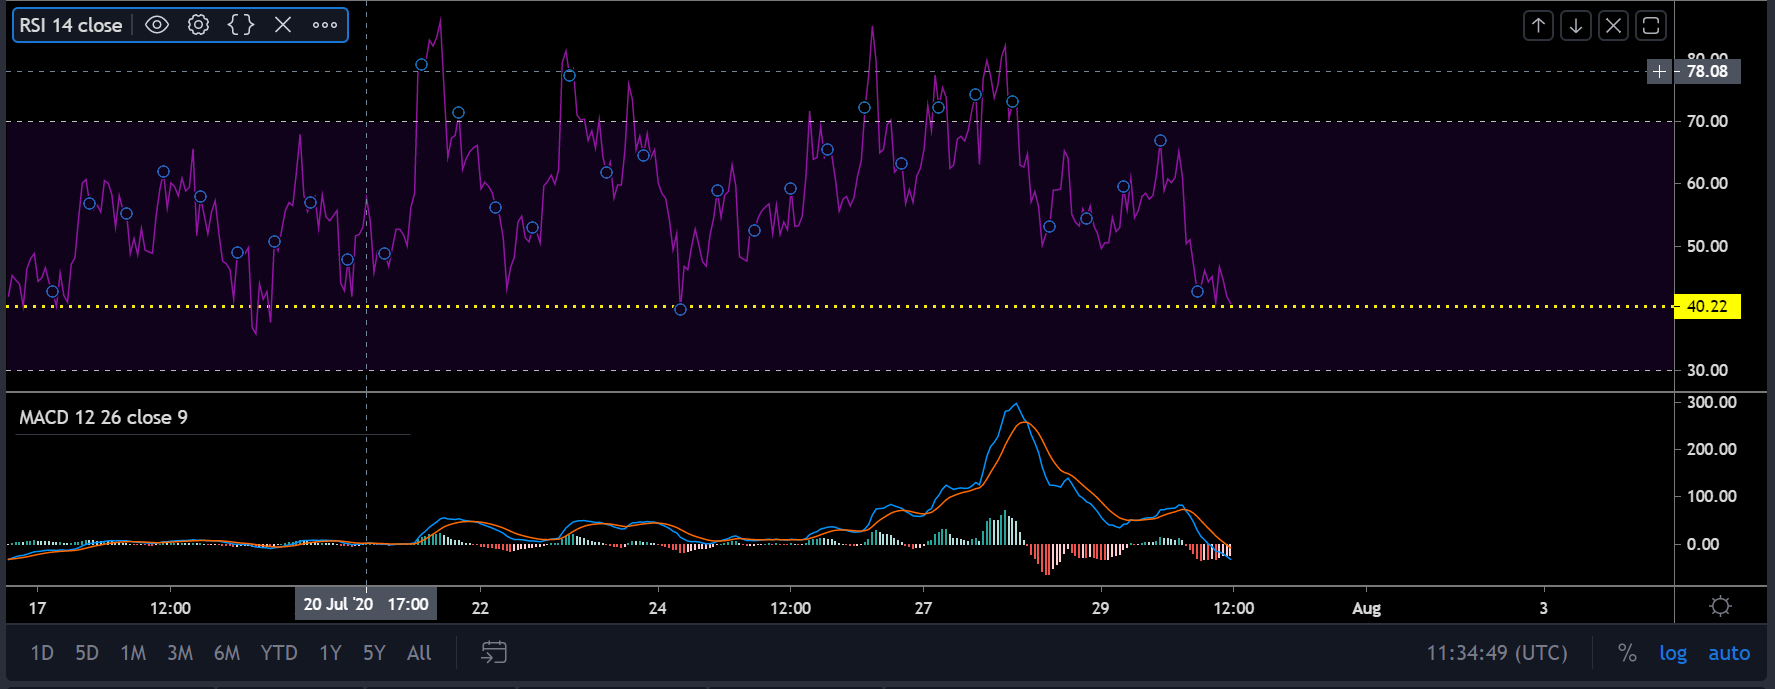
The Relative Strength Index or RSI suggested a reversal as well, reaching its support index mark at 40. From here on, the bulls are likely to regain control for the short-term. The MACD pointed to a bearish trend, at the time of writing, due to the last 24-hours’ correction. However, the blue MACD line was approaching the red Signal line once again to attempt a reversal.
O.786 Fibonacci holds, but till when?
Now, between 21 July and 30 July, the only Fibonacci retracement for Bitcoin that had been tested was the 0.786. The support line at 0.786 has held strong, but if BTC is unable to breach $11,417 over the next few days, it is unlikely to hold further during the next bit of correction. Over the next week or so, there will be further clarity about Bitcoin’s future might be attained.
Conclusion
Bitcoin will undergo a rally over the next 24-hours and the resistance at $11,126 will be tested,
The post appeared first on AMBCrypto


