Is this the day we had been waiting for? Bitcoin completed an 18% price surge over the past 24 hours. But not just that.
Yesterday, we mentioned that despite the massive crash in the global markets, Bitcoin’s showing stability above the $5,000 price mark. That stability of yesterday, was the first time after weeks, that Bitcoin was not fully correlated with the stock markets.
Today we received another confirmation of this trend: While the S&P 500 had seen a slight 0.5% increase, Bitcoin price soared 18%, surpassing the $6,000 mark.
As we said here yesterday, Bitcoin was steadily trading between the range of $5000 and $5500. We also noted that any breakout to either direction would likely point the next short-term direction for Bitcoin.
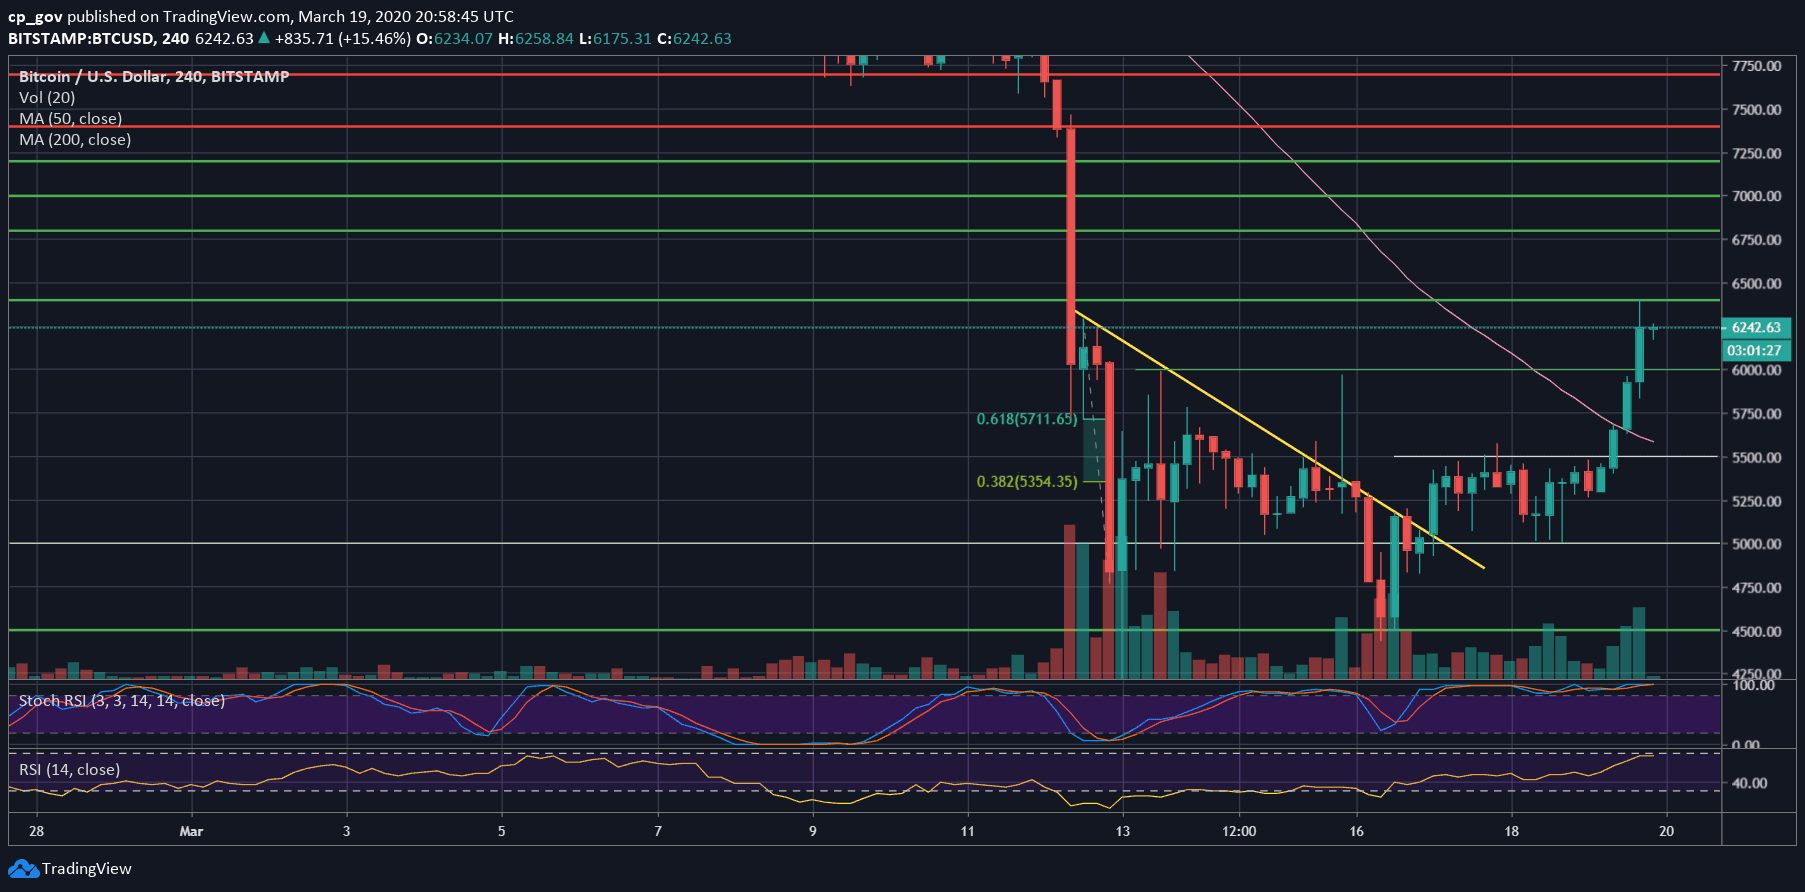
This is precisely what we saw today: Following the $5500 breakout, it took Bitcoin less than 4 hours to touch the daily high at $6400 (Bitstamp).
Altcoins Yet To Join
While Bitcoin surged, the Bitcoin Dominance index was rising. The altcoins are not yet inside the party. The next step for a crypto market recovery will be to see both Bitcoin and the altcoins increasing together.
Total Market Cap: $175 billion
Bitcoin Market Cap: $113 billion
BTC Dominance Index: 64.7%
*Data by CoinGecko
Key Levels To Watch & Next Possible Targets
– Support/Resistance levels: As of writing these lines, Bitcoin is trading above the $6K mark, which is now the first significant level of support. Down below lies $5700, followed by $5570 (the 4-hour MA-50 line marked with pink), and $5500 (the breakout from yesterday).
From above, the price zone of $6300 – $6400 is expected to be tough resistance for Bitcoin. However, the recent volatility had taught us that things happen a lot faster than on regular days.
In case of a breakout, then the next resistance level is likely to be the $6800, followed by the $7000 benchmark and $7200.
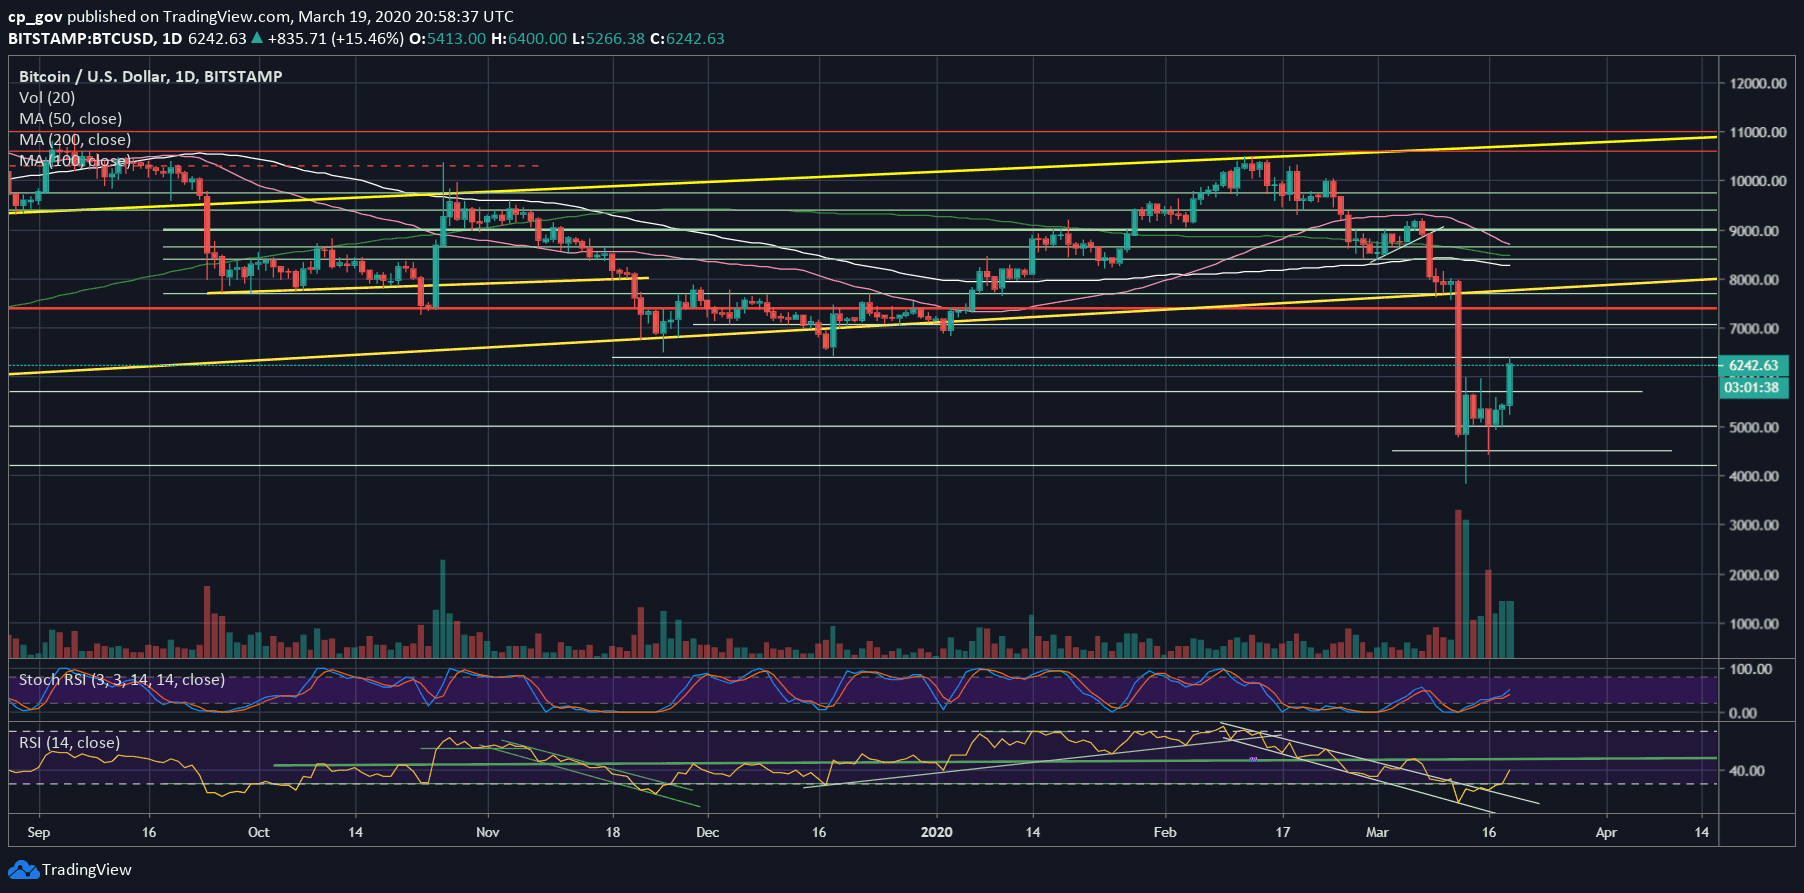
– The RSI Indicator: As we said yesterday, the RSI was at a decision point. As you might have guessed, the RSI chose the bullish side, and now facing resistance at 40. The real test of the RSI will be the 50 level, which designates bull markets.
– Trading volume: A decent amount of volume followed the recent surge, however the amount is still far from the peak levels of the night between last Thursday and Friday, the day when Bitcoin lost 50% of its value.
BTC/USD BitStamp 4-Hour Chart
BTC/USD BitStamp 1-Day Chart
The post Bitcoin Soars 18% and Breaks $6000: Is The 2020 Bottom Confirmed? BTC Price Analysis & Overview appeared first on CryptoPotato.
The post appeared first on CryptoPotato


