The crypto market as a whole displayed a sense of divergence in the charts at the time of writing, with Bitcoin SV witnessing appreciable gains on one hand, while on the other, alts such as IOTA and Dogecoin were trading below crucial pivot levels.
Bitcoin SV [BSV]
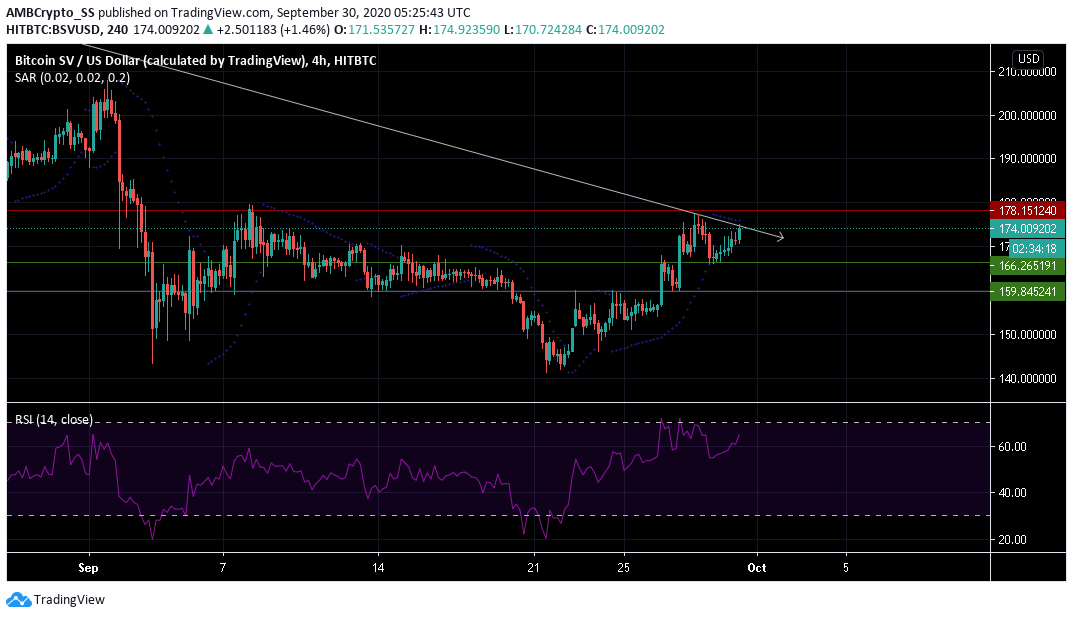
Over the last 24 hours, Bitcoin SV recorded the highest percentage gains among the top 10 cryptocurrencies. At press time, BSV recorded a price surge by 4.19% and traded at $174.
The contentious fork coin was seen hovering below its resistance level of $178.15. However, the crypto asset was also displaying a strong uptrend over the last few days, as the bulls were attempting to push the prices further up. The uptrend might see a minor reversal, as the dotted lines of the Parabolic SAR above the candles seemed to not support the crypto currency’s price from a further rise.
However, with the current level of bullish sentiment, any major immediate price correction is unlikely, and the price after a short reversal could be seen rising again towards the $178 level.
The Relative Strength Index (RSI) on the other hand rose above the 65-level depicting a strong sentiment of buying pressure among the traders in the BSV market.
IOTA
IOTA after displaying a consistent uptrend over the last few days, was down by 3% over the last 24-hours driving down the token’s price to $0.268, at press time.
The latest downturn pushed the coin to a level where it could slip below its current support level of $ 0.266. The Klinger Oscillator underwent a bearish crossover indicating IOTA could be headed for further losses in the next few days. The Klinger Oscillator displayed bearish signs as the signal line hovered over it.
The MACD indicator also appeared to undergo a bearish crossover in the near-term, this meant a bearish market momentum was starting to unfold, that could send the prices below the $ 0.266 level.
However, the price could rally upwards again continuing its uptrend as was seen over the last few days. Having claimed its current support level, a move towards the $ 0.285 level in the next few days remains another possibility.
DogeCoin [DOGE]
Dogecoin at the time of writing was trading close to its resistance level of $0.0027. It witnessed a price correction of almost 10.3% over the past 48-hours.
At press time, Dogecoin signaled a downtrend as it failed to gain control over its immediate resistance level. Average True Range, used to measure market volatility was in a downtrend, making lower lows and signaling a dip in Dogecoin’s volatility level.
Chaikin Money Flow was below the zero line, suggesting capital outflows were greater than capital inflows, and painted a bearish outlook for the price movement.
Much of this volatility can be potentially useful for the bears in generating a strong capital outflow and maintaining a downward selling pressure that would keep the price below its current resistance level of $0.0027 for the next few days.
Further, in the backdrop of a falling volatility level, the price may also not move much and might see a sideways consolidation along with the $0.00024 and $0.00026 levels.
The post appeared first on AMBCrypto


