Disclaimer: The findings of the following article attempts to analyze the emerging patterns in Bitcoin SV’s market and its impact on the price
Bitcoin SV’s price has been consistently noting bearish pressure, just like the rest of the market. The crypto-asset’s recent stint below $200 felt like the last straw had been drawn, with some suggesting that recovery above $200 was beyond BSV’s capacity. However, nothing in the market is confirmed until it is, and for Bitcoin SV, a second shot at the elusive range of $200 seemed to be back in play, at the time of writing.
Bitcoin SV 6-hour chart


Source: BSV/USD on TradingView
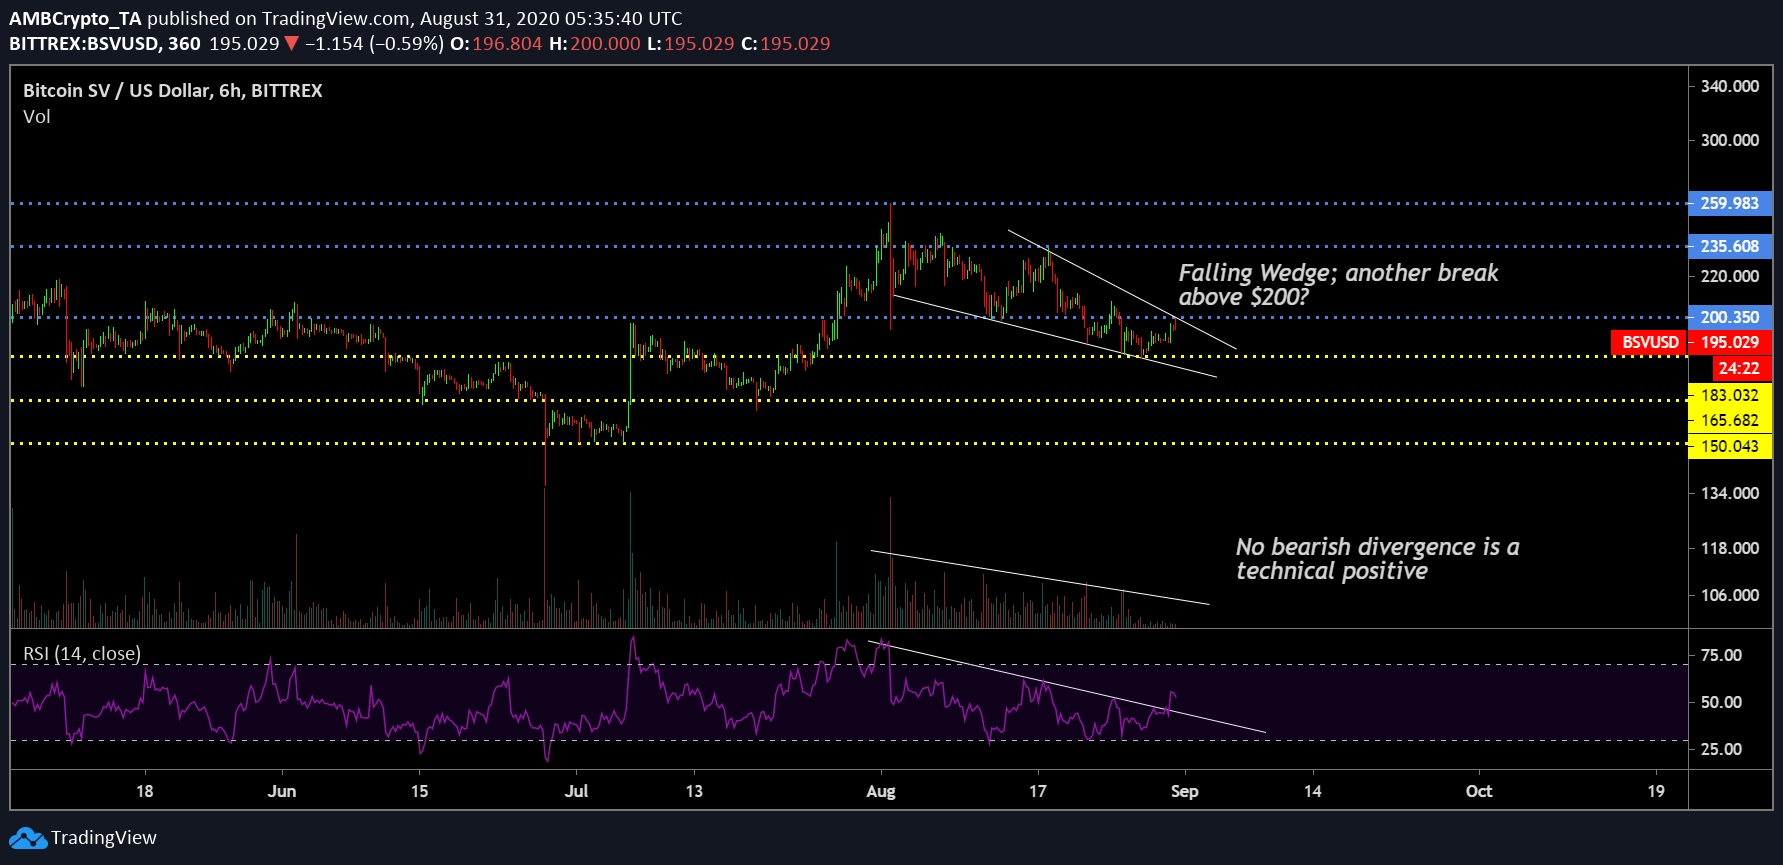
Bitcoin SV, after registering a high at $259, did not re-test the same level again over the month of August. While the likes of Bitcoin and Ethereum both registered new highs mid-month, BSV only registered a lower high at $235. Now, since 15 August, BSV’s price movement has conjured a falling wedge pattern, one that recently bounced back from $183. With some bullish factors coming into play, Bitcoin SV looked set to breach the $200-level. However, at press time, the resistance at $200 continued to remain strong, as it has for most of 2020.
However, it is still probable that Bitcoin SV’s market might soon breach the aforementioned resistance level. When observing its trading volume, it was found that it declined alongside the valuation during the month of August, implying that any trend reversal would possibly mirror its price movement as well.
Secondly, the Relative Strength Index or RSI presented a similar picture too. The absence of bearish divergence confirmed the fact that any improvement in buying pressure would directly register a price spike as well.
Bitcoin SV’s reversal range


Source: BSV/USD on TradingView
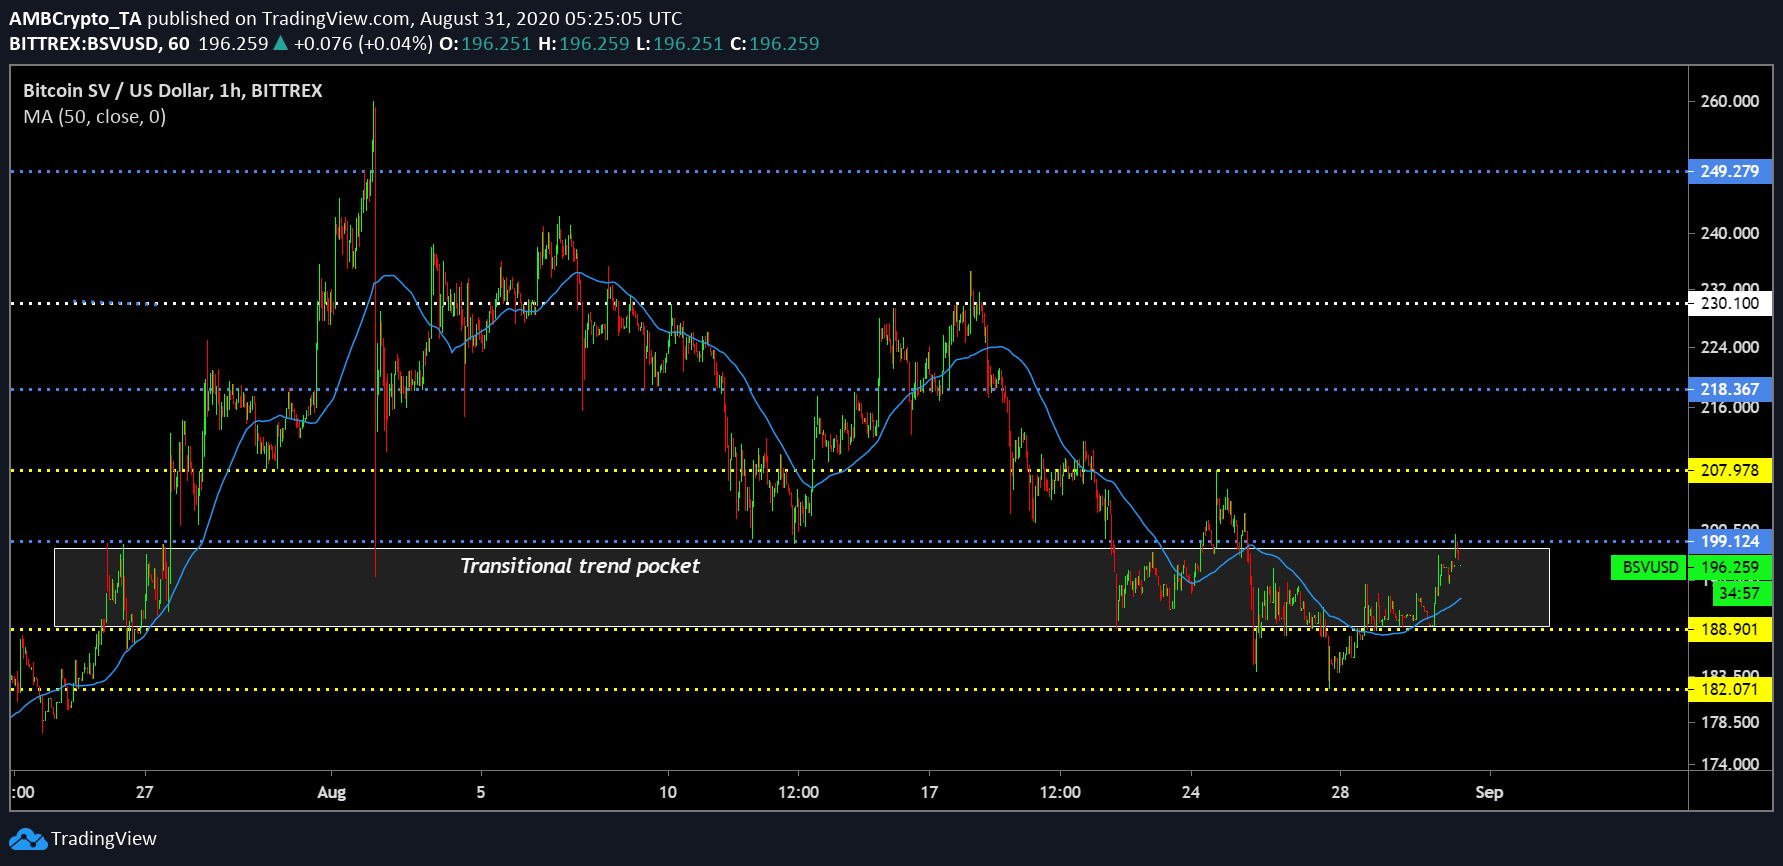
The most revealing observation that can be made from Bitcoin SV’s 1-hour chart is the continuous presence of BSV in the trend’s transitional pocket. The range has remained BSV’s ‘out-of-jail’ card for a while, with every major bullish and bearish mediation taking place from here. On 28 August, while the crypto-asset did drop below the pocket, its immediate correction above kept the crypto-asset in the game.
Now, efforts have been made to close a position above the pocket, one that may allow BSV to sustain another positive move on the charts. Hence, in spite of the strong resistance at $200, it is likely to be overtaken soon.
Verdict
An easy break above $200 in under a week may be expected for Bitcoin SV. However, any depreciation would pull the asset right back down.
The post appeared first on AMBCrypto


