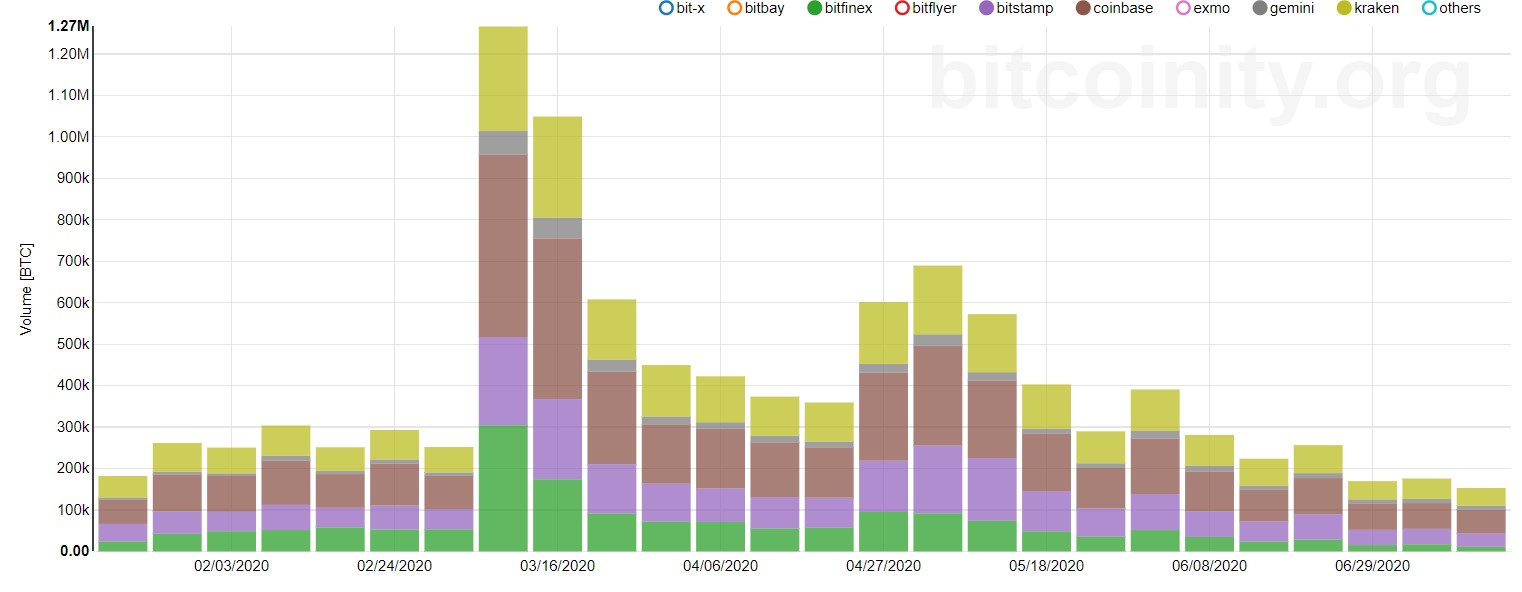
With Bitcoin’s volatility drying up, the other side of the grass does look greener; the other side being “DeFi.” With yield farming caching on, Bitcoin volumes are recording a stark decline on the charts. Between Bitfinex, Bitstamp, Gemini, and Kraken, the total average weekly volume has gone from being a little below 1.3 million BTC to under 300,000 BTC.


Source: data.Bitcoinity.org
This staggering fall in volume is mainly due to the volatility, a factor that has contributed to the price varying little, hence, making it less appealing to volatility-loving traders. To be precise, the 30-day volatility estimate is 1.14% and the last time this value was seen was way back in September 2016, just before the bull run began in earnest.
While Bitcoin has occupied the “boring territory,” DeFi has bloomed and the altcoin market has soared; all of which are viable options to accumulate more BTC. Apart from this, another drop in Bitcoin’s price will be the best opportunity to gather more BTC before the start of a new rally.
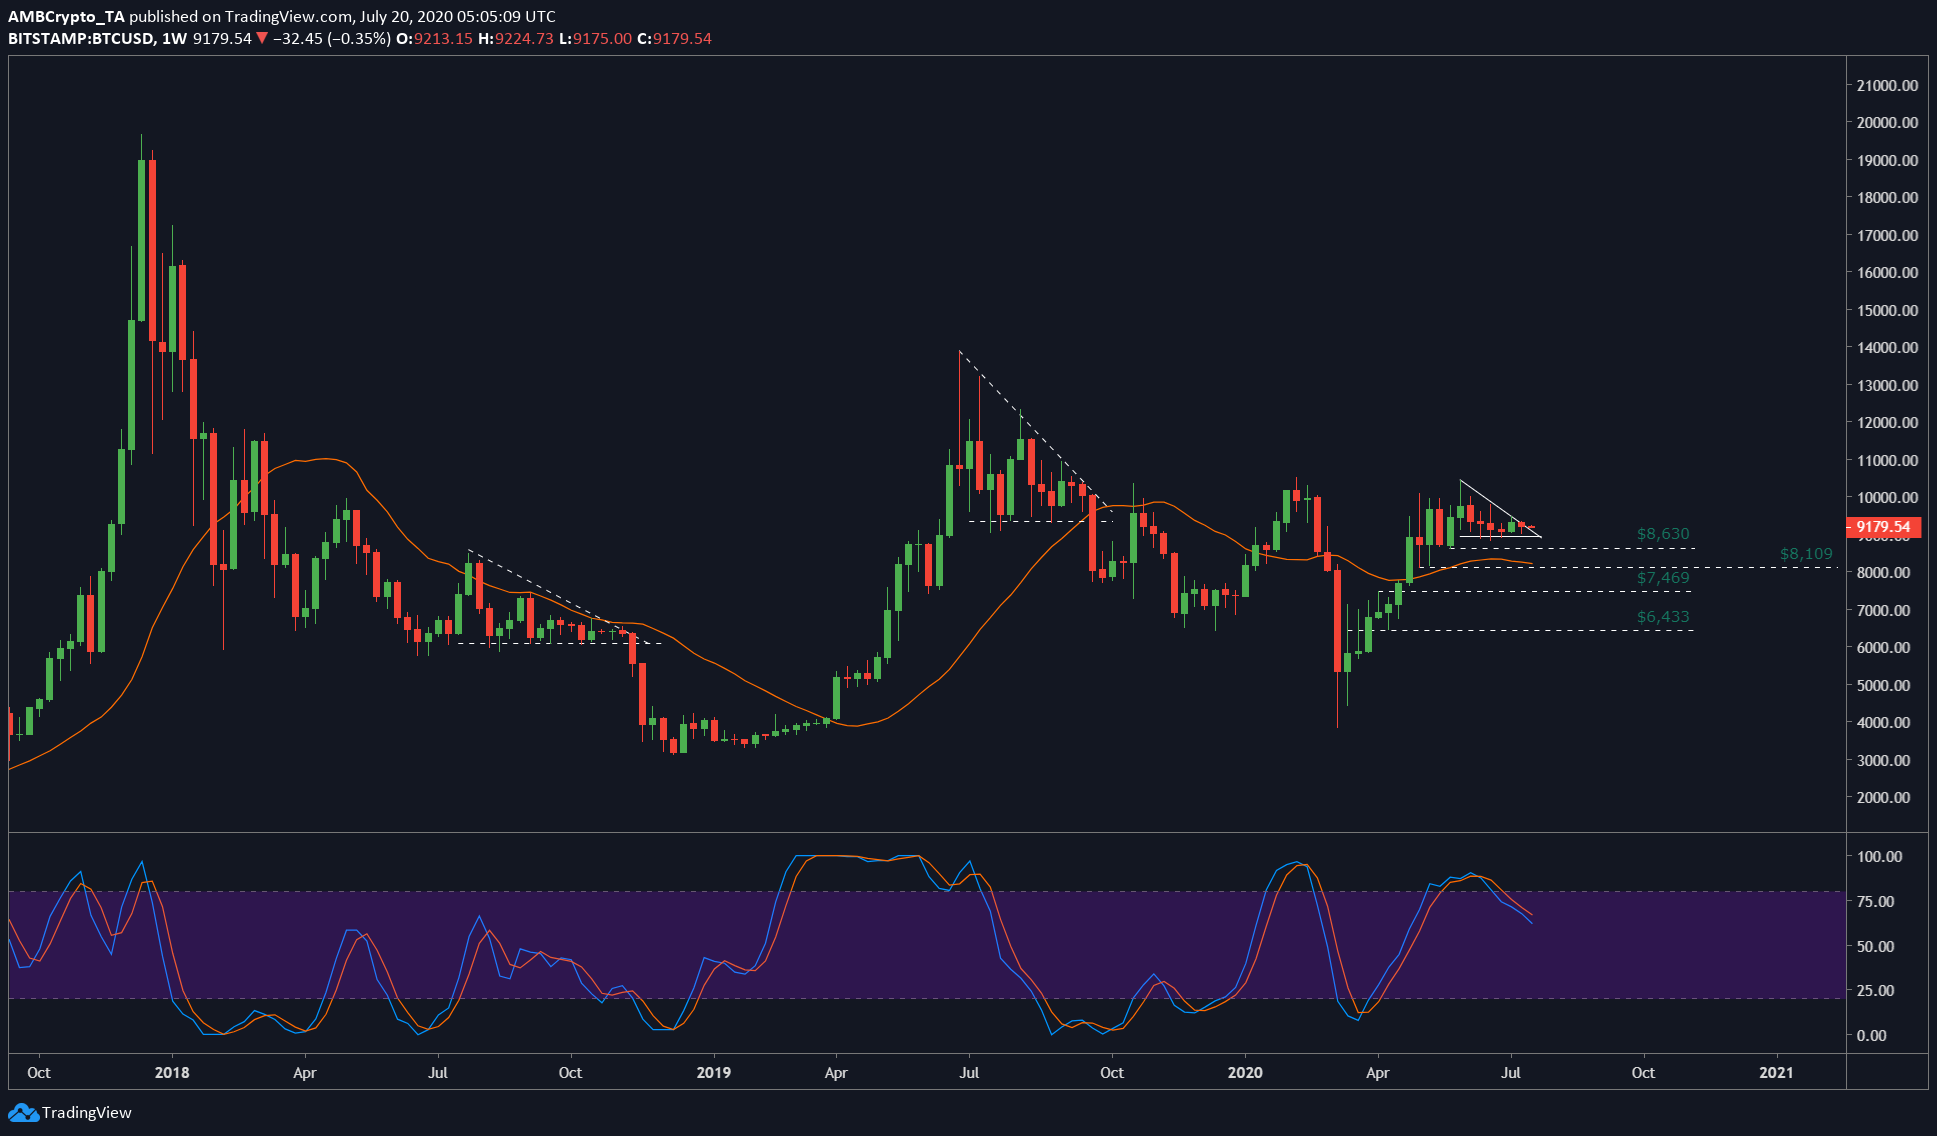
Bitcoin weekly chart


Source: BTCUSD on TradingView
As previously mentioned, Bitcoin has been coiling up for over a month now and this will result in a volatility-filled move as it breaks out of the pattern. What’s peculiar about this pattern is that it is at its end and this exact pattern has repeated itself twice in the past, both resulting in a violent breach to the downside.
The first breakout of the descending triangle pattern was in November 2018 during the hash wars and the second was on the day of Bakkt’s launch. While the first was bearish, the second one was an unexpected crash.
So, assuming the same will take place again, it is better to determine the levels to better prepare for the drop. The levels to keep an eye out for include – $8,630, $8,109. $7,469, and $6,433. Although the last two targets seem unlikely, it is better to have an open mind. The first target of $8,630 would mean that the price will drop 5.95% from its press time position, which seems almost nothing considering Bitcoin’s history. However, the second target [$8,109] would mean an 11.63% drop in BTC’s price.
Additionally, the Stochastic RSI also pictured a bearish crossover, one that is already in play, indicating the bearish nature of things to come, at least in the long-term.
The post appeared first on AMBCrypto


