After ascending all the way to $12,000 on 1 August, Bitcoin registered its most significant daily pullback since the 8.24 percent drop on 10 June, with BTC depreciating by 10.57 percent yesterday.
While such movement did see Bitcoin’s rally stop in its tracks, over the past few hours, the crypto-asset seemed to hold on to a price position between $11,000-$11,200. At the time of writing, the crypto-community was fairly split on what this meant.
While a majority of the space is boasting a fairly optimistic market sentiment, an argument can still be made for a prolonged bearish setback on the charts.
According to data provided by Santiment, when Bitcoin was on its way to $12,000, the daily active addresses didn’t correspond with the same with an increase of its own. As observed in the attached chart, the daily active addresses had peaked right before Bitcoin surged towards its $12,000 price point. In fact, in retrospect, the signs pointing to a correction were evident since the daily addresses were falling in the market, right before BTC plunged on the charts. Santiment added,
“Yesterday, as the price continued to climb toward $12k in spite of DAA dropping from 1.06m on Friday, to 959k on Saturday (a ~-9.5% drop). As a result of this bearish divergence, #Bitcoin fell back to ~$11k in a hurry (a ~-8.3% price drop).”
Bitcoin has been 98.54% profitable since inception; what is the alternate view?
Danny Scott, CEO of UK Exchange Coin Corner, recently tweeted that Bitcoin has been profitable for over 98% of its total days in existence. Now, for an investor who is one of the market’s early-entrants, the sentiment is all positive.
However, he was also quick to add that Bitcoin has been above $11,700 for only 62 days.
The above scenario can be looked upon in two ways. For starters, the rally from hereon will somewhat depend on new buyers. Alas, historically, Bitcoin hasn’t had too many buyers above the press time price point of $11,179.
So, if we were to take Danny Scott’s word and accept that the bull run isn’t here yet, the main question to ask is whether new buyers would be bullish enough to enter the space at such a high price, rather than waiting it out for another low?
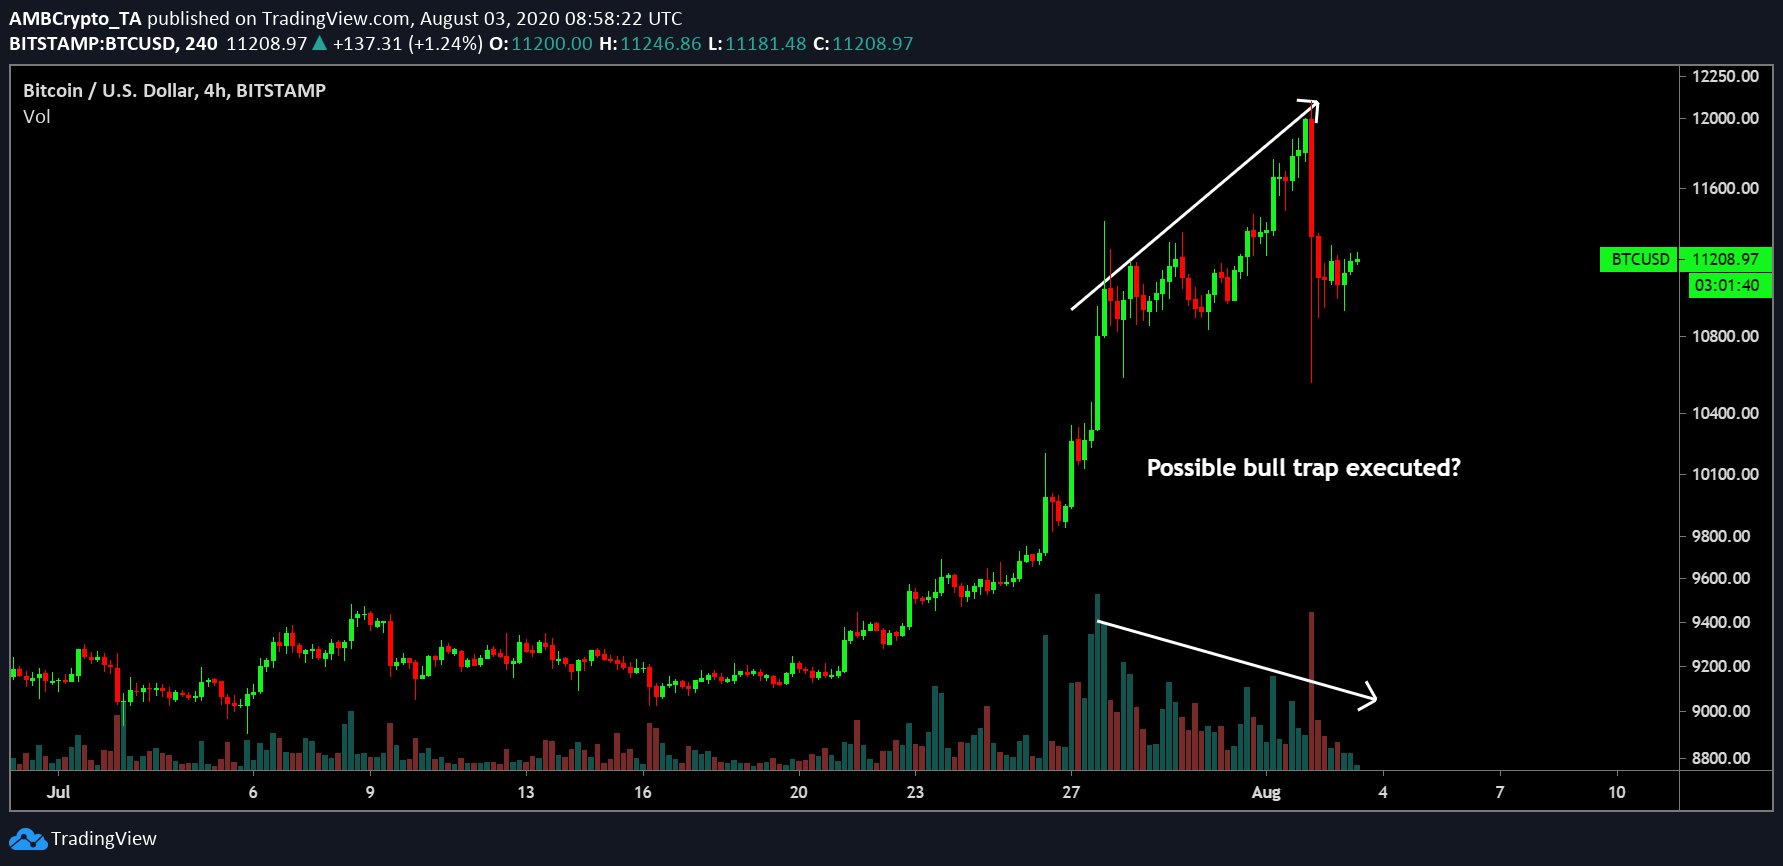
Bitcoin Bull-Trap – Was it executed on 2 August?


Source: BTC/USD on TradingView
In similar fashion to the daily active addresses, another major on-chain metric that fell right before the rally was Bitcoin’s trading volume. As observed from the chart, between 27 July and 1 August, Bitcoin’s price and trading volume followed a bearish divergence which may have led to a bullish trap at the top. Therefore, it is highly possible that the sell-off at $12,000 was due to this bull-trap.
With the price consolidating at the moment, the market is still fairly bullish. However, considering the fact that the market yearns for the zones above $12,000 again, it is important to note that BTC is heading into unchartered trading territory once again.
The post appeared first on AMBCrypto


