There’s no doubt that bullish ETF news was the reason behind Bitcoin’s recent surge, sending its price above $35K. However, BTC price now faces a slight setback in maintaining its momentum following profit-taking sentiment among traders. According to on-chain data, Bitcoin shows robust health in key on-chain metrics, even as traders exhibit anxiety over the potential decline in ETF pump.
Buyers Remain Bullish Despite ETF Pump Slowdown
Even as the SEC’s official nod for a spot Bitcoin ETF hangs in the balance, investor interest hasn’t faded, with continued Bitcoin purchases in anticipation of a substantial market rally post-approval. If an ETF is approved, experts are forecasting a jump in BTC prices beyond the $40K threshold, potentially setting a new high for 2023.
Presently, the BTC market is experiencing a slowdown, triggered by whales offloading Bitcoin assets worth over $20 million, a move that followed a dip in Bitcoin’s value from $34K.
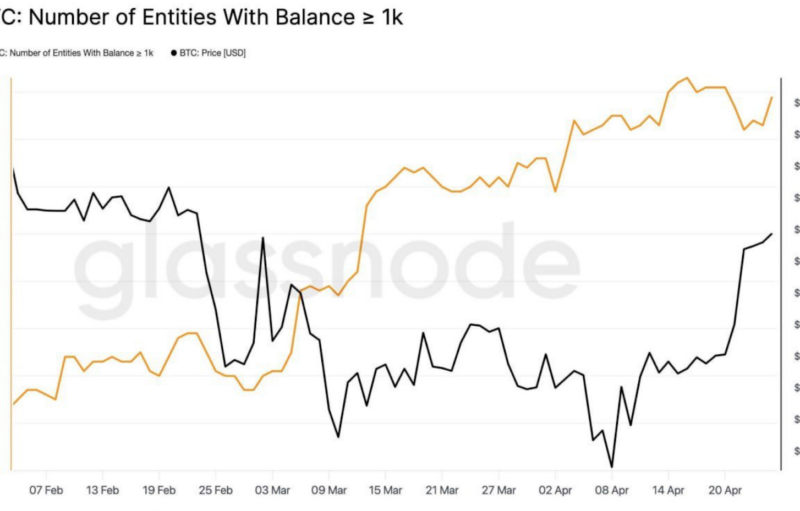
Despite this sell-off, the market didn’t experience a further downturn, due to a robust defense initiated by buyers at the crucial support levels. While it might appear that the hype surrounding the ETF-driven surge is declining, on-chain indicators tell a different story. According to data analytics firm Santiment, key on-chain metrics remain strong, suggesting that the current situation is more of a temporary market reaction than a long-term shift.
Bitcoin is witnessing its 3rd straight day in 1 million unique addresses transacting despite the recent drop, suggesting increased network usage. Bitcoin is also experiencing a significant movement of previously inactive tokens, a scenario often associated with bullish market conditions.
A decrease in the age of BTC investments indicates reduced coin dormancy, potentially increasing utility and market activity. As the SEC is set for an imminent ETF approval, holders are showing less interest in offloading their coins for further market potential.
What’s Next For BTC Price?
After Bitcoin price faced a rejection above $35K, it initiated a downward correction and is currently aiming to meet sellers’ demand below 20-day EMA. Bears are dominating the price chart over the last few hours; however, bulls might soon defend the EMA line.
The RSI trend line has dropped from its overbought region following the correction, holding a balanced battle between the bulls and bears. Currently, the crucial support levels to observe are at $31,900 and subsequently at $31,000.
These levels are expected to be protected by buyers. Should the support of $31.9K hold strong, and the price rebounds, there’s a possibility that bulls will once again attempt to send the price above $35K.
On the flip side, a decline below the $31,000 mark could suggest that the recent surge was for short-term, potentially luring investors into a bull trap. In this case, bears might gain control and consolidate the BTC price around $28K-$30K.
The post appeared first on Coinpedia


