When we talk about an open playing field in the Bitcoin ecosystem, price predictions on the asset’s future generate the most attention. Bitcoin has been around for little under a decade, and the limited time-period often leads to contrasting predictions. Personalities in the space are often predicting the price based on different factors, as the projections vary from being optimistic to the complete opposite.
A recent article on Medium released by Harold Christopher Burger explained the long-term growth of Bitcoin, written based on the idea of modeling Bitcoin’s price with the use of a power-law.
Price Model Derivation for Bitcoin
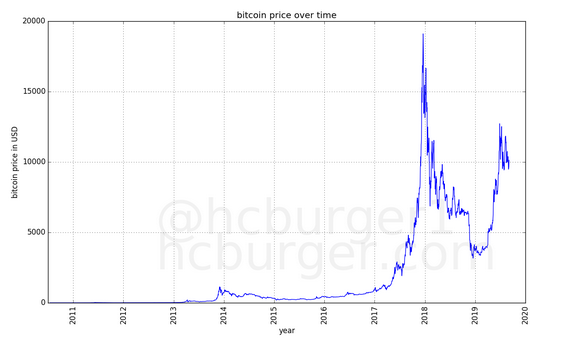
Source: Medium
The article stated that Bitcoin recorded a huge magnitude of orders within its first few years and it was considered ‘unusual’ for a financial asset. When the past prices are listed out in a linear scale, it failed to make productive sense as a linear scale was inefficient for an asset witnessing high magnitude of orders.
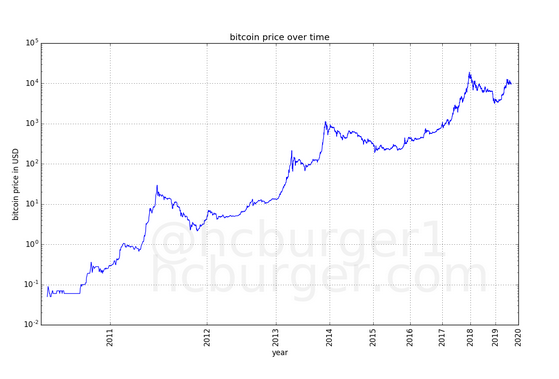
Source: Medium
Hence, it was stated that the use of a logarithmic scale was more beneficial. When Bitcoin’s price and the time period from 2009 was scaled logarithmically, the graph was drastically linear over time.
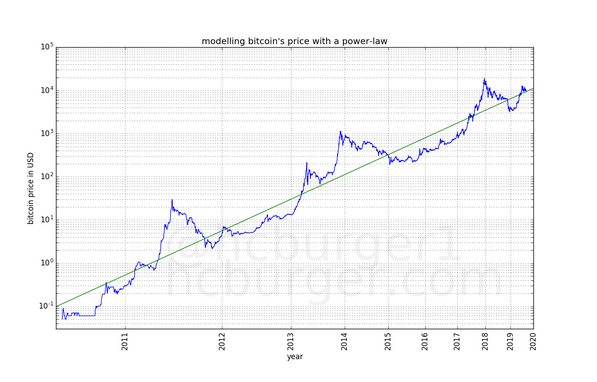
Following the data, the article stated that linear regression was implemented in the above chart.
Source: Medium
The green line obtained after linear regression was used and it resulted in the power-law which predicted the price of Bitcoin on a particular day. The power-law was,

Source: Medium
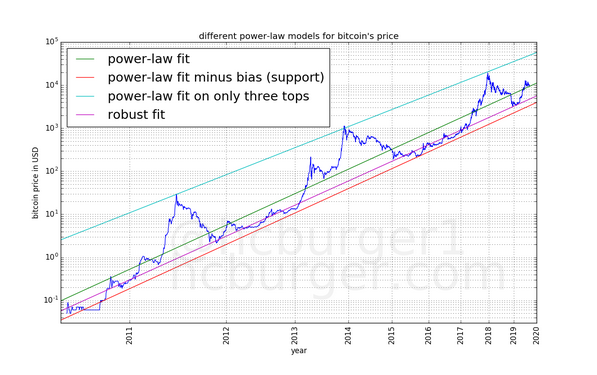
After the power-law was determined, a support line and a Bitcoin-market top line for the graph was derived which used the linear regression model on both, the number of days and the measure of fit attained by BTC’s price. The two lines outlined the range where Bitcoin’s price had propagated since 2009 and exhibited a corridor of growth. Both the market-top line and support line followed the power law.
After establishing the aforementioned lines, the use of random sample consensus or RANSAC was facilitated to find the data points which fitted closely to the model.
The article stated,
“First, linear regression is performed on all data points. Then, the data point which fits the data least well is removed, and linear regression is performed again. We’re going to stop when 50% of the data points have been removed.”
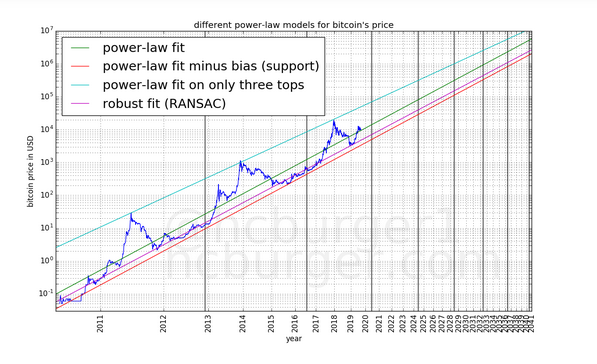
The data released after the implementation of RANSAC indicated the best-fitted data points for the model. After RANSAC, all the previous derivations were combined and were listed out the following graph.
Source: Medium
Price Model Predictions
Source: Medium
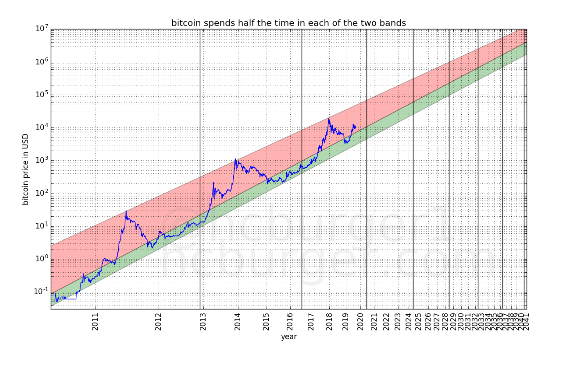
Based on the above-derived graph, it was indicated that Bitcoin’s price navigated closely between the red support line and the blue top line. The graph was divided further between two bands termed as “normal mode” [green segment] and “bull mode” [red segment] and the price has spent a relatively equal amount of time on both sides of the spectrum.
Source: Medium
The predictions that were based out of this model were still not specific, but it indicated that the valuation of Bitcoin would not cross $100,000 until 2021, and that it will not go lower than $100,000 by the year 2028.
Other important facts that were outlined in the article included price volatility. The volatility of Bitcoin was huge in its initial years, but with time it has reduced and the price has progressively hiked on the charts. The model highlighted a consistent increasing valuation for Bitcoin, but the rate would be getting slower and slower in the next few years.
The post appeared first on AMBCrypto


