It’s safe to say that yesterday’s wick down to $0.1277 will be the last one in a while for Cardano. Both on the higher time frame, as mentioned earlier, and the lower time frame, Cardano is bullish.
Still, in the 8th rank, ADA is currently trading at $0.1328 with the 24-hour price change showing a 5.50% decline. There is a potential for a good long position with a minimum surge of 20%.
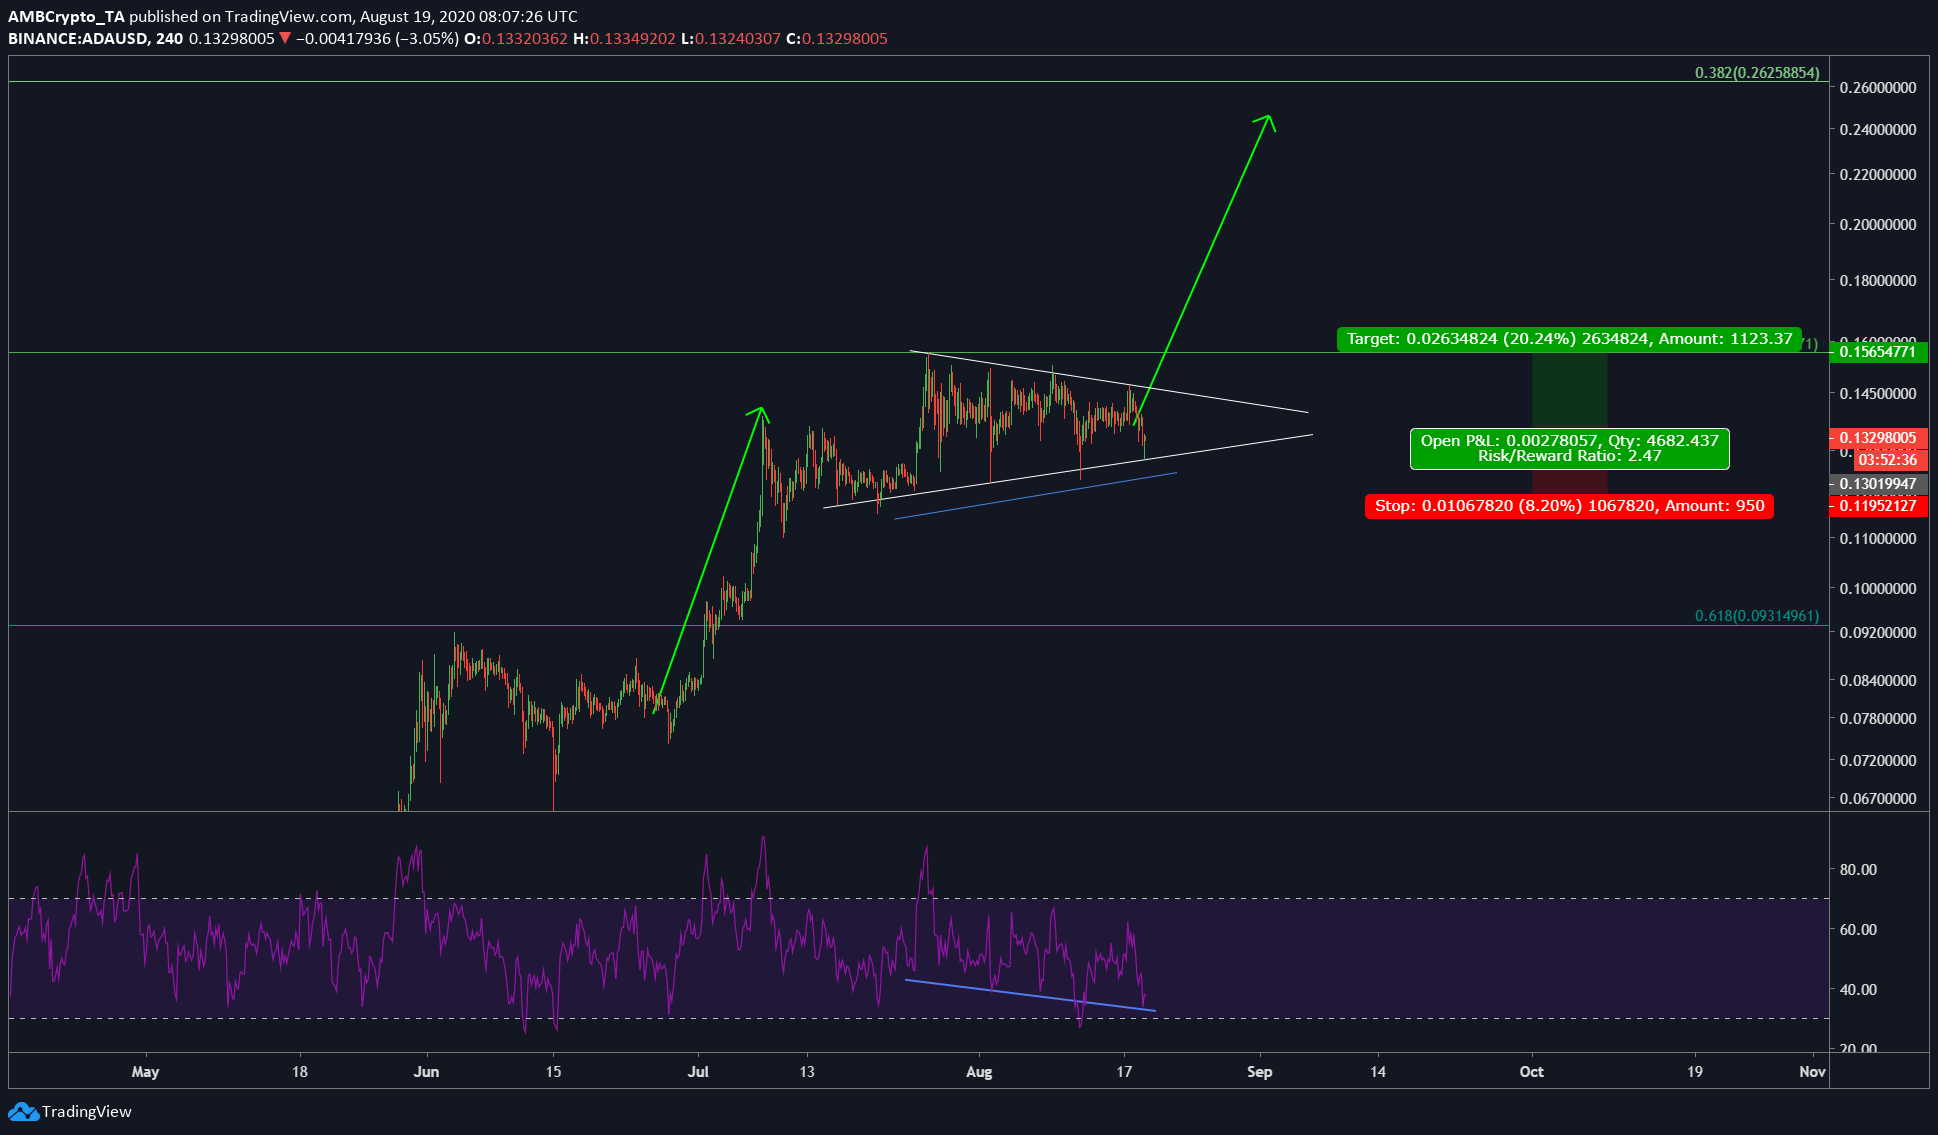
Cardano 4-hour chart


Source: ADAUSD TradingView
Cardano has formed a continuation pattern which is a bullish pennant pattern with upsides ranging from 20% to 100%. The symmetrical triangle is the consolidation pattern that will provide momentum for buyers to push through. This can be thought of as an accumulation zone for further upside.
Hence, a long position with a 2.47 risk-to-reward ratio with entry at $0.1301 and stop-loss at $0.1195 [aka 8.20% of the capital]. The target can vary, the position can be closed at 0.1564 which also happens to be the 0.5-Fibonacci level; this will give a 20% upside. However, another target is 0.382-Fibonacci level, which is at $0.2625 or a 100% surge from the current price.
With proper leverage and risk understanding, this seems like the best trade for ADA in a while. Supporting this long position is the RSI indicator, which shows a clear bullish divergence between the price and the momentum indicator.
Cardano 1-day chart
The one-day chart also shows a similar bullish bias for Cardano, which has been trending higher with higher lows and lower highs forming a proper consolidation pattern.
Even on the higher time frame, the RSI indicator showed a clear bullish divergence, in addition to the bullish pennant pattern. Hence, this long position seems like a no-brainer.
Additionally, the 50-DMA [yellow] has supported the last two dips, hence, the bounce from the daily moving average will be a strong one.
The post appeared first on AMBCrypto


