Cardano appeared to be forming a bullish reversal pattern, although it could take several more days to give concrete confirmation signals. Tezos formed a continuation pattern and was likely to register more losses. Dogecoin exhibited a hidden bearish divergence and could be forced to test support once more, and perhaps break beneath as well.
Cardano [ADA]


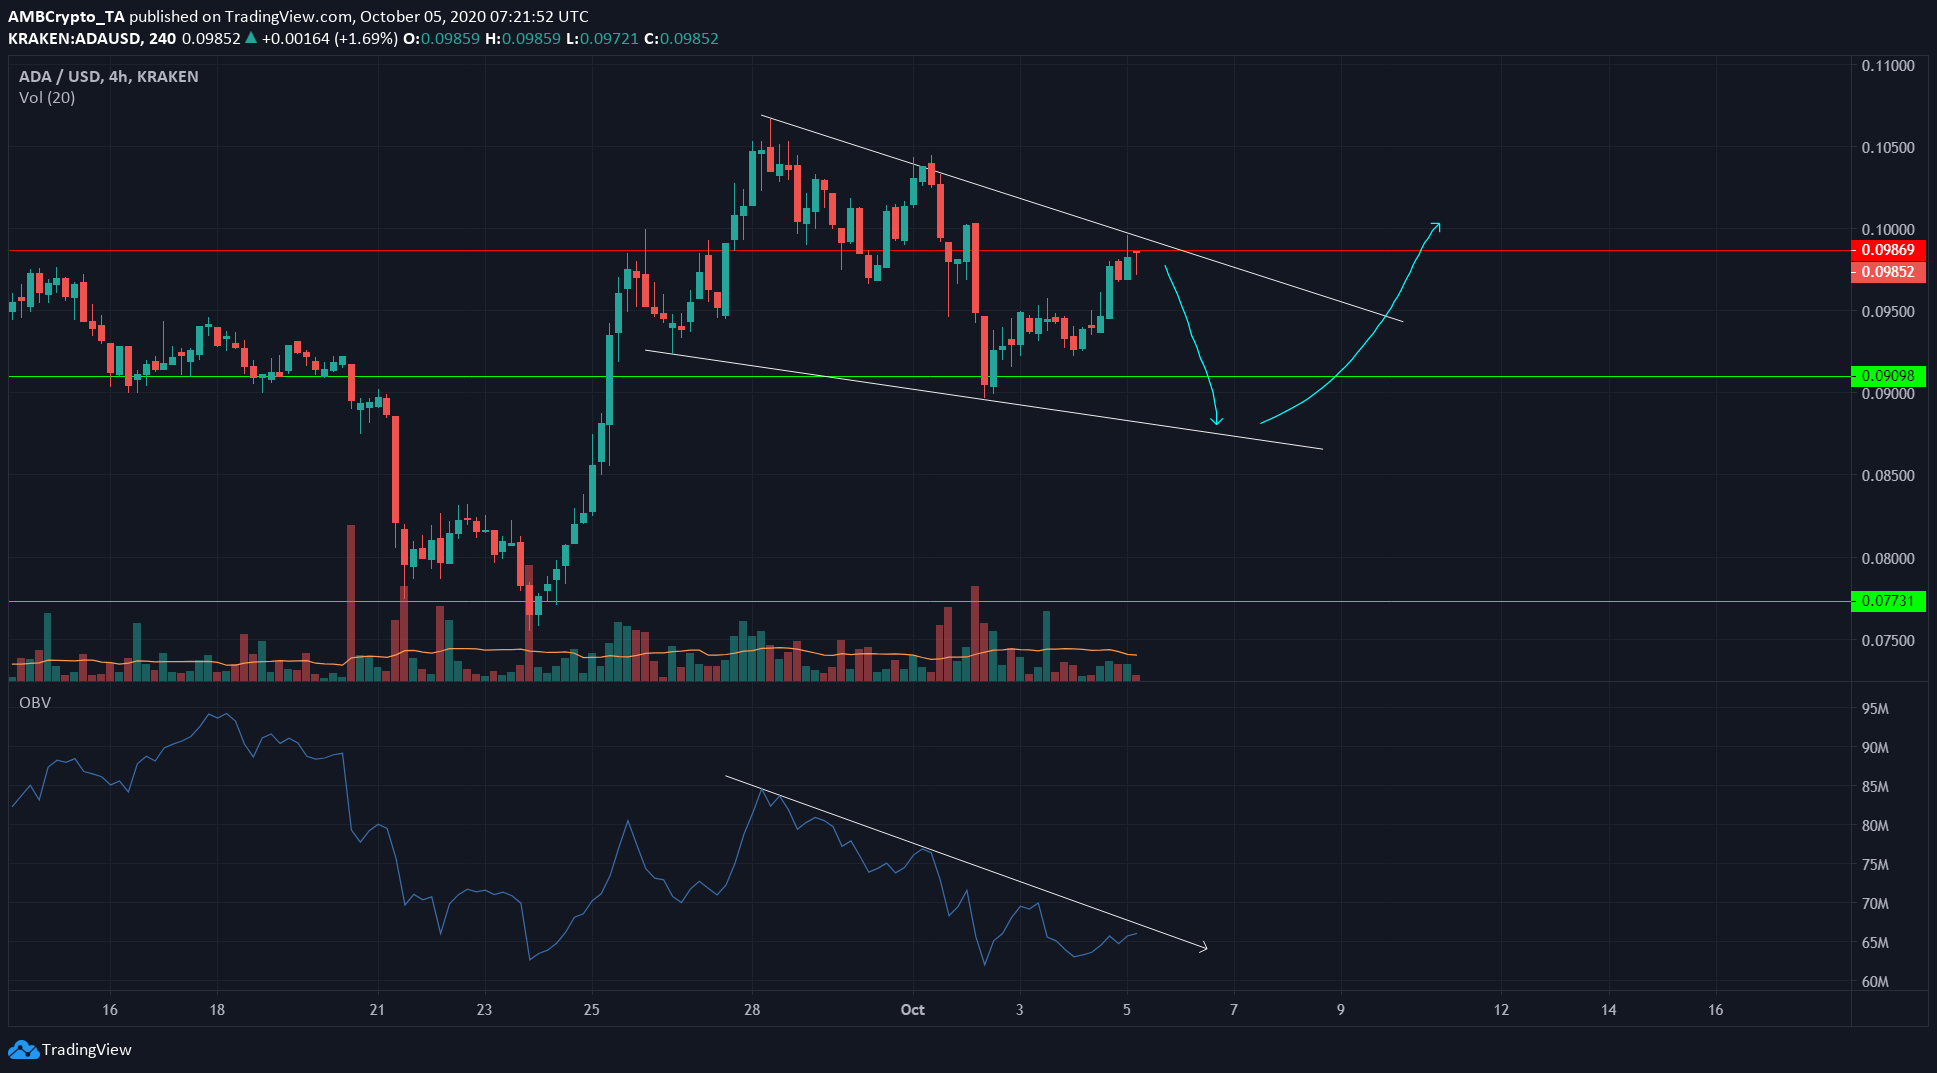
source: ADA/USD on TradingView
Cardano was forming a possible descending wedge, a bullish reversal pattern. This pattern could take several days to play out. With the evidence at heart, the likely route for the price was highlighted in cyan.
The OBV showed a trend of selling volume dominating (or, decreasing buying volume) and this supported the idea of another drop in the near-term.
However, if ADA moved a notable distance outside the wedge, the pattern can be considered to be invalidated.
Tezos [XTZ]


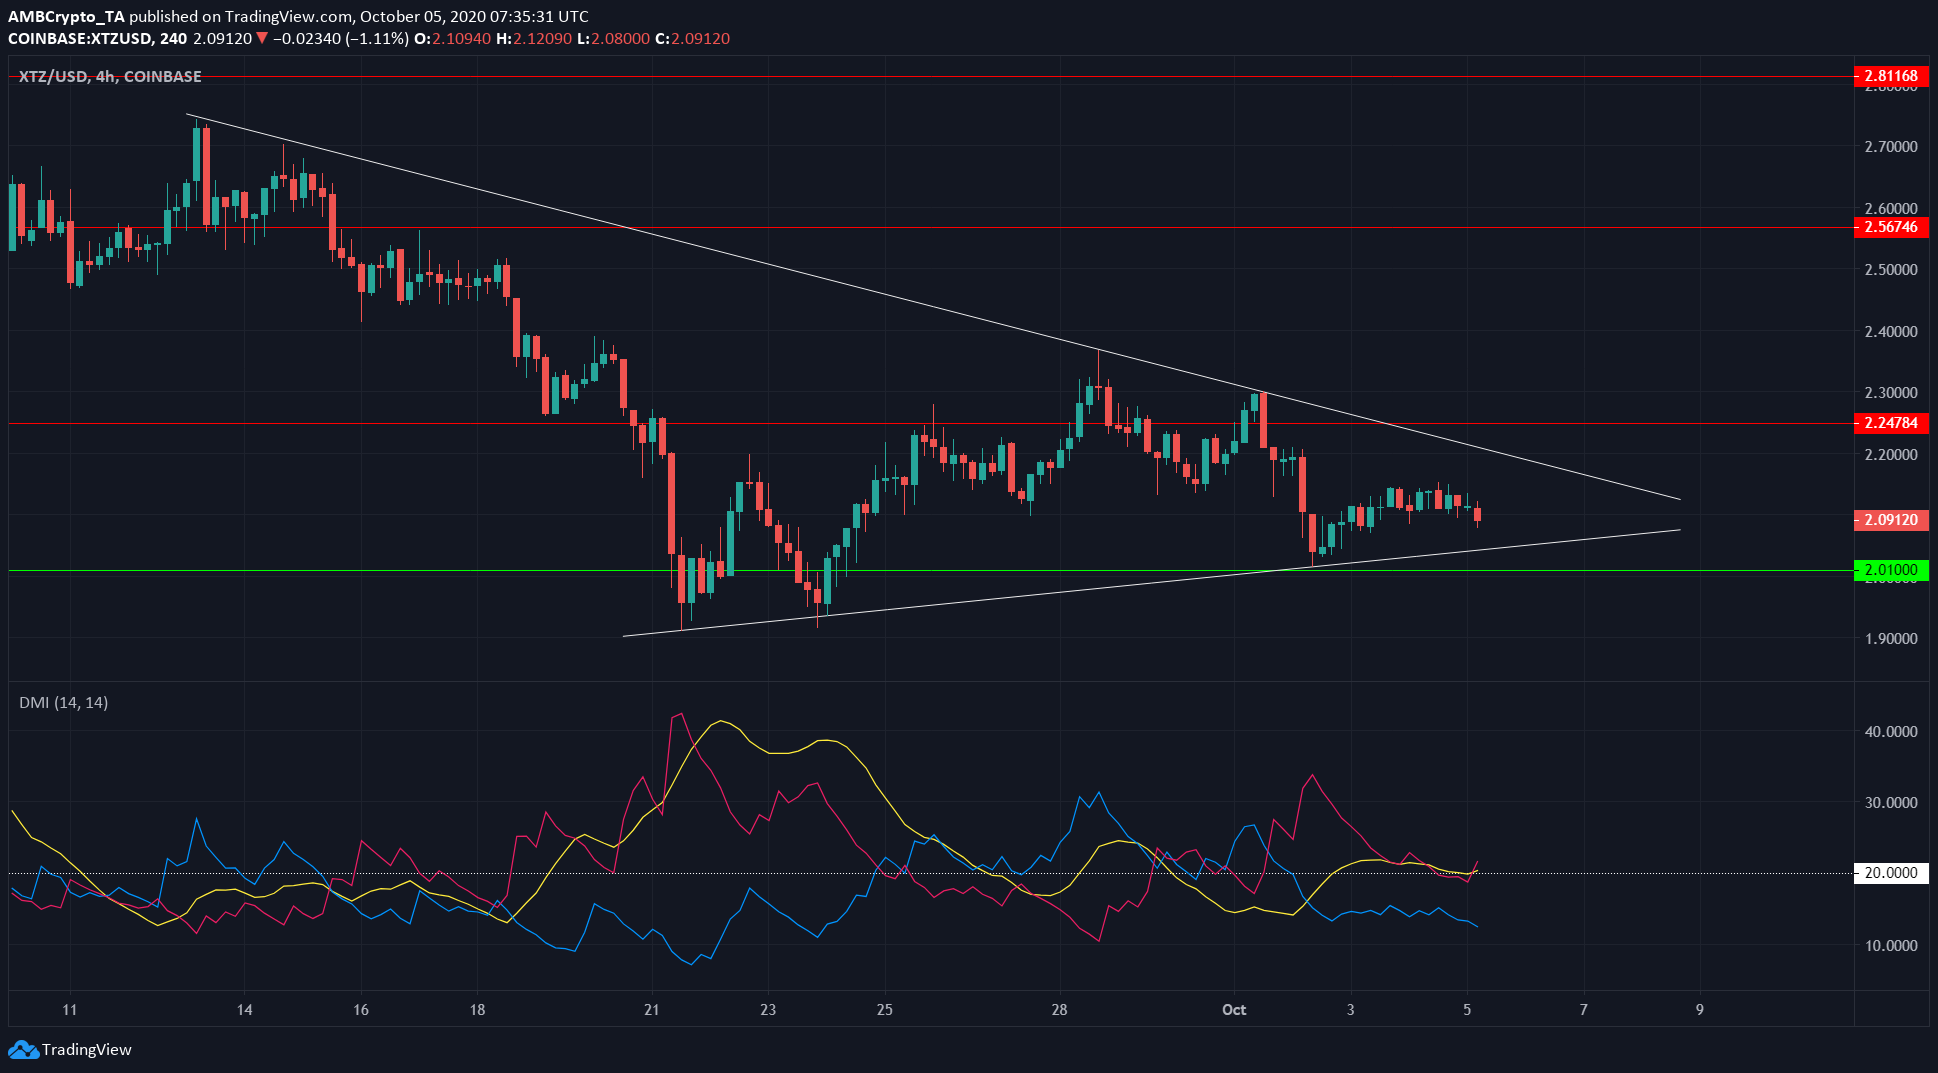
Source: XTZ/USD on TradingView
Tezos has been in a strong downtrend, with brief rallies in between. In the past couple of weeks, XTZ formed a symmetrical triangle pattern (white). This is a continuation pattern, with the price likely to follow the trend prior to entering the pattern.
In this case, the prior trend was downward. Upon a close beneath $2 support, XTZ would be poised to drop lower to find support at $1.8.
Directional Movement Index was on the verge of showing a strong trend. ADX (yellow) was at 20.5 while -DMI (pink) was above the +DMI (blue). This indicated that, at press time, the trend was just about to become a significant downtrend.
Dogecoin [DOGE]


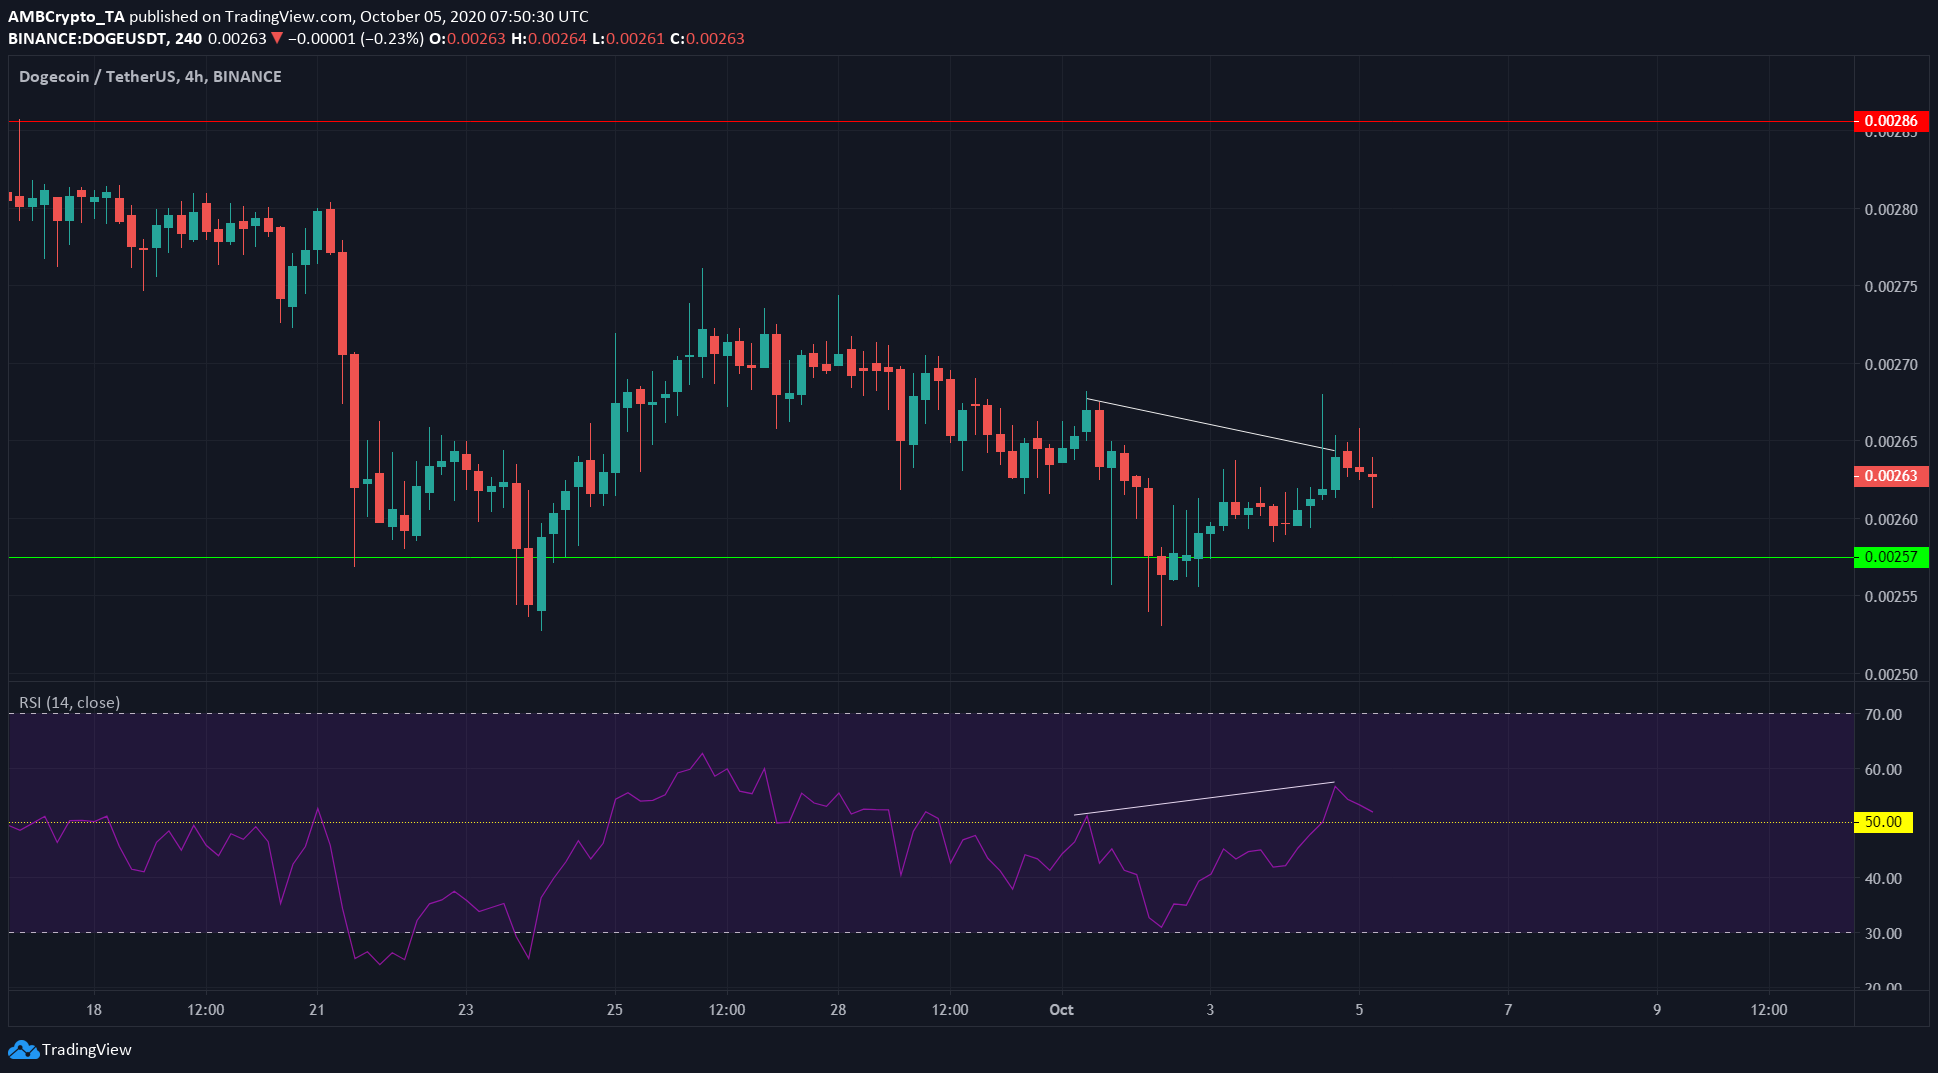
Source: DOGE/USDT on TradingView
Dogecoin showed a hidden bearish divergence in the recent trading sessions. This was when the price made lower highs while the momentum oscillator (RSI) made higher highs.
The next levels of support for the asset lie at $0.0025 and $0.00227. On a longer timeframe, DOGE has been slipping downward, with phases of consolidation in between. This could be set to continue.
The post appeared first on AMBCrypto


