While the altcoin Enjin continued to record losses as it fell below crucial support levels, Waves remained bullish after it recorded heavy buying pressure on its trading charts. Cardano, on the contrary, could repeat its bullish trend from a few days ago.
In fact, Enjin was seen forming a bearish rectangle pattern, one that might encounter a further downtrend on the charts.
Cardano [ADA]


Source: ADA/USD on TradingView
At the time of writing, Cardano registered a market capitalization of $3.38 billion and was ranked 9th on Messari’s charts.
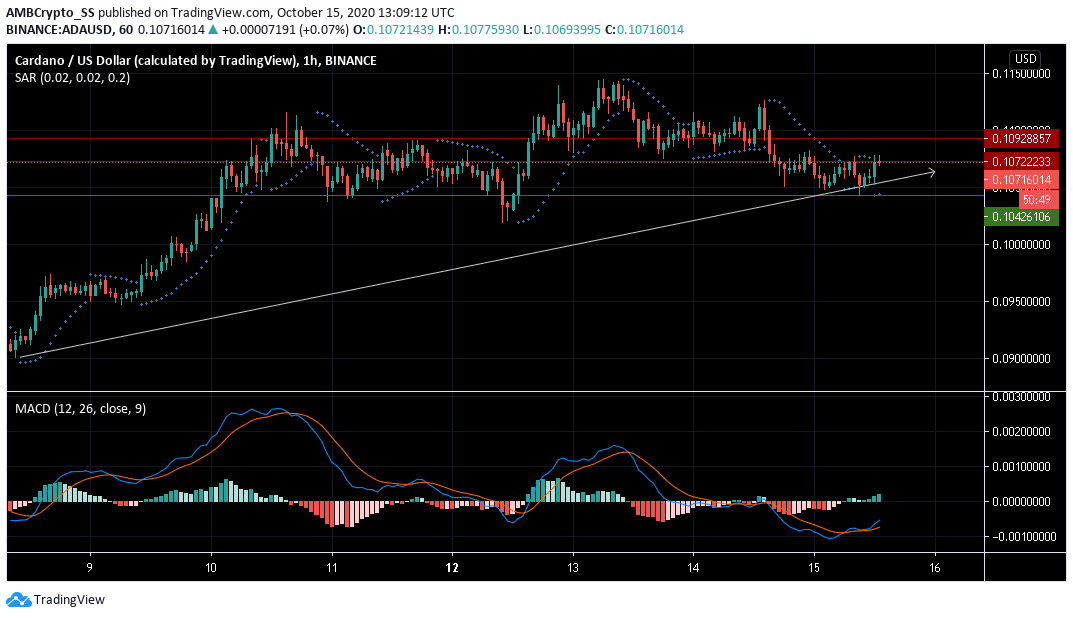
The MACD on Cardano’s charts was presenting a bullish signal as the MACD line crossed above the Signal line. Further, the placement of the Parabolic SAR’s dotted markers below the price candles also pointed to an uptrend on the charts.
If this latest uptick gathers more momentum, Cardano will be expected to breach its overhead resistance at $ 0.107, repeating the 11 October trend.
WAVES


Source: WAVES/USD on TradingView
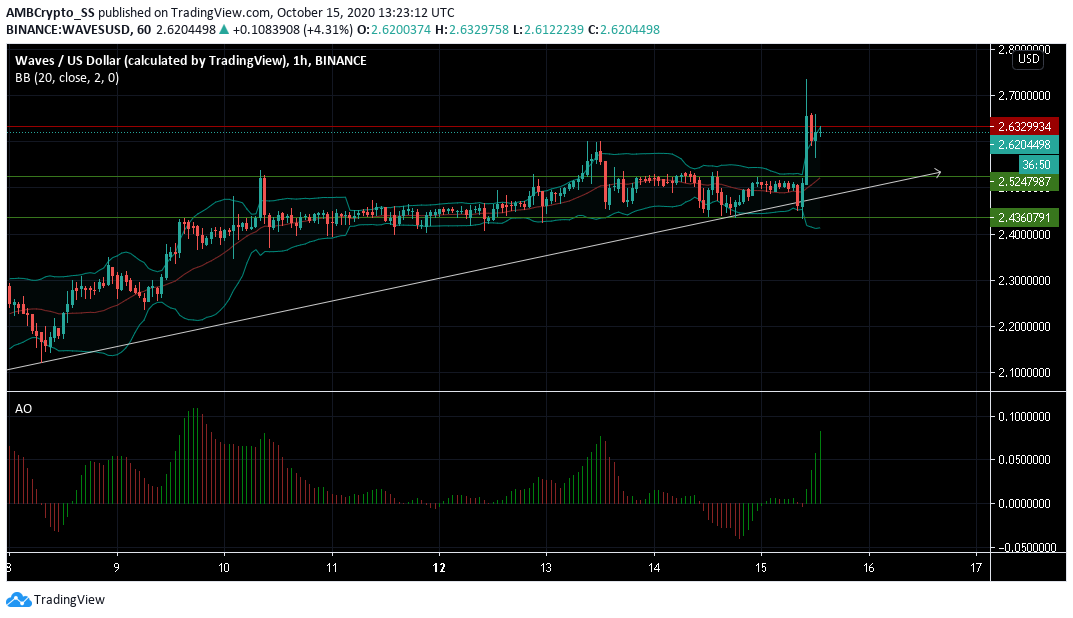
At press time, Waves was trading at a price of $2.62, with the cryptocurrency registering bullish momentum on the charts.
In fact, the cryptocurrency’s price moved above the two support levels of $2.43 and $2.52 during its previous trading session, giving a return of almost 4% to its investors.
The divergence noted by the Bollinger bands pointed to high volatility on the charts. The larger price trend also continued to be bullish, with price levels seen treading the BB’s upper bands.
The Awesome Oscillator also clearly sided with the bulls, with green closing bars above zero signaling a continuation of the uptrend for a few more trading sessions.
Enjin [ENJ]


Source: ENJ/USD on TradingView
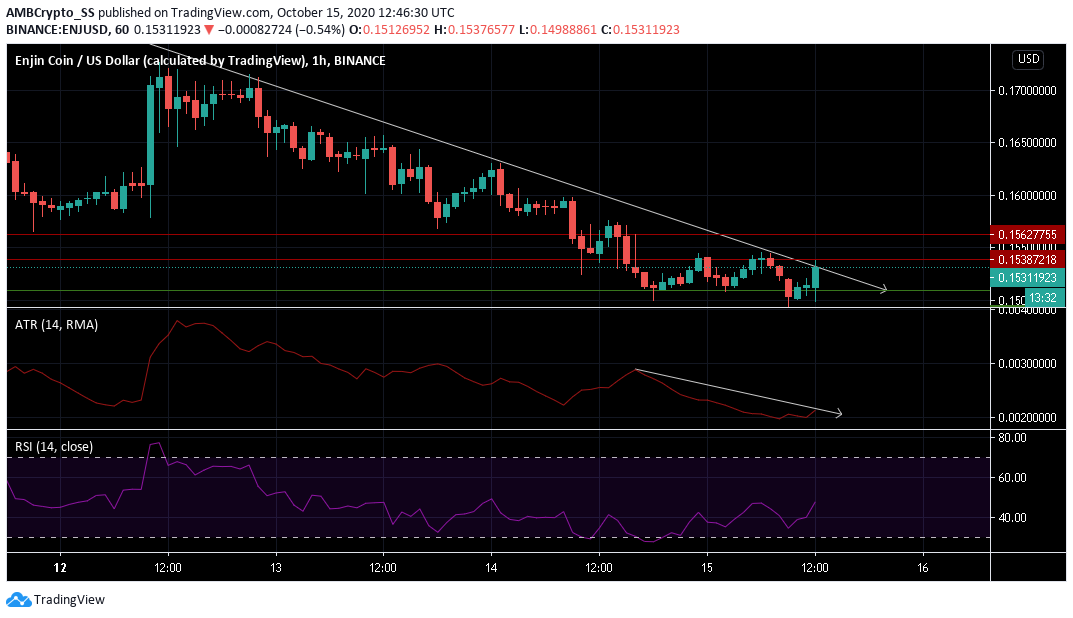
Over the previous week, Enjin was trading above the $0.156-mark. However, bearish market momentum soon pushed the price towards its immediate support at $0.150
The Average True Range (ATR), a technical indicator measuring market volatility, also pointed to a considerable dip, with continuously falling levels of volatility seen over the last three days.
Further, the Relative Strength Index (RSI) was marked by a rise in buying pressure. At the time of writing, the RSI was rising towards the neutral 50-mark. In fact, this coincided with a price rise towards the $0.153-resistance level.
Furthermore, a pattern also emerged from the persistent downtrend and the latest price oscillation between the immediate support and resistance levels. The trading charts for Enjin hinted at the formation of a bearish rectangle pattern, one that could push down the prices further.
The post appeared first on AMBCrypto


