Disclaimer: The following article attempts to analyze the evolving pattern in Chainlink’s long-term market and its impact on LINK’s price
Unlike most cryptocurrencies in the market, Chainlink has been climbing the price ladder for a long time now. Despite the larger market noting staggering periods of depreciation recently, its growing market capitalization has pushed LINK up to the ninth position on CoinMarketCap’s list. In fact, LINK has raked in nearly 379% in gains for investors in YTD, despite it now being part of a bearish pattern.


Source: LINK/USD on TradingView
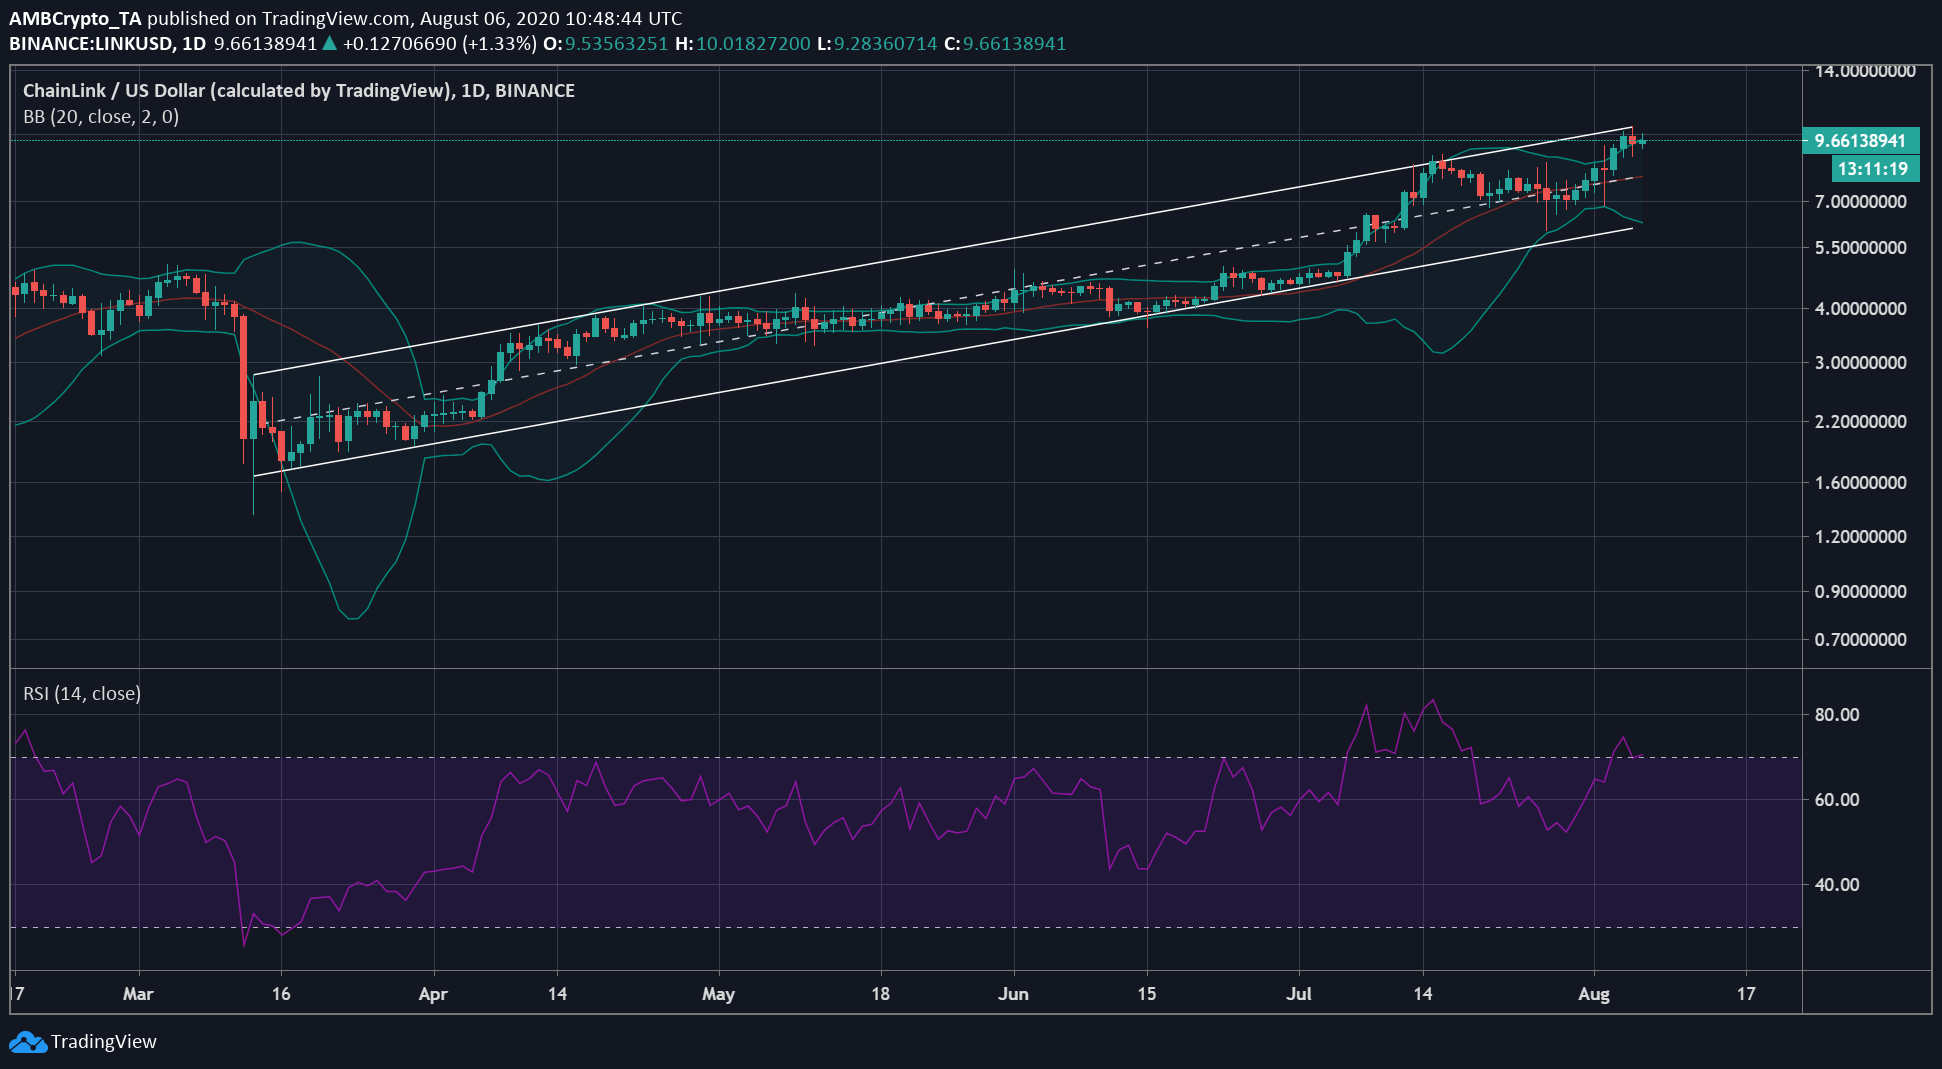
As noted in the daily chart attached herein, the price of the digital asset has been bouncing between two parallel lines. These lines connected the higher highs and higher lows of the coin and formed an ascending channel pattern. The pattern is usually considered a bearish pattern, one that suggests that a breakdown may be making its way to the market soon. The Signal line for the Bollinger Bands remained under the price bars. Therefore, the chances of a breakdown occurring anytime soon remained scarce, at the time of writing.
However, the market was open to high volatility as the Bollinger bands were diverging. This unexpected volatility could slash the price of the crypto-asset. At the same time, even the Relative Strength Indicator [RSI] was noting that LINK was already overbought. Therefore, selling pressure could bring the LINK market back to an equilibrium state.


Source: LINK/USD on TradingView
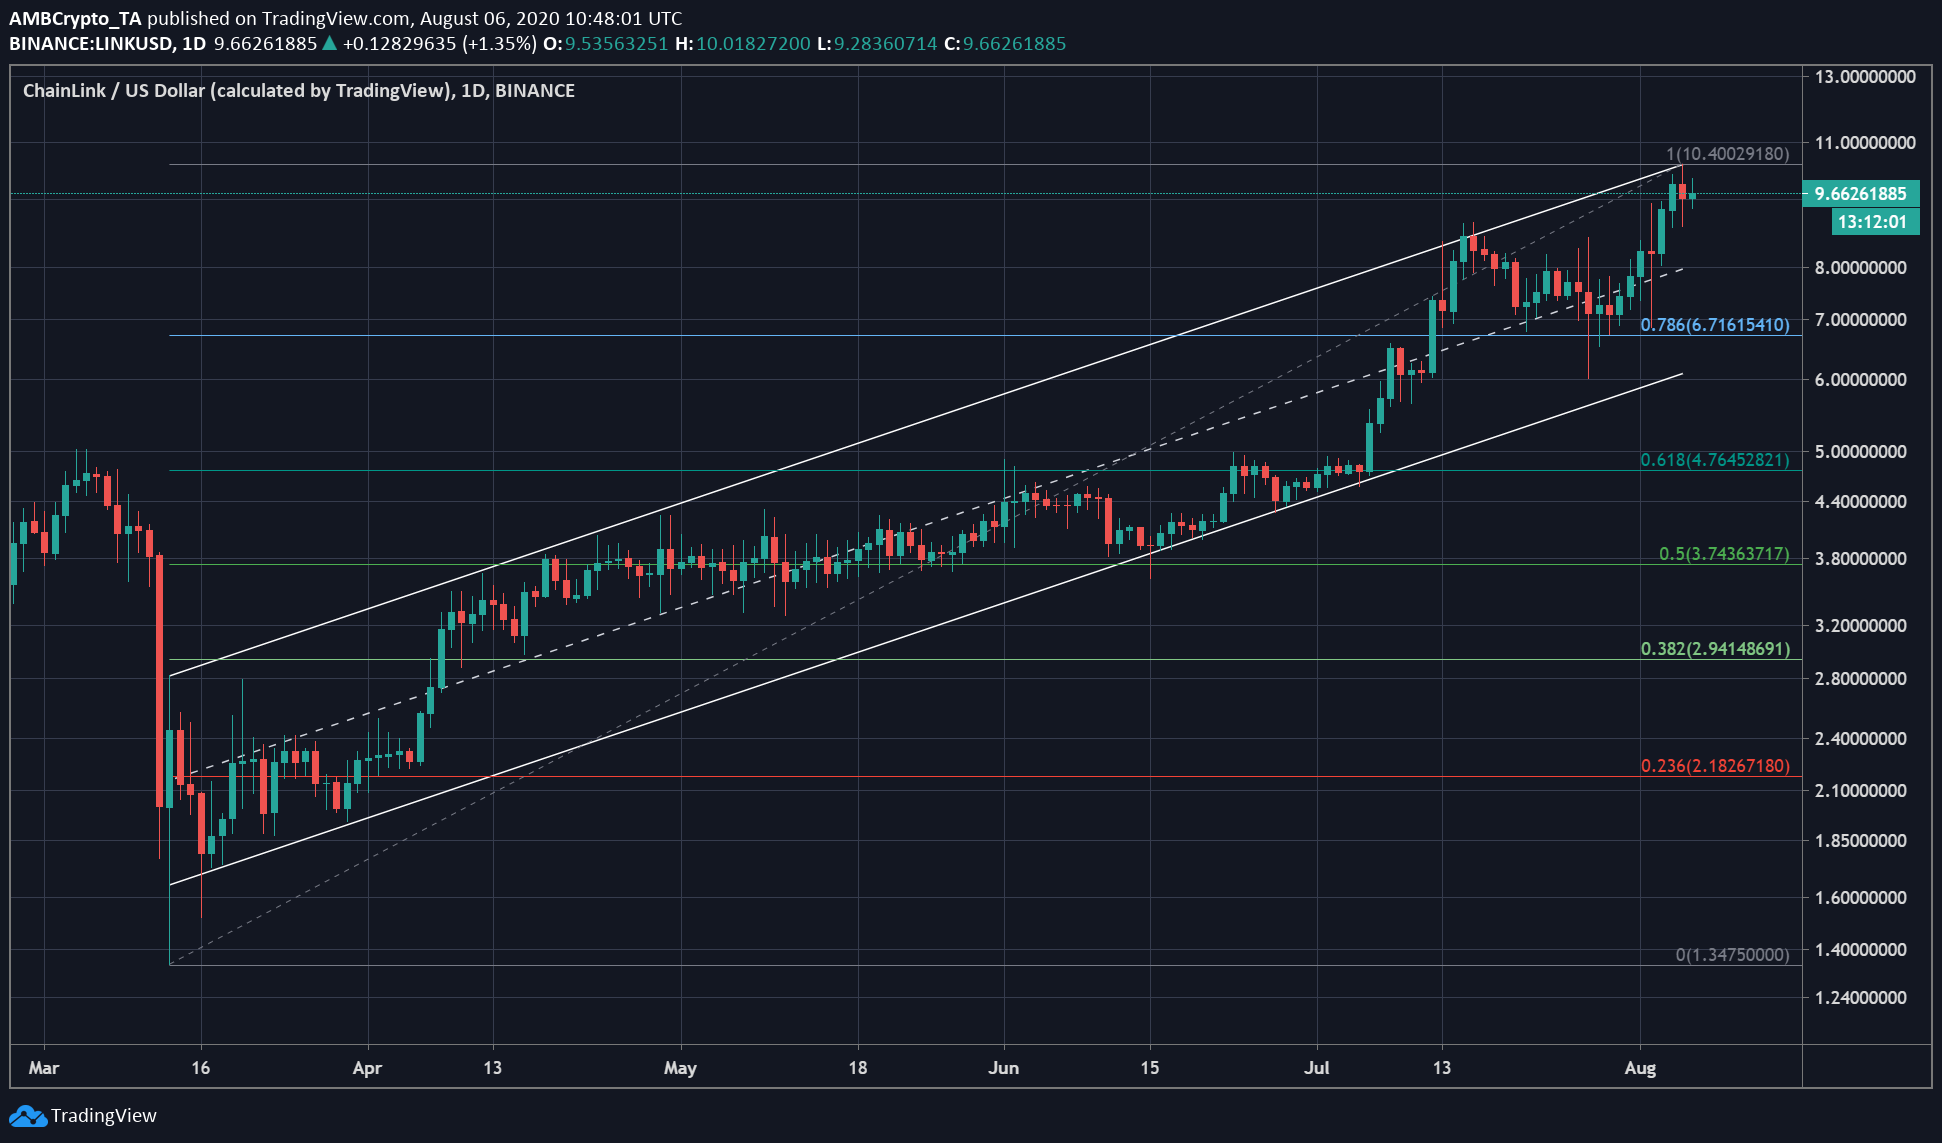
Going forward, as the coin is already at its peak, selling pressure could pull down the price of LINK from $9.66 to $6.71, largely due to a lack of strong support at a higher price level. However, low support levels and increased sell-offs could also lead to the coin slipping to $4.76, as highlighted by the Fib Retracement tool. This point has not acted as a strong resistance level before, thus, LINK may lose nearly 50% of its press time value if the selling pressure increases in the market.
The post appeared first on AMBCrypto


