Disclaimer: The findings of the following article are the sole opinion of the writer and should not be taken as investment advice
Chainlink and most of the market’s altcoins suffered a brutal crash after the DeFi craze came to a halt. However, there seems to be a revival coming for these altcoins, with some of them likely to push higher on the charts.
LINK, for one, has noted significant price depreciation since 15 August, or for about 2 months now. However, following a period of consistent price depreciation, there seemed to be a bullish pattern developing, at the time of writing.
LINK 1-day chart


Source: LINKUSD on TradingView
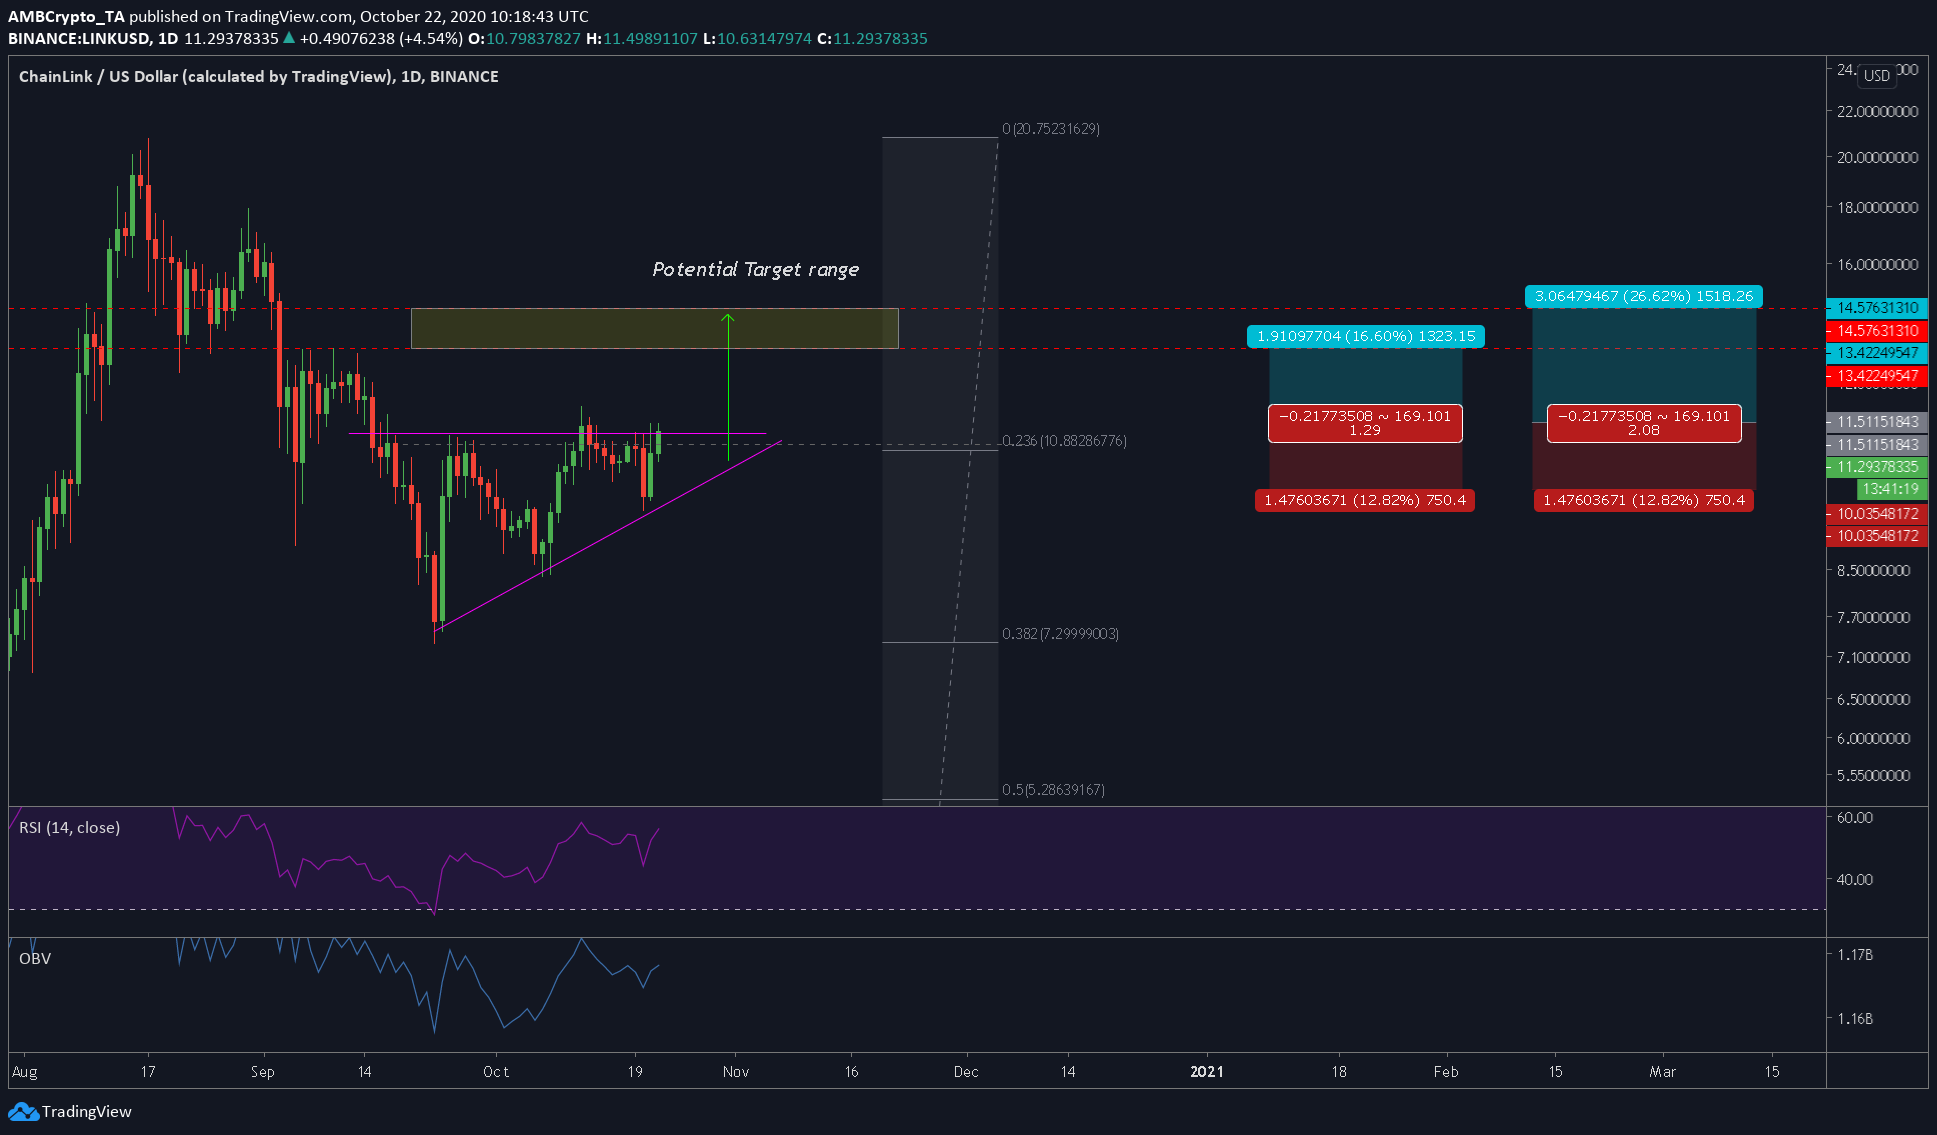
The attached chart has two important aspects to it – the technical bit and the trading bit. The former includes important levels and the direction on trade one might wish to take. The latter, however, goes into detail about the entry, exit, and take-profit levels.
The price of LINK, at press time, was forming an ascending triangle, which is an inherently bullish pattern. Should the coin break higher on the charts, there is a resistance zone ranging from $13.4 to $14.5, a zone that can act as a good take-profit level.
Further, the resistance at the 0.236-Fibonacci level [aka $10.88] was getting weaker as the price had already tried breaching it twice and for the third time, at the time of writing. The result of the third time, however, could be a breakout.
A successful retest of the $10.88-level as support could be a good time to enter a long position.
Rationale
Apart from the bullish pattern, the RSI and the OBV signaled the price’s recent ascent. Moreover, the altcoins, including LINK, looked primed for a rally, with or without Bitcoin.
Levels to look out for
Risk-to-Reward: 1.29
Entry: $11.51151843
Take-Profit: $13.42249547
Stop-Loss: $10.03548172
Risk-to-Reward: 2.08
Entry: $11.51151843
Take-Profit: $14.57631310
Stop-Loss: $10.03548172
Adding Bitcoin’s rally FOMO to trades with good R and altcoins looking primed for a small rally, these long trades look promising and are similar to DOT’s pwn price analysis for 22 October.
The post appeared first on AMBCrypto


