Chainlink and its marines are in utter disbelief after the coin dropped by 62% from its ATH in just over a month. Regardless, the marines have diamond hands and are holding their bags, especially retail.
Their patience might be rewarded soon, however, as the price was pointing towards a bullish breakout soon. However, the bears seem to have one last jab to dish out. This article takes a look at the short-to-medium term price for LINK.
Chainlink 1-day chart


Source: LINKUSD on TradingView
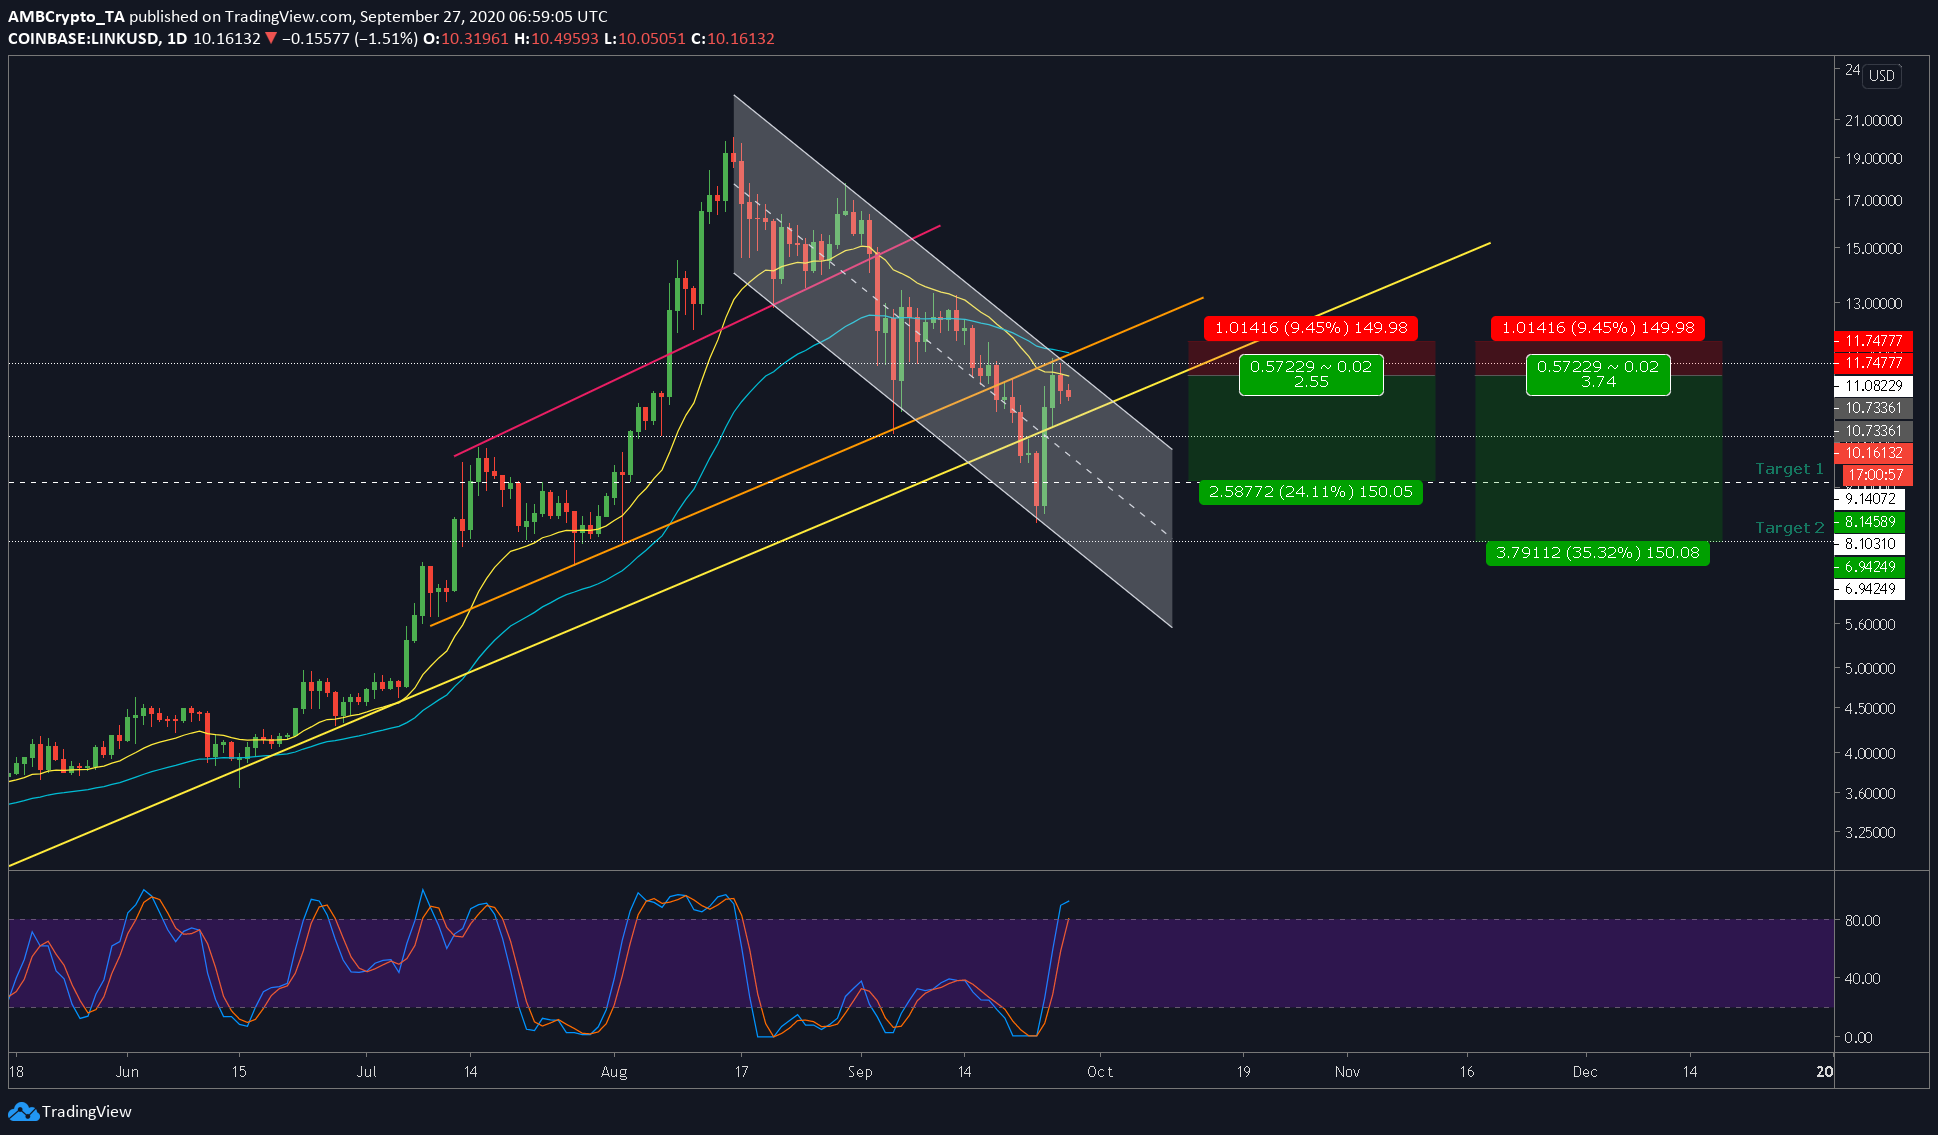
To better understand the chart, it can be broken down into two parts – short-term and medium-to-long term. For the purpose of this article, however, let’s just stick to the short-term. Here, the descending channel formation is bullish. However, the breakout may still be far away.
Short-term
In this scenario, the position will be a short trade, taking advantage of the price move from the top of the channel to the middle/bottom of the channel. The rationale behind this trade is supported by the Stochastic RSI, which pointed to a bearish crossover and the moving averages 20 [yellow] and 50 [cyan] forming above the price. Both of these were bearish, hence, the short position.
In addition to this, the inclining resistance lines [yellow, orange, and pink] are all important levels that will resist the price from moving higher. At press time, the price had also been rejected by the yellow inclining resistance, in addition to the top of the descending channel and the moving averages. Clearly, the $11.08-level is a confluence of resistance. Ergo, the chances of the price breaching this level are low.
The entry for this trade is at $10.73 with stop loss at $11.74, and take profit at two levels – the first one at the center of the channel aka $8.14, and the second at $6.94, which is at the bottom of the channel.
The best way to approach this would be moving the stop-loss to $8.14, once this level is achieved by using a trailing stop-loss to further maximize profits down to $6.94.
The post appeared first on AMBCrypto


