- Despite the ongoing correction, Link remained relatively stable today.
- The price is likely to bounce back if the channel’s lower boundary continues to act as support.
- Chainlink would continue to correct downward as long as selling volume increases in the market.
LINK/USD: Chainlink Struggles Under $4
Key Resistance Levels: $4, $4.5, $4.98
Key Support Levels: $3.47, $3, $2.63

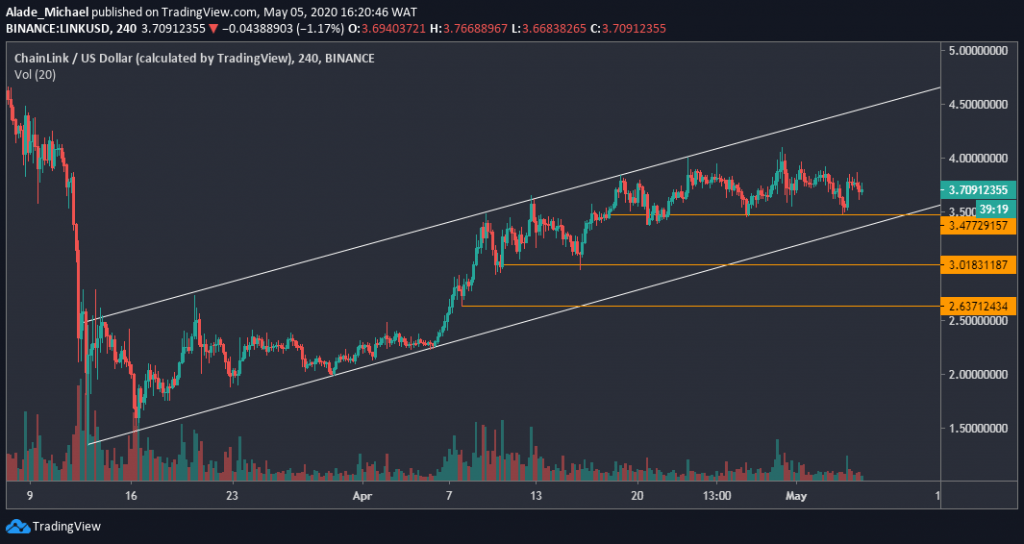
Since our previous analysis, Chainlink continued to trade sideways after reaching an 8-week high of $4.1 in late April. After that, the price dropped to a two weeks support at $3.47 before staging a slight recovery.
Link is currently priced at $3.7 against the US Dollar. From a short-term perspective, it continues to remain trapped in a two-month ascending channel, which suggests that the uptrend is still very much valid on the 4-hours chart.
As can be seen above, Link is heading towards the channel’s support. It would resume bullish rally once the price respects this support. If not, a channel breakdown might trigger a massive dump in price.
Chainlink Price Analysis
Chainlink has been trading in a tight range between $3.47 and $4 for a while now. In case of a breakdown, its next selling target would be the $3 support. Below this, support lies $2.63, all marked orange on the price chart.
A clear break above $4 price level is likely to initiate a fresh buying round for Link. The following resistance to watch above is $4.5 and $4.98, as mentioned in our previous analysis.
Currently, the trading volume is on the downward side. An increase in volume would indicate a trend continuation for Link. A reversal should be expected once the price and volume continue to decrease.
LINK/BTC: Price Gets Weak As Chainlink Approaches Support
Key Resistance Levels: 45000 SAT, 52700 SAT, 55000 SAT
Key Support Levels: 37566 SAT, 33372 SAT, 30000 SAT

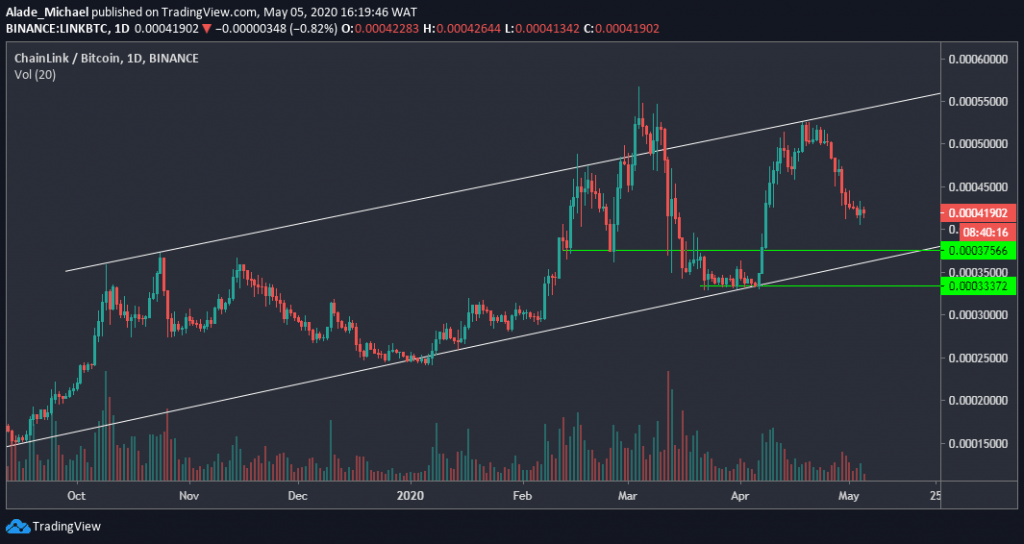
Against Bitcoin, Chainlink maintained a downward range since the price fell from the channel’s resistance at 52700 SAT marked on April 18. The price is now bottomed at 41855 SAT after breaching 50000 SAT and 45000 SAT.
Meanwhile, after gaining momentum in late 2019, Chainlink followed a higher high and higher low pattern – a bullish formation – inside a channel. Link broke out from the ascending channel but failed after marking a yearly high at 56660 SAT in early March.
As of now, Chainlink is looking for nearby support as bears continue to drive price downward.
If the market can find support at the key level of 40000 SAT or perhaps at the immediate green line of 37566 SAT (around the channel’s support), a quick recovery should be expected. It would be more devastating if the price drops below the channel.
Chainlink Price Analysis
A quick recovery from the above-mentioned key levels could take the price back to 45000 SAT quickly. Link could reclaim April’s high of 52700 SAT, followed by 55000 SAT, around the channel’s resistance.
However, it may slip slightly to the second green level of 33372 SAT if the price continues to drop on the intraday trading. The critical support to keep in mind after this is the 30000 SAT level.
Looking at the daily chart, the selling volume is slowly decreasing to suggest that bears are getting weak by the day. There’s hope for the bulls if Chainlink keeps respecting the channel pattern.
The post Chainlink Price Analysis: Link Consolidates After Losing $4, The Calm Before The Storm? appeared first on CryptoPotato.
The post appeared first on CryptoPotato


