Chainlink continued to fall on the charts as Bitcoin showed signs of bearishness. Tron’s market was controlled by bears and TRX was likely to go lower, however, it did show a bullish divergence that might play out in the coming hours. IOTA also had a bearish outlook, as most of the crypto market bled after Bitcoin was rejected at the $11,000 level.
Chainlink [LINK]


Source: LINK/USD on TradingView
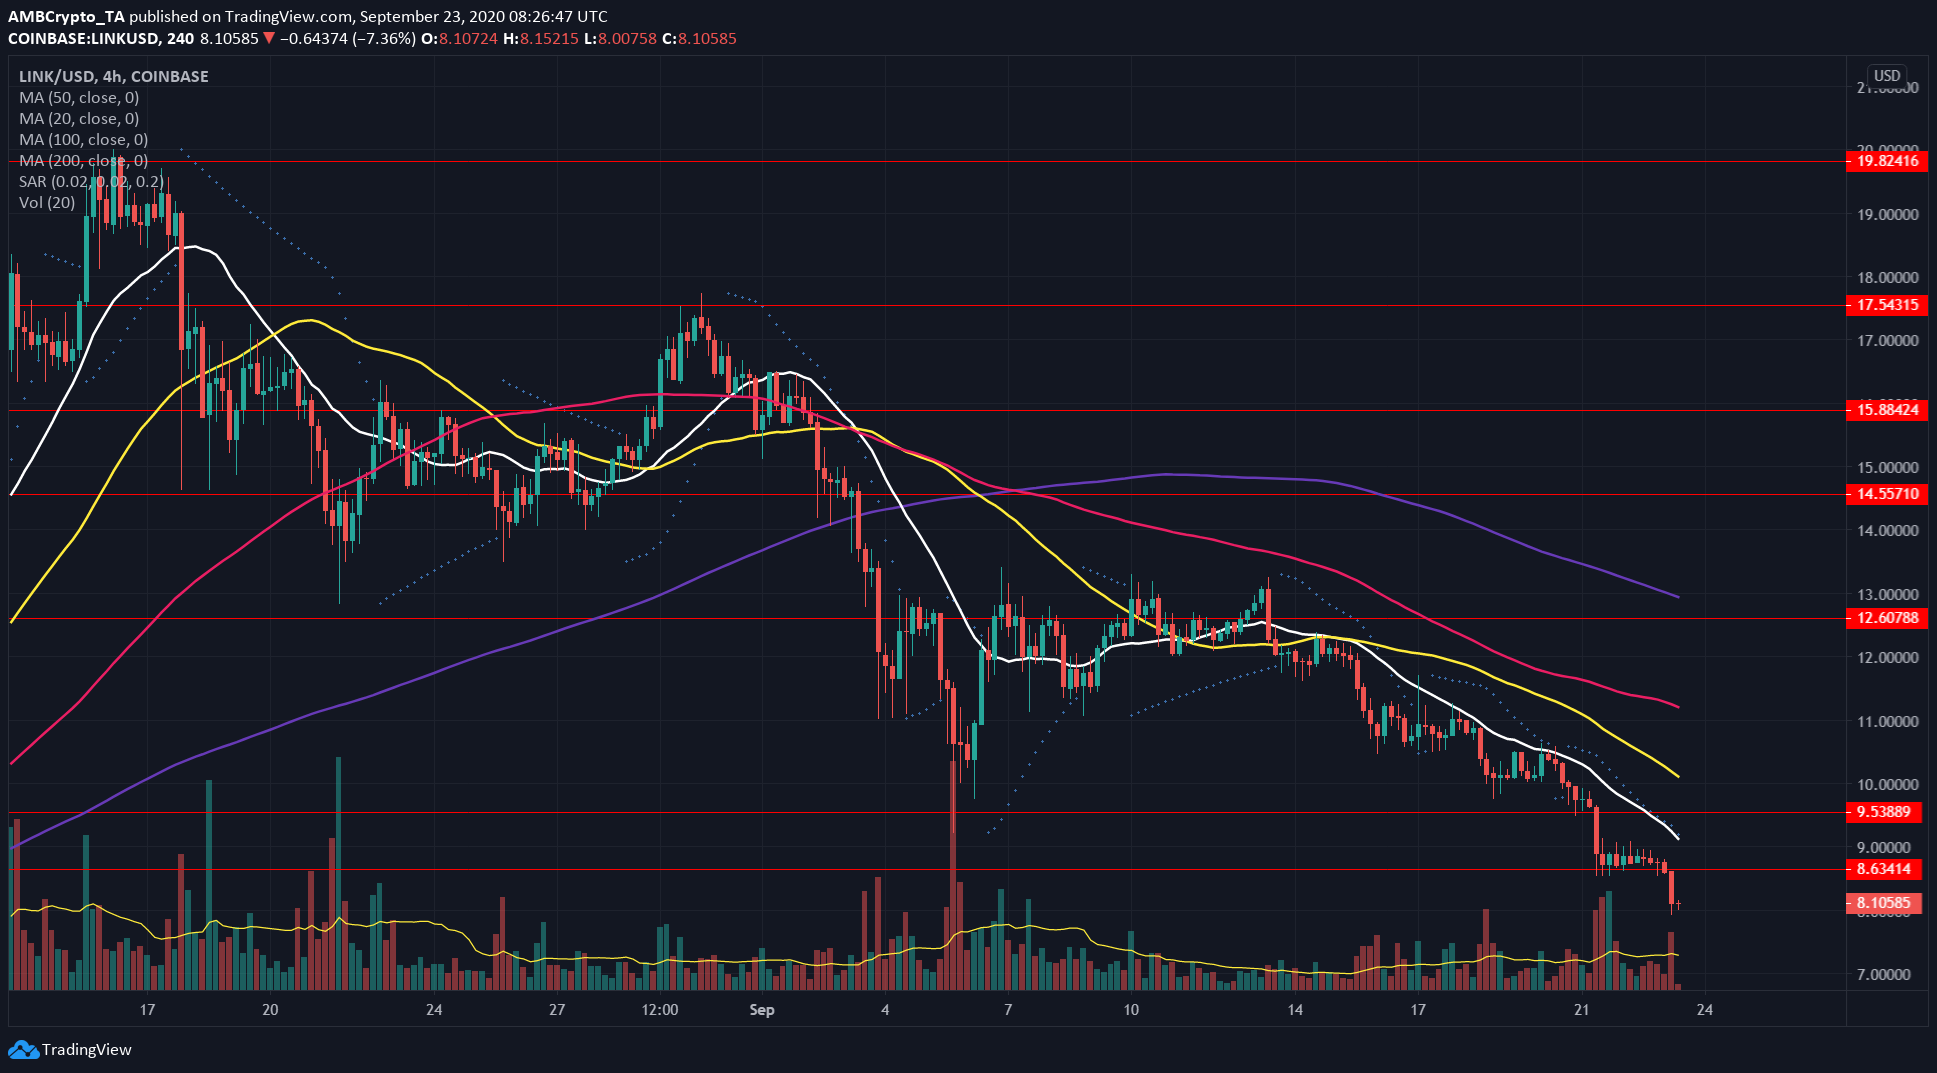
The 20 SMA (white) was beneath the 50 SMA (yellow), which in turn was beneath the 100 SMA (pink), showing the downtrend had been in play for weeks. Till recently, the 200 SMA had been untouched but last week, the 100 SMA crossed beneath the 200 as well.
The loss of support at the $8.6 region was also on heavy trading volume, confirming the strength of sellers in the market. Parabolic SAR also gave a sell signal, and the indicator’s dots can be used to decide where to place a stop-loss.
The downtrend was strongly established and sellers called the shots in the market. The situation was unlikely to improve anytime soon, with the behavior of Bitcoin, Bitcoin Dominance, as well as many altcoins that had a stellar August but a red September.
LINK was likely headed toward $7 in the coming days. It is possible but unlikely that buyers show strength in the $7.8 zone and stall the downtrend.
Tron [TRX]


Source: TRX/USDT on TradingView
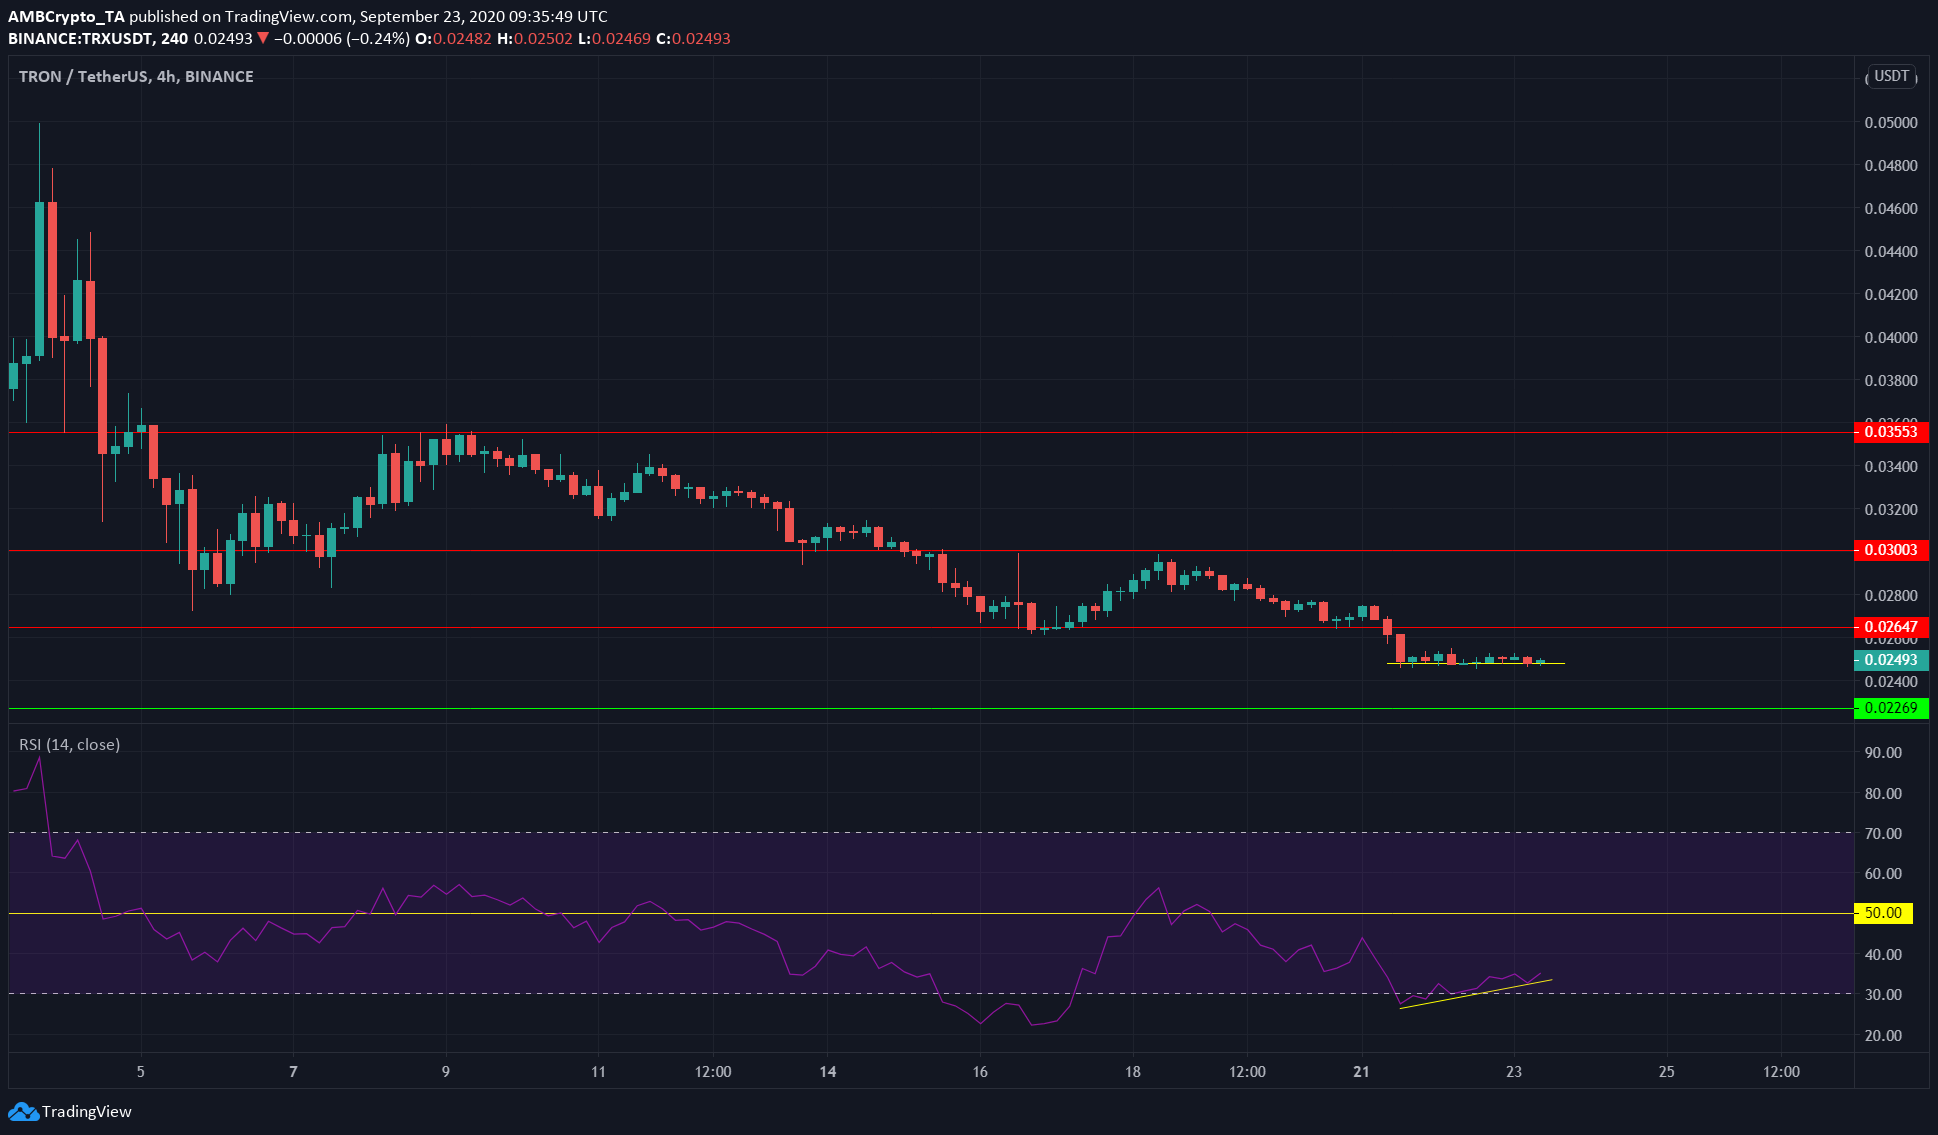
TRX was in a strong downtrend, made apparent by the lower highs and lower lows TRX has set since local highs at $0.046. RSI has also been unable to rise above 50 in the past couple of weeks.
RSI showed a value of 35 at press time. While this indicated strong bearish momentum, a bullish divergence can also be seen, shown in yellow. Price made equal lows while RSI made higher lows. The divergence could propel TRX to test resistance at $0.026.
In conclusion, bears were in control and price could be headed toward $0.0226 level of support.
IOTA


source: IOTA/USD on TradingView
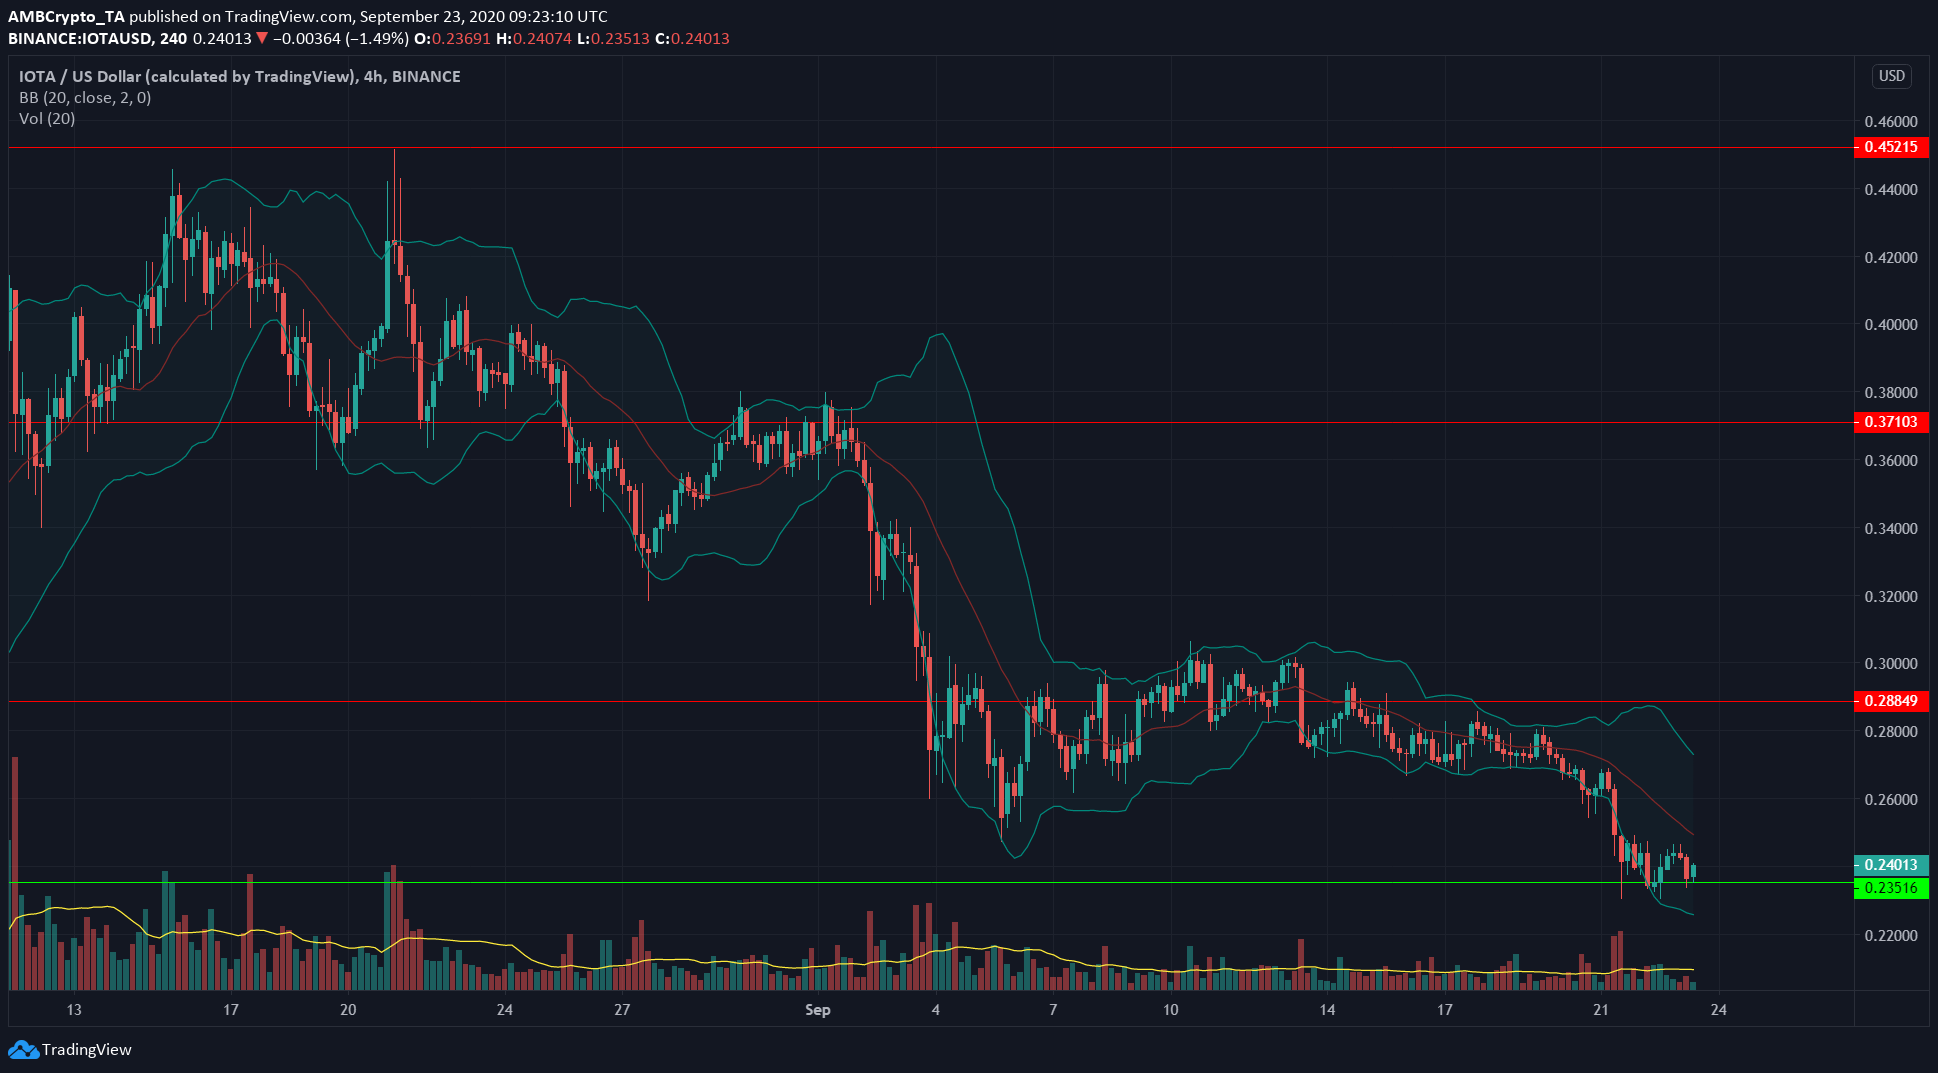
The Bollinger bands for IOTA had widened on the charts as the price settled towards the lower end of the bands. This suggested an imminent drop, and subsequently, IOTA dropped from $0.263 to test support at $0.235. This move was also backed by above-average trading volume, demonstrating valid seller presence behind the drop.
If the price closed beneath the support level at $0.235, it is likely to head further south.
IOTA had a minor bounce before facing selling pressure once more and could drop beneath the level of support at the $0.215 region.
The post appeared first on AMBCrypto


