Chainlink witnessed a small price correction, but the digital asset looks poised for some gains, with a bullish recovery around the corner.
Zcash experienced weak selling pressure, in the midst of a highly volatile scenario. While a positive reversal was expected, prices could move in either direction. DigiByte’s technical indicators suggested a clear bearish scenario for its immediate short-term trading sessions.
Chainlink [LINK]
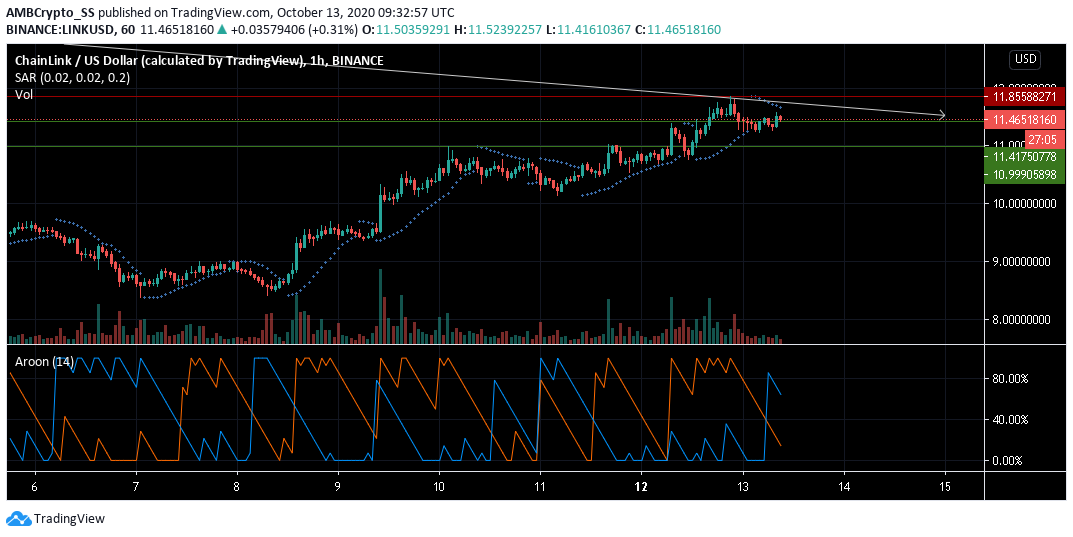
At press time, Chainlink was trading just above a crucial support level at $ 11.417. The digital asset had displayed a consistent uptrend over the last week and was up by nearly 5% since yesterday.
Looking at the below-average level of volume, sellers lacked the required strength to continue a strong downward selling pressure.
Nevertheless, short term trends remained bearish as signaled by the Parabolic SAR’s dotted lines above the price candles. Aroon Indicator too, gave a sell signal, as the Aroon Up (orange) dived below the Aroon Down (blue).
If bears fail to maintain a strong selling pressure, prices might bounce back up from the immediate support of $ 11.417 in the next few trading sessions.
Zcash [ZEC]
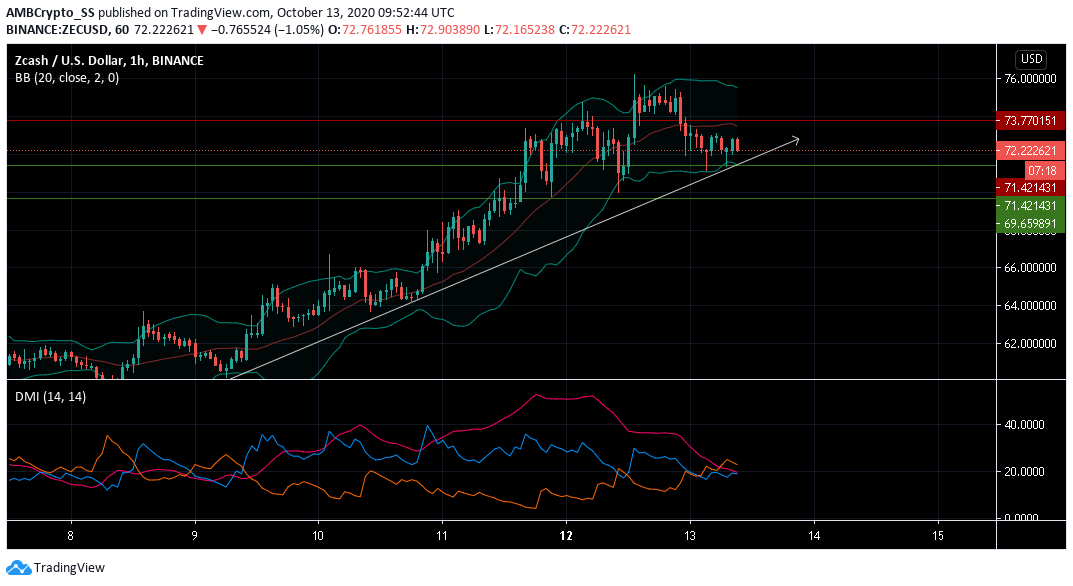
Since the weekend, Zcash was maintaining its overall upward price trend. The digital asset at press time was trading just above the confluence of its trendline and immediate support level of $ 71.421.
The Directional Movement Index, DMI with its -DMI above the +DMI gave a sell signal. However, a falling ADX, meant the selling pressure was still not strong enough.
Taking advantage of the situation, if buyers gather momentum in the region just above the trendline, which was a strong support, the sell off could be stalled. A reversal in the price movement, over the next few trading sessions also remained a likely scenario.
However, the increased levels of volatility, as picked up from the widening of the Bollinger bands, gave room to a wide price action, that could push the price in either direction.
DigiByte [DGB]
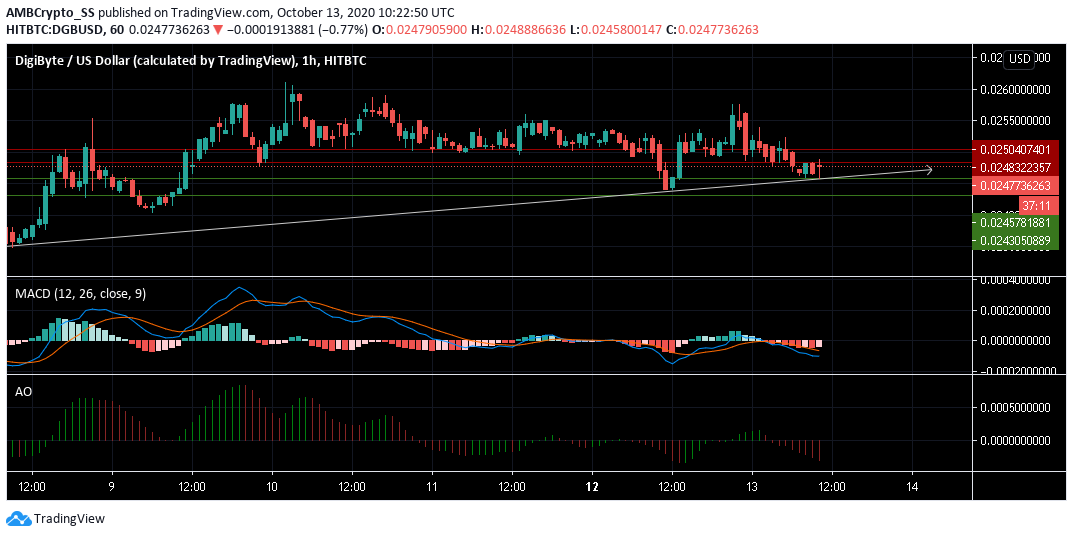
DigiByte at press time was trading just above the trendline at $ 0.024 after falling from $0.0259 level earlier in the day. The digital asset’s technical indicators remained highly bearish, with the MACD making a bearish crossover.
The Awesome oscillator too was seen making a bearish crossover below the zero line, a clear indication of mounting selling pressure.
Price-wise, DigiByte had also finally broken out of its consolidation and may experience a short-term selling pressure, over the next few trading session.
The post appeared first on AMBCrypto


