Bitcoin stood at $10,700 and Ethereum struggled to climb past the $355 level. The market as a whole had a bearish outlook, although many assets showed short-term bullishness. Crypto.com Coin was bearish in both the short and medium-term, while IOTA formed a bullish continuation pattern that could take some more time to play out. VeChain was likely to continue to slump under bearish pressure.
Crypto.com Coin [CRO]


Source: CRO/USDT on TradingView
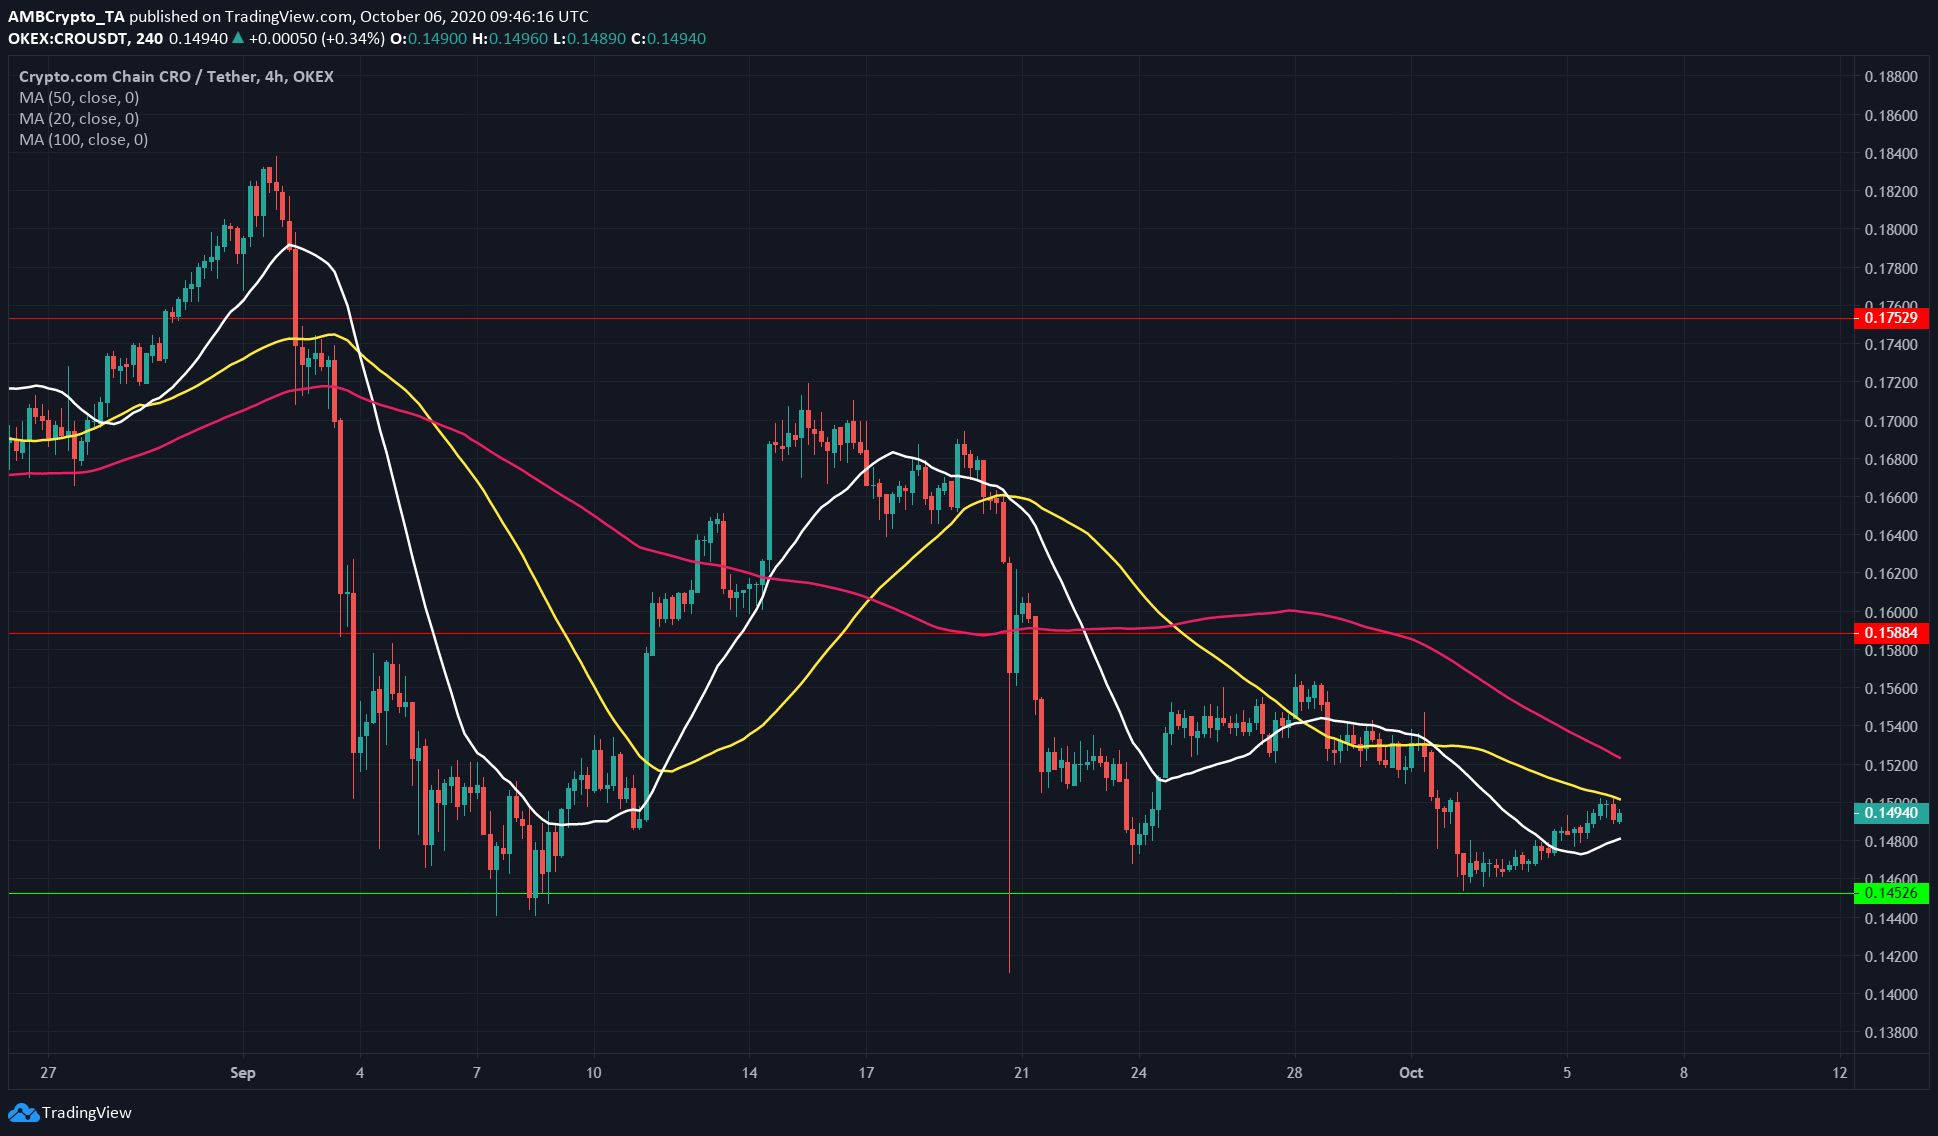
The 20 SMA (white), 50 SMA (yellow) and 100 SMA (pink) were moving one beneath another as CRO signaled bearishness in both the short and medium-term.
In September, CRO bounced from support at $0.145 to reach $0.17 but was forced to drop back down almost as quickly. Since then it has been unable to form a higher high. The most recent, weak bounce off support showed that the price was likely to drop beneath $0.145 to the next level of support at $0.14.
Any move to the upside can expect to find resistance from the moving averages as well.
IOTA


Source: IOTA/USD on TradingView
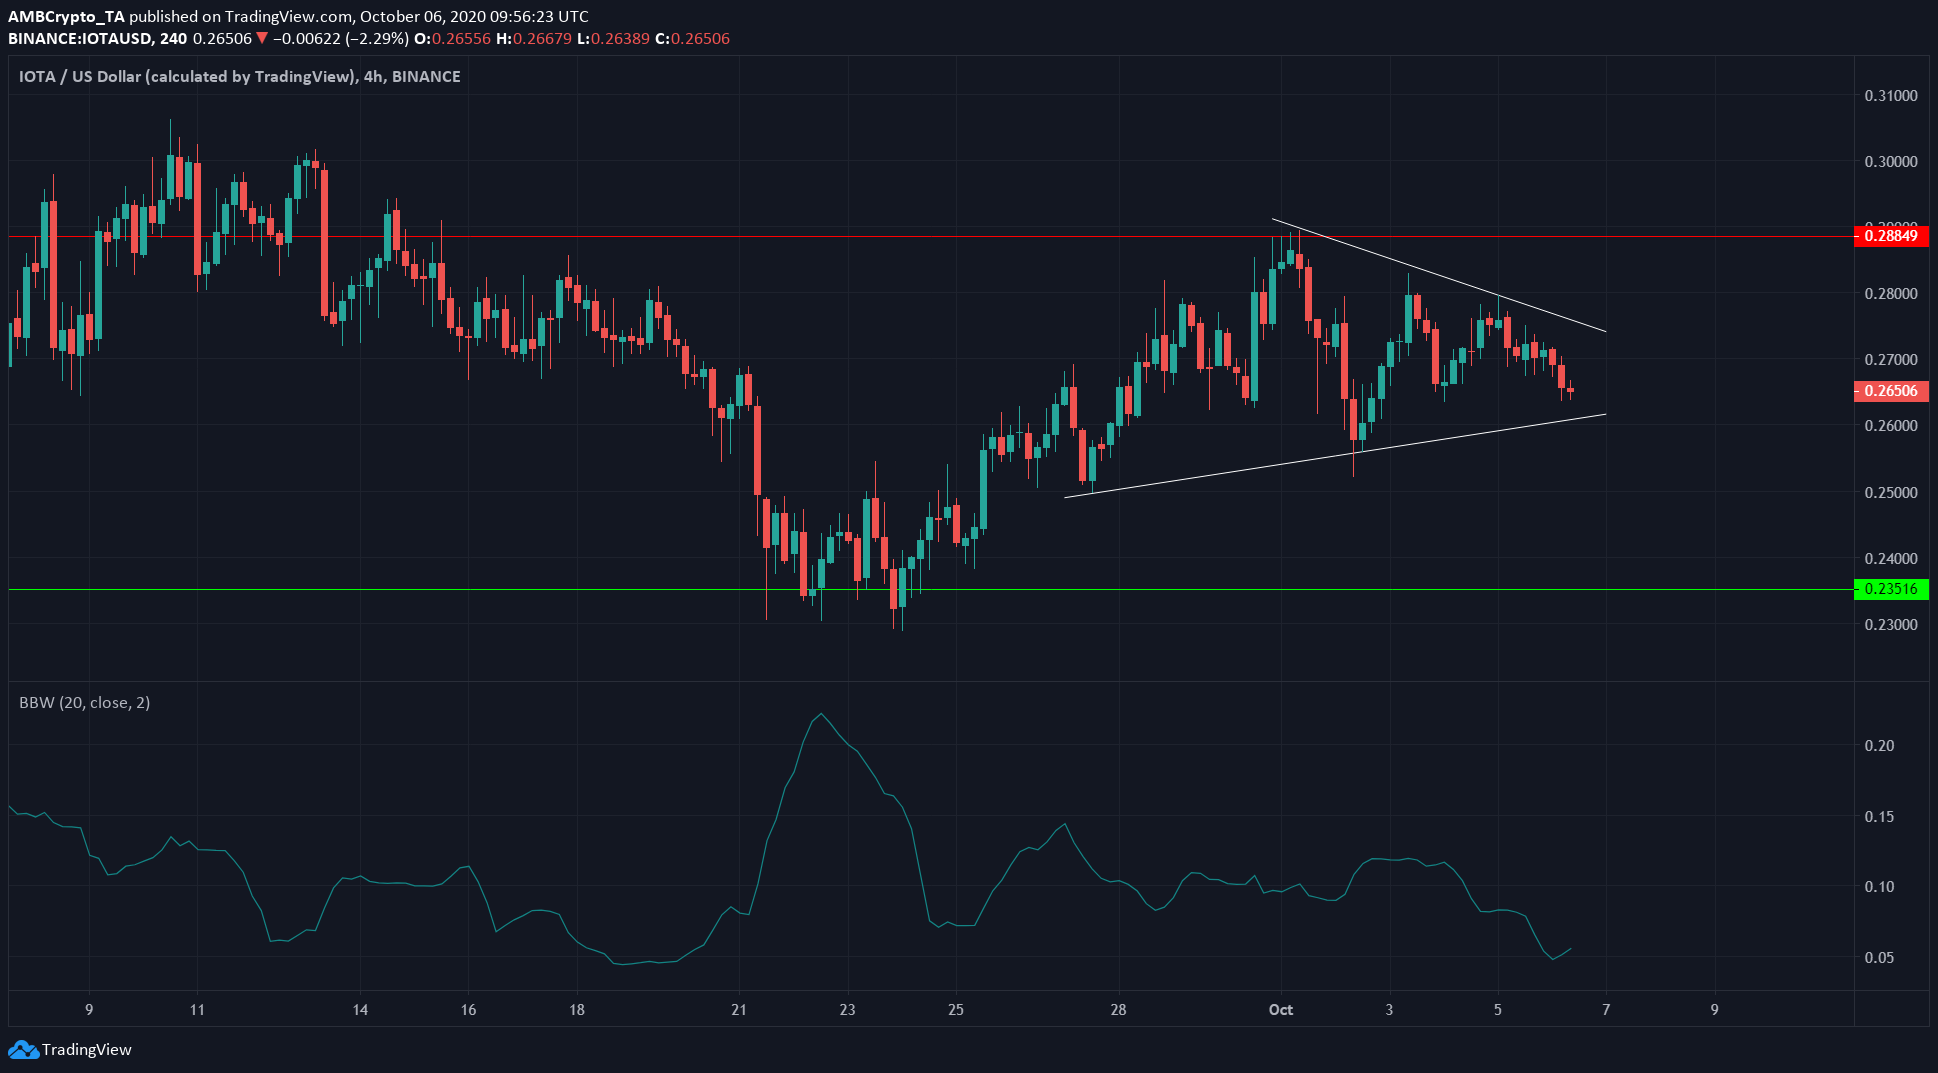
In white is the symmetrical triangle pattern that IOTA appeared to have formed. This is a continuation pattern that sees price, upon breakout, follow the prior trend. In this case, the prior (short-term) trend was upward.
Bollinger Bands’ width was quite low at the time of writing as well. This lowered volatility in price action usually augurs a breakout, with a breakout to the upside more likely.
The price can expect to find resistance at the $0.288 level but could be able to surge past the level.
A close to a trading session beneath the ascending trendline would invalidate the pattern.
VeChain [VET]


Source: VET/USD on TradingView
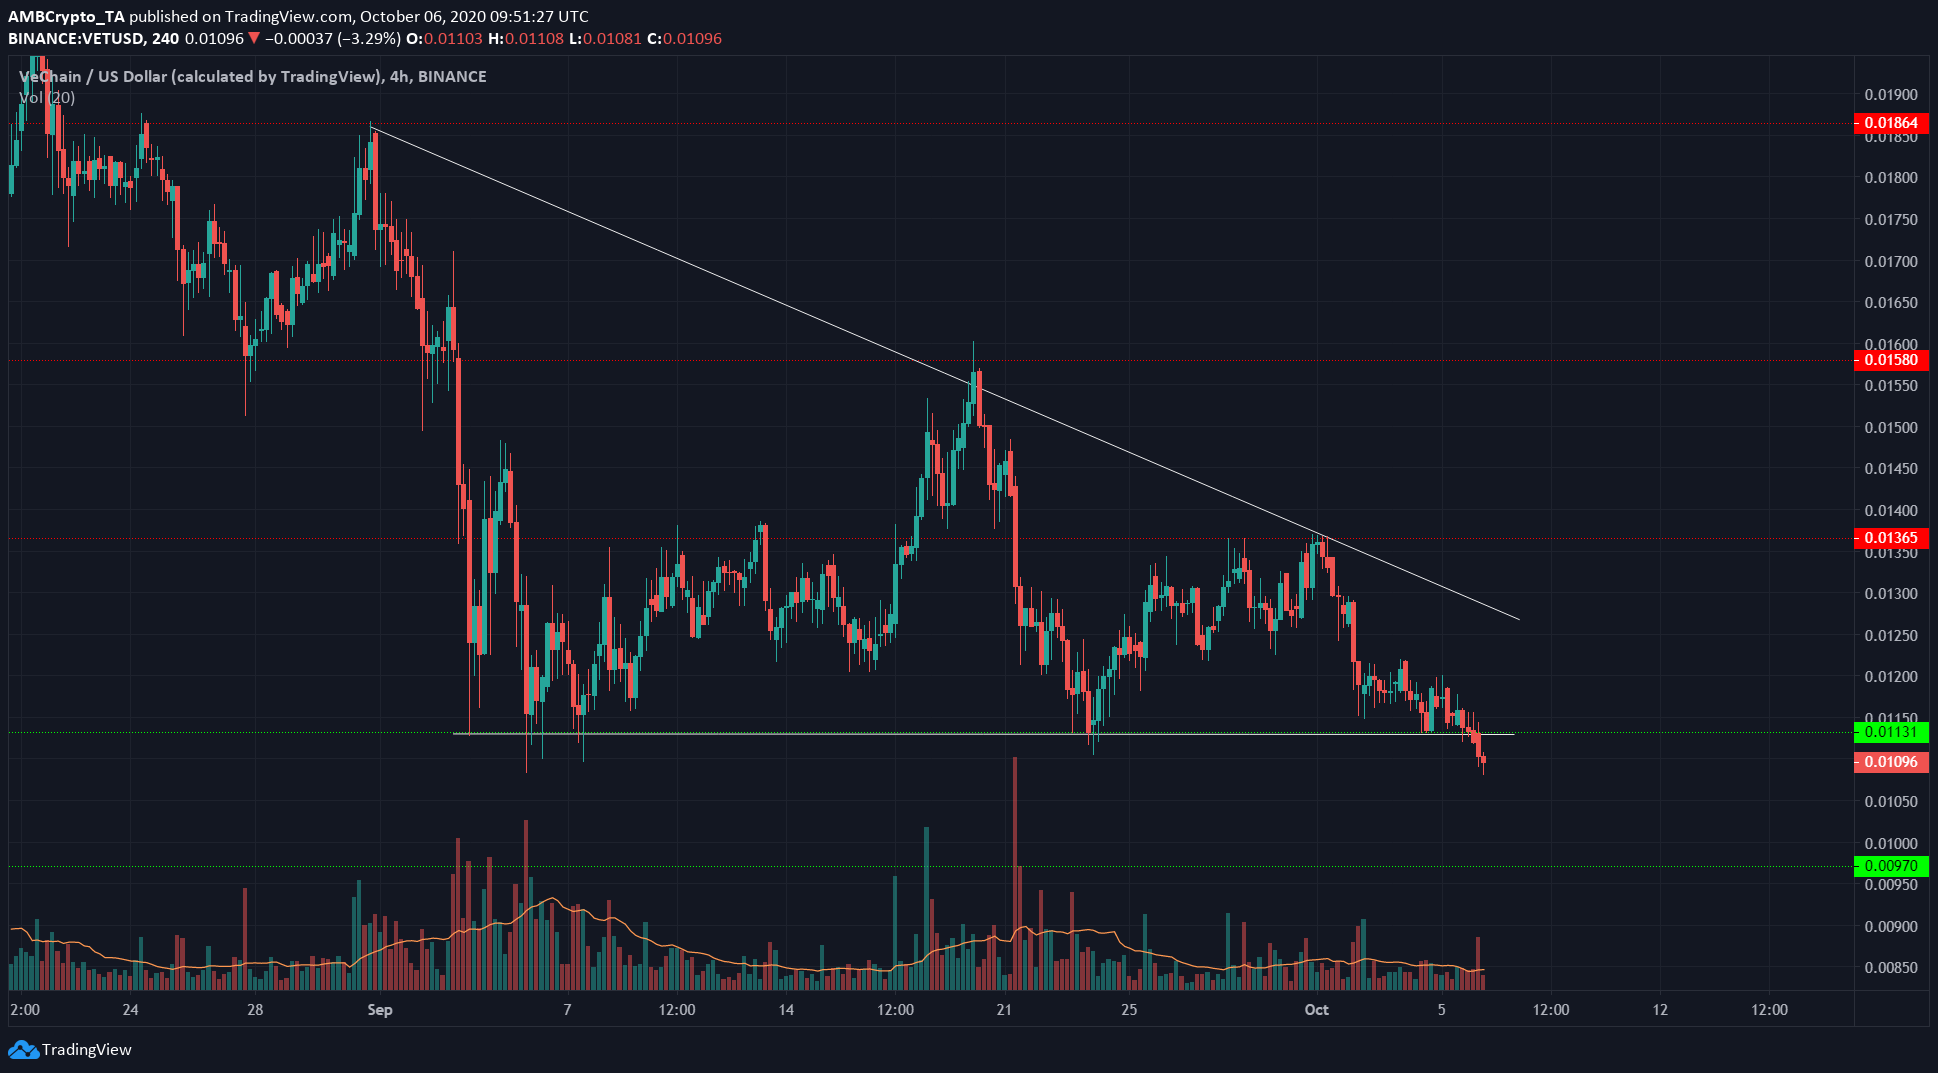
VeChain had formed a descending triangle and had broken out of the pattern on a trading session with above-average volume. This was in conjunction with the bear trend from early August when the price posted highs of $0.23.
There is a chance that price would reverse and form a busted descending triangle, but it was quite an unlikely outcome.
The post appeared first on AMBCrypto


