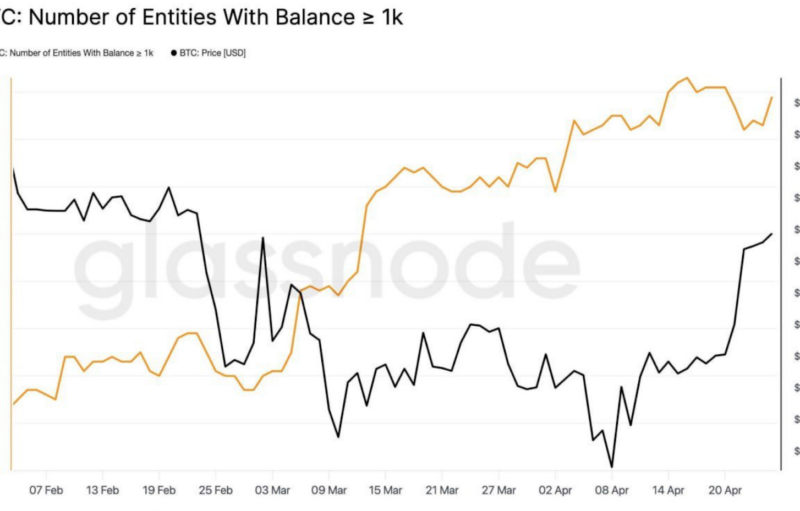
Bitcoin
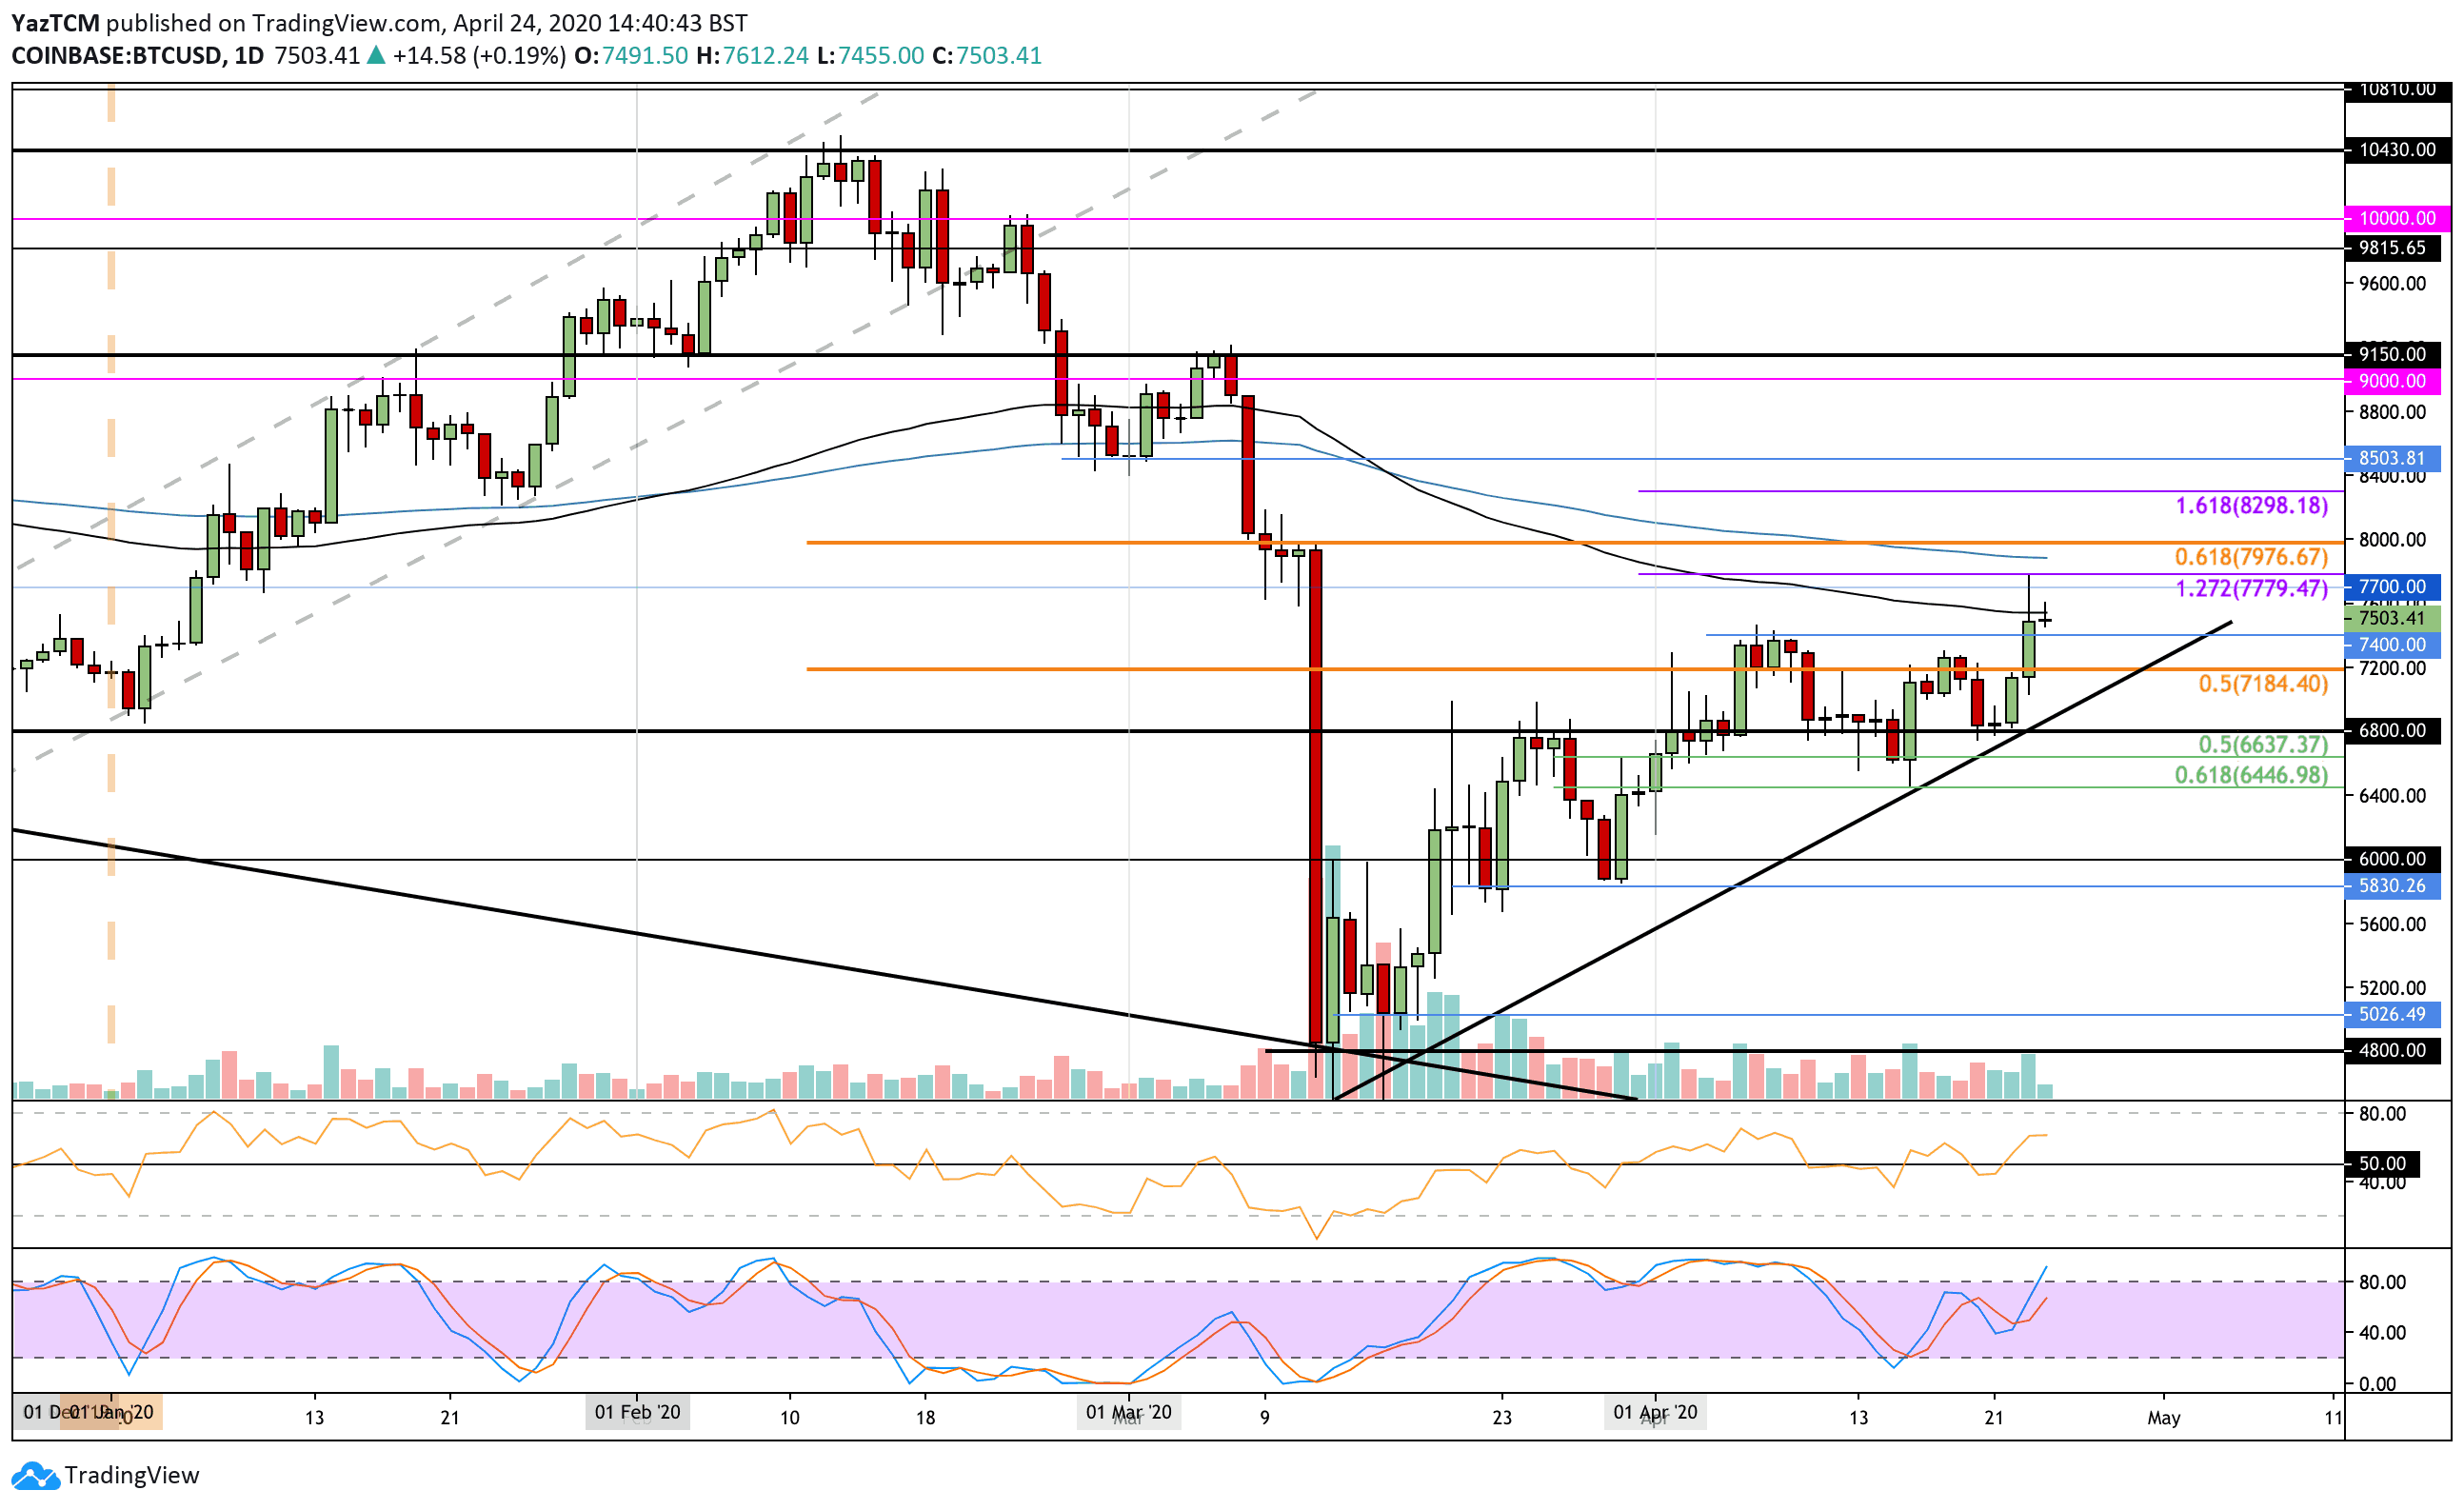
Bitcoin went through a 6.23% price hike over the past seven days of trading as the cryptocurrency managed to push to a fresh April high at $7,700. The coin met resistance at $7,200 last week, which caused it to drop beneath $7,000 at the start of this week. It went on to find support at $6,800, where it rebounded.
On the rebound, Bitcoin took out resistance at $7,000, $7,200, and $7,400 as it spiked as high as $7,780. It since dropped to the current $7,500 level, where it faces resistance at the 100-days EMA.
Looking ahead, if the buyers break above the 100-days EMA, the first level of resistance lies at $7,700. Above this, resistance lies at $7,780 (1.272 Fib Extension), $7,880 (200-days EMA), and $8,000 (bearish .618 Fib Retracement). This is followed by resistance at $8,300 (1.618 Fib Extension).
If the bears push lower, support can be found at $7,400, $7,200, and $7,000. Beneath this, added support lies at $6,800 and $6,640.
Ethereum
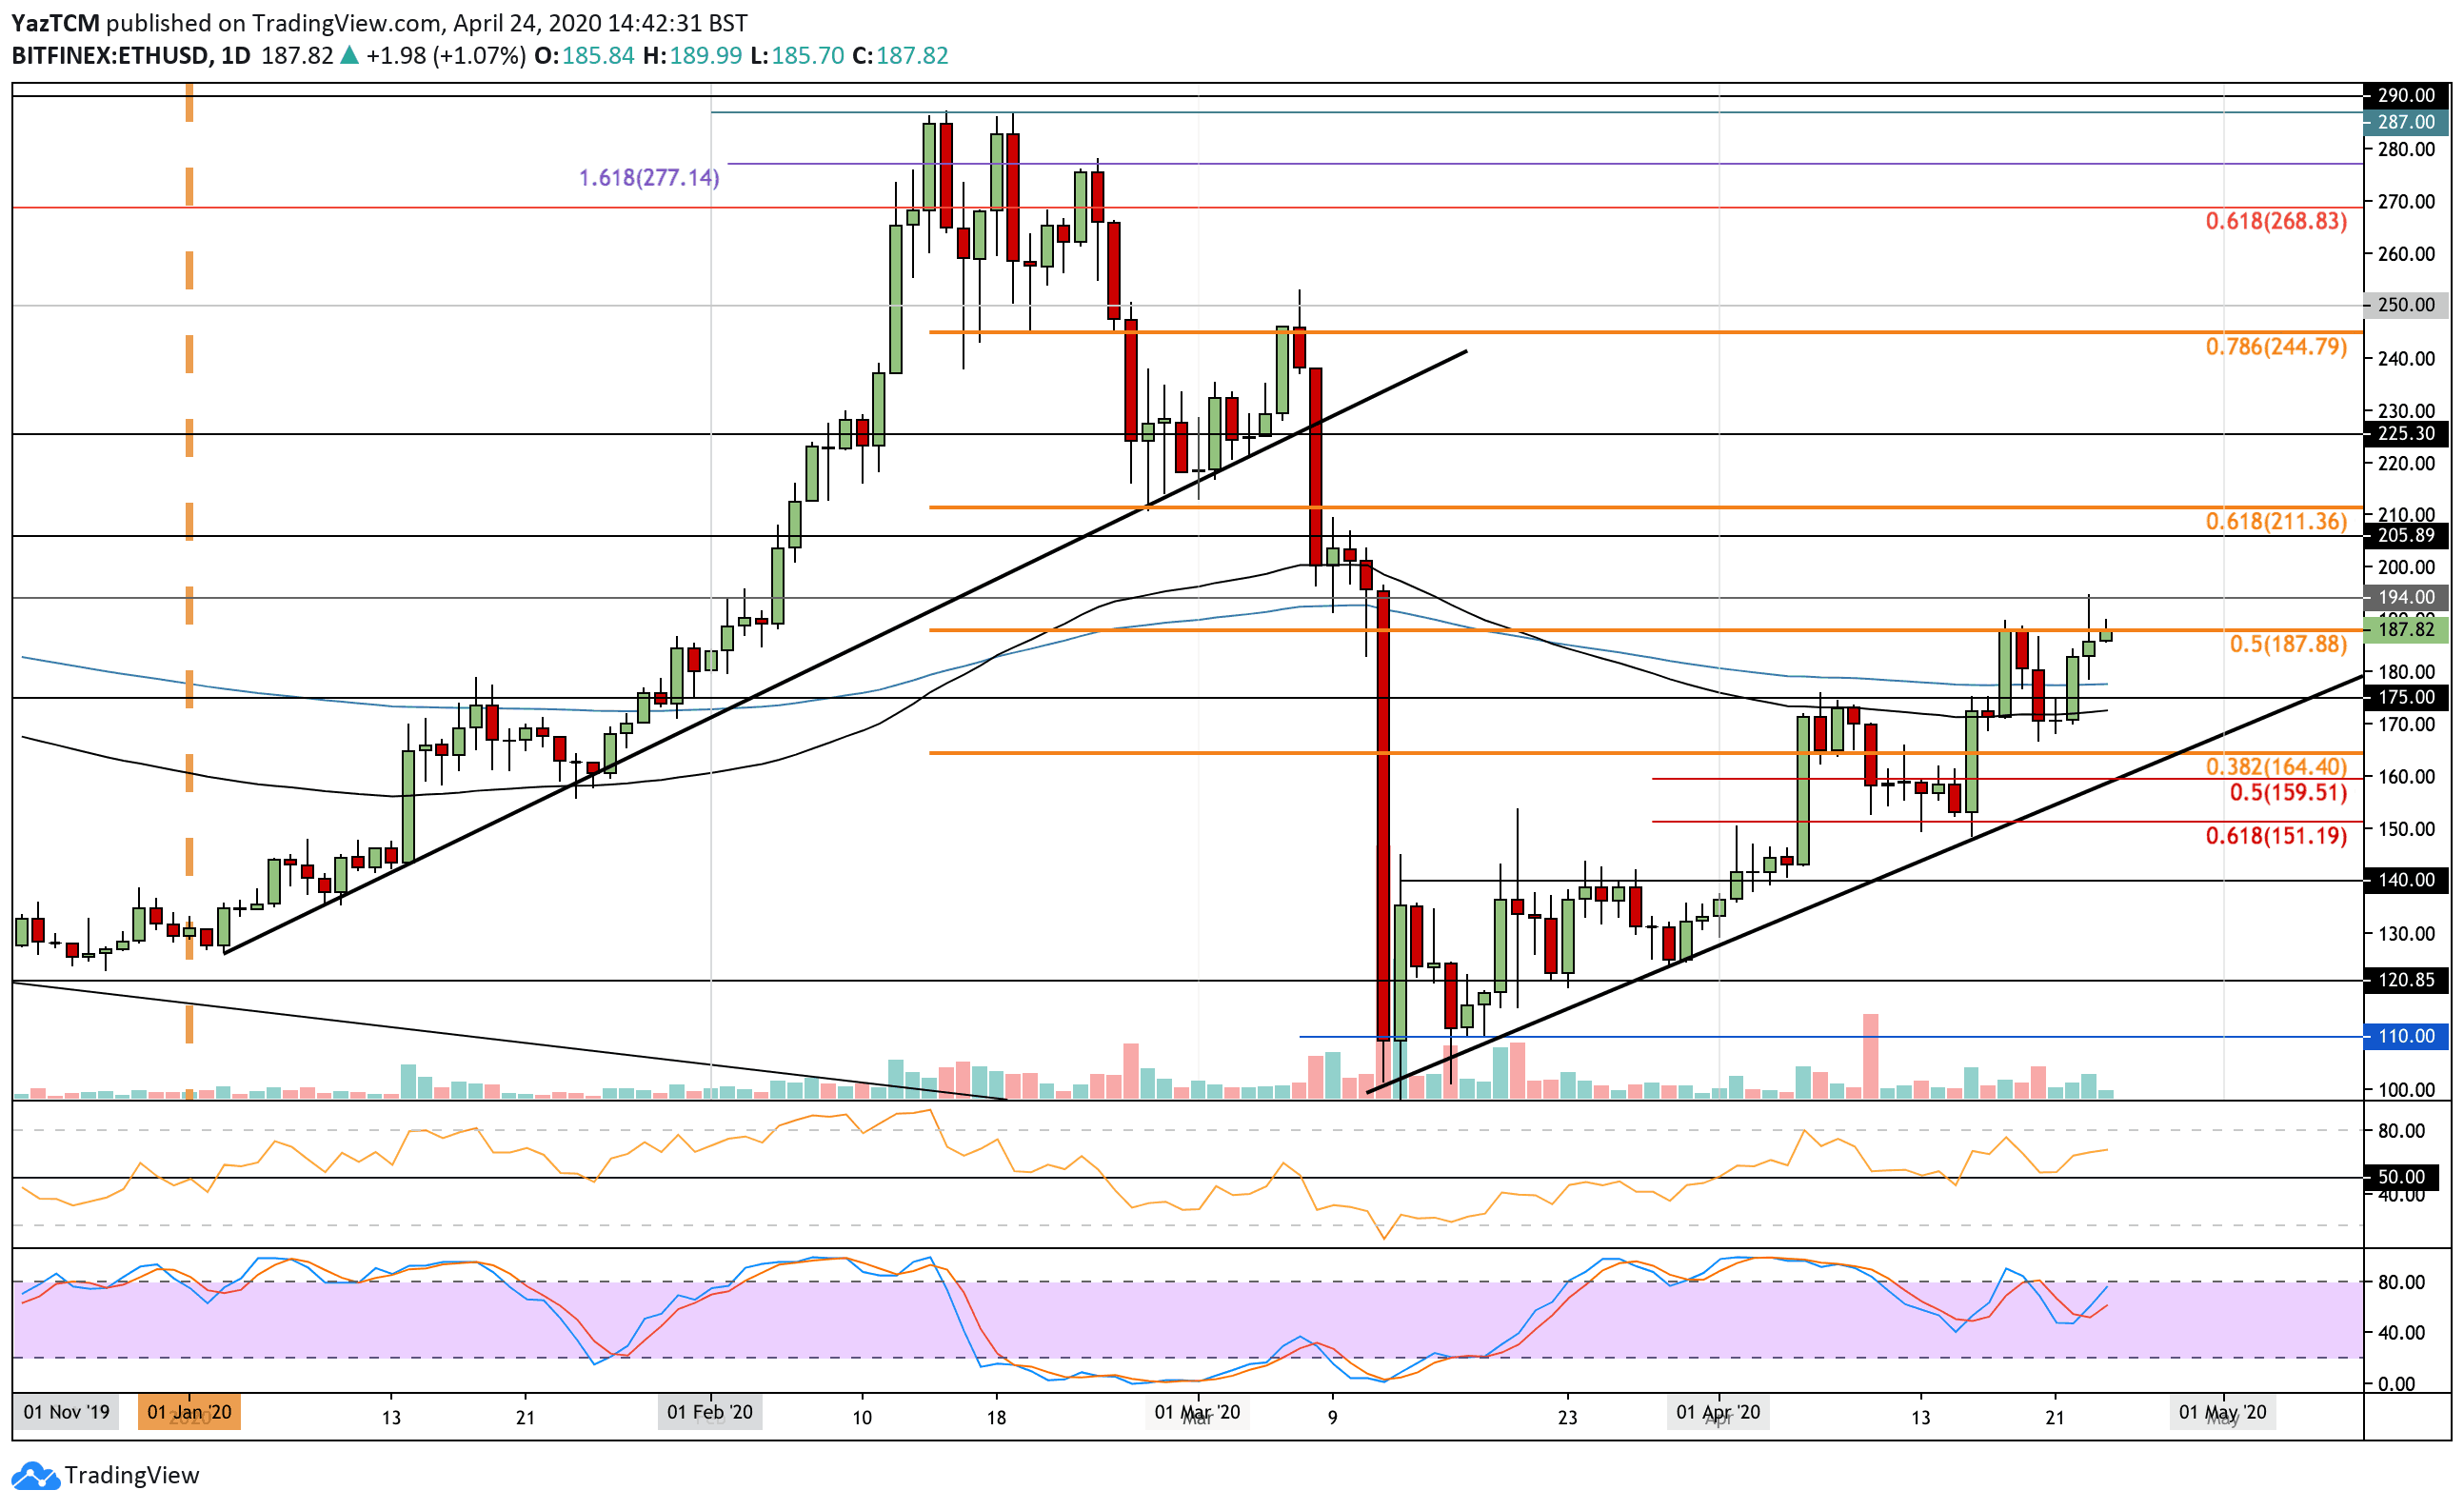
Ethereum saw a 10% price increase this week as it manages to reach the resistance at $188 again.
The cryptocurrency was trading at this level 7 days ago, but the resistance here, provided by a bearish .5 Fib Retracement, caused ETH to drop lower into the support at $170, where lies the 100-days EMA.
ETH rebounded from this level and since returned to the $188 resistance. It actually spiked upward to create a fresh April 2020 high at $194 yesterday.
If the bulls break $188, resistance is expected at $194 and $200. Above this, added resistance lies at $206, $211 (bearish .618 Fib Retracement), and $225.
Toward the downside, support lies at $177 (200-days EMA), $175, and $170 (100-days EMA). This is followed by support at $165 and $160.
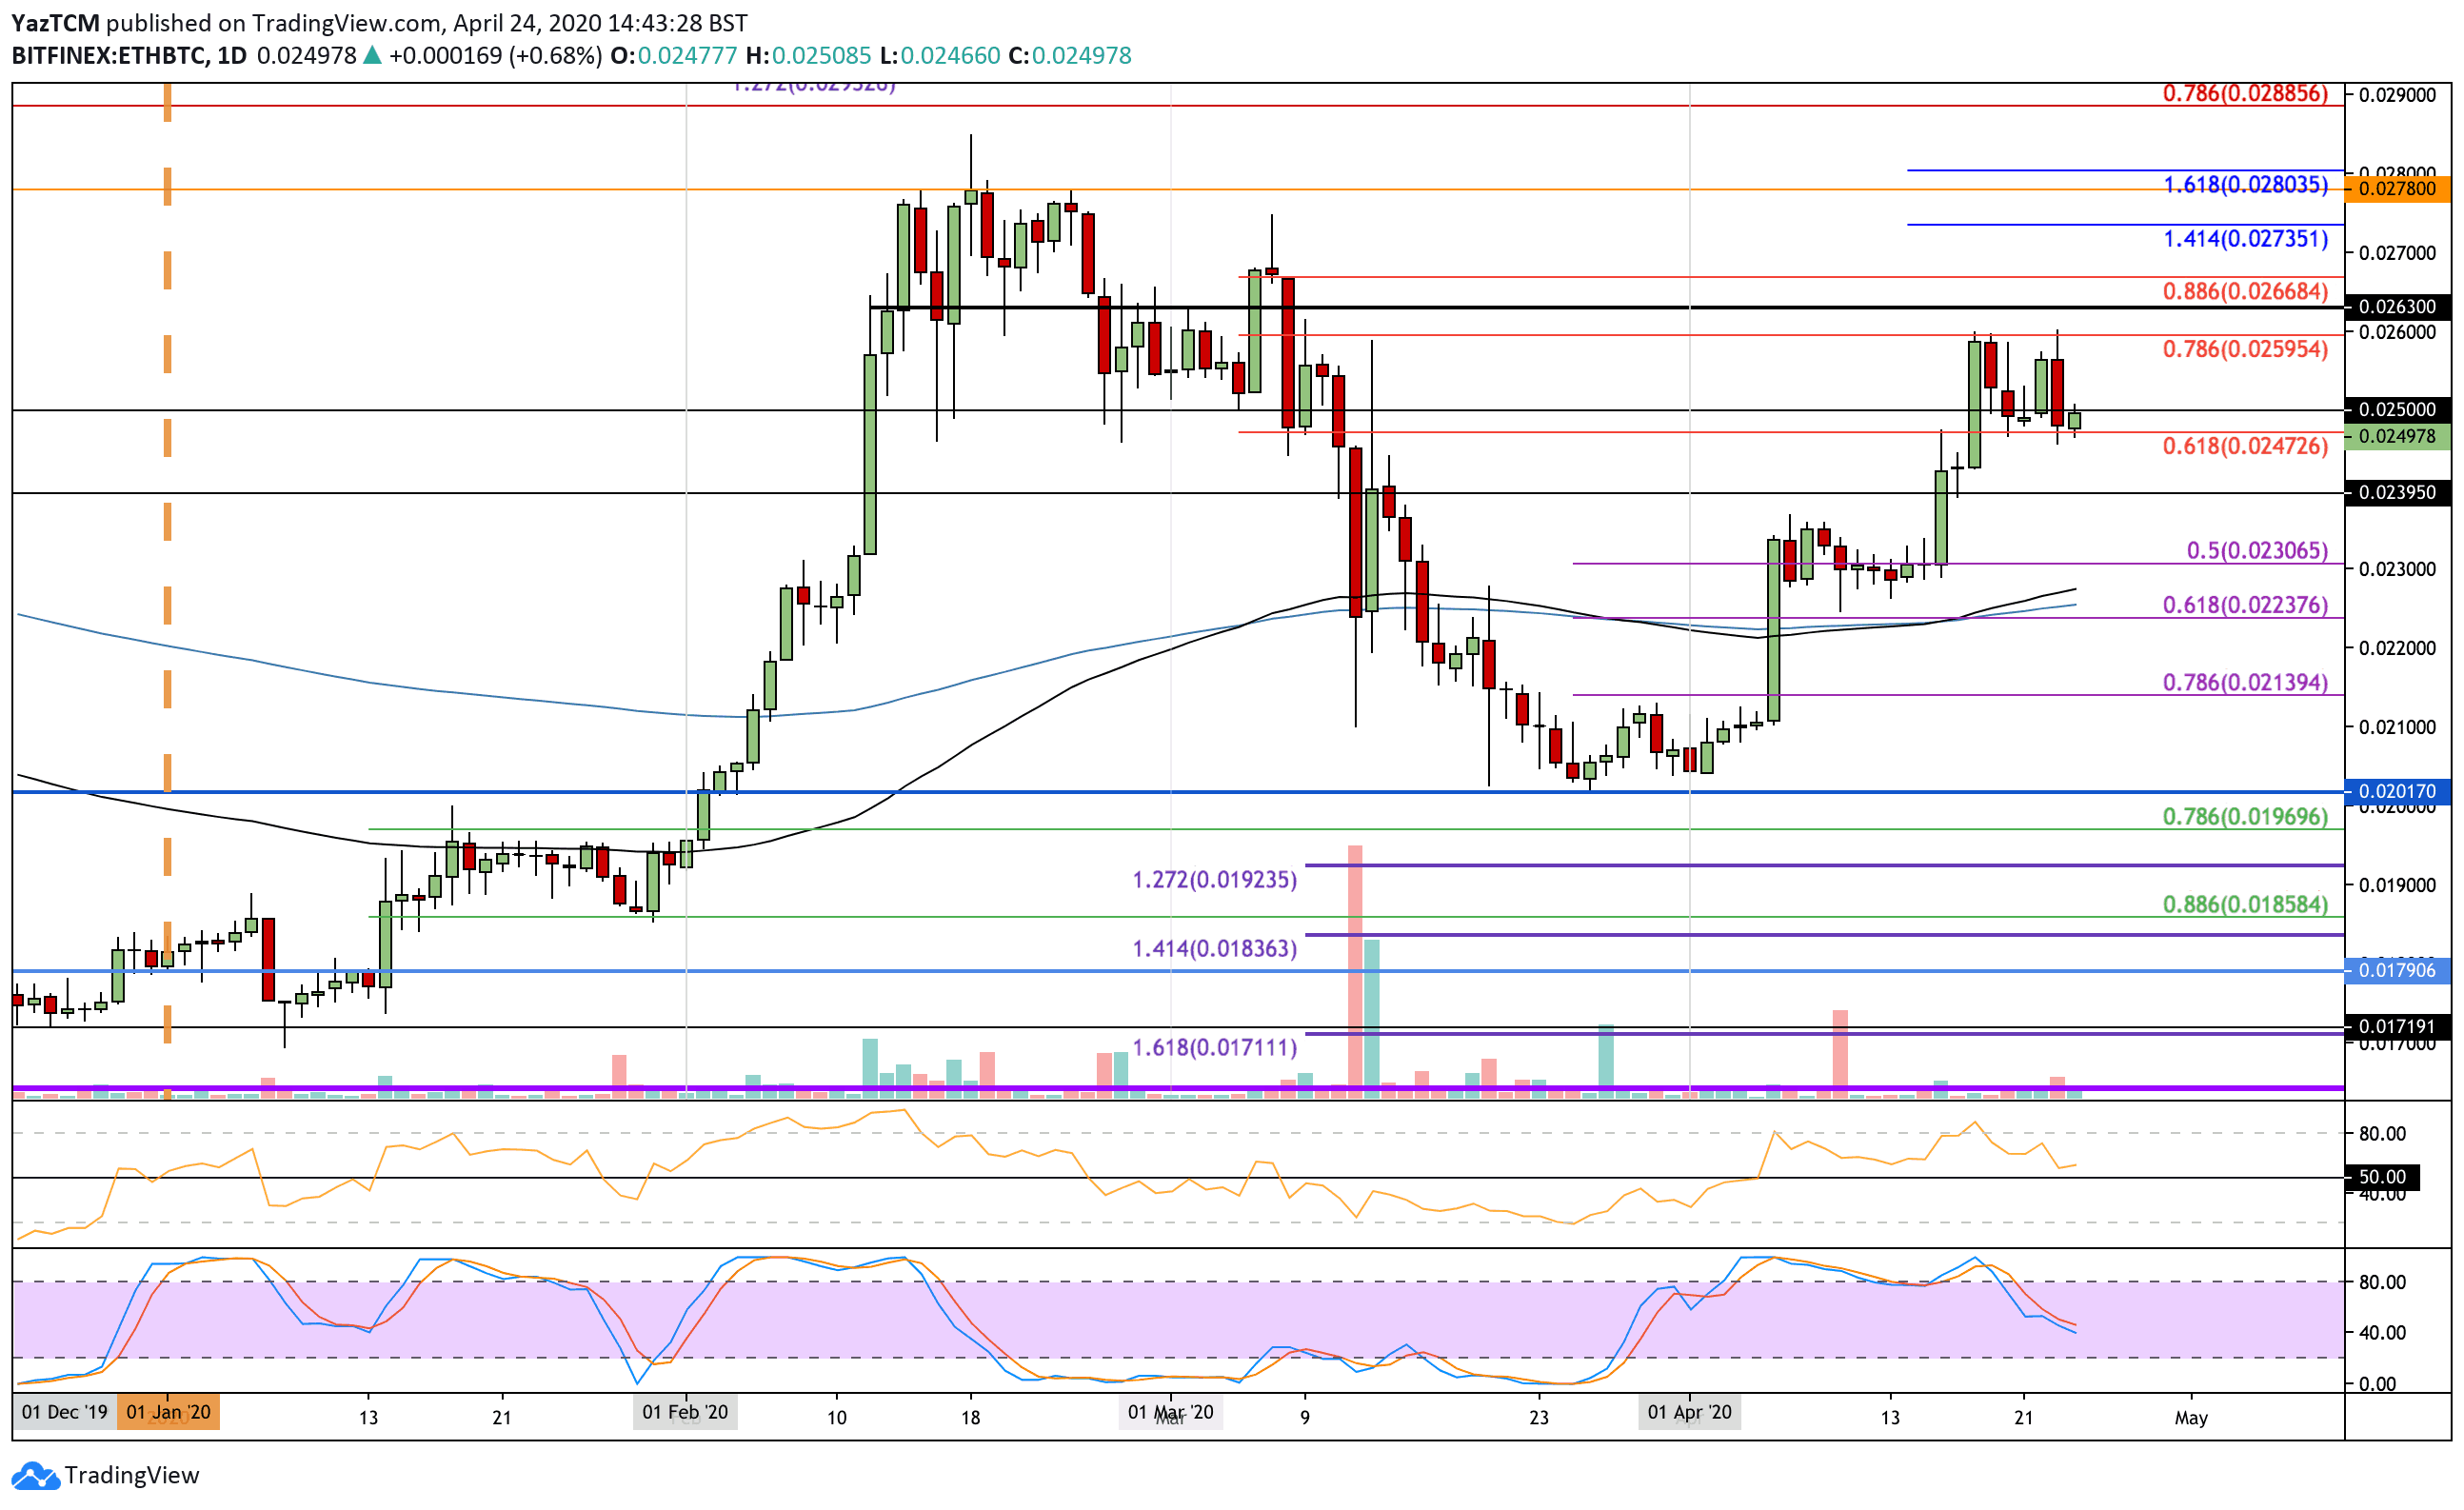
Against Bitcoin, Ethereum met resistance at the 0.026 BTC level last week, which caused it to drop into the 0.025 BTC level during the week. It attempted to rebound from here but was halted by 0.026 BTC again yesterday. The coin has since dropped into the support at 0.247 BTC.
If the sellers break 0.0247 BTC, the first level of support lies at 0.0239 BTC. Beneath this, support lies at 0.023 BTC (.5 Fib Retracement) and 0.0225 BTC (100-days EMA).
On the other side, if the bulls can break 0.025 BTC, resistance lies at 0.026 BTC (bearish .786 Fib Retracement), 0.0263 BTC, and 0.0266 BTC (bearish .886 Fib Retracement).
Ripple
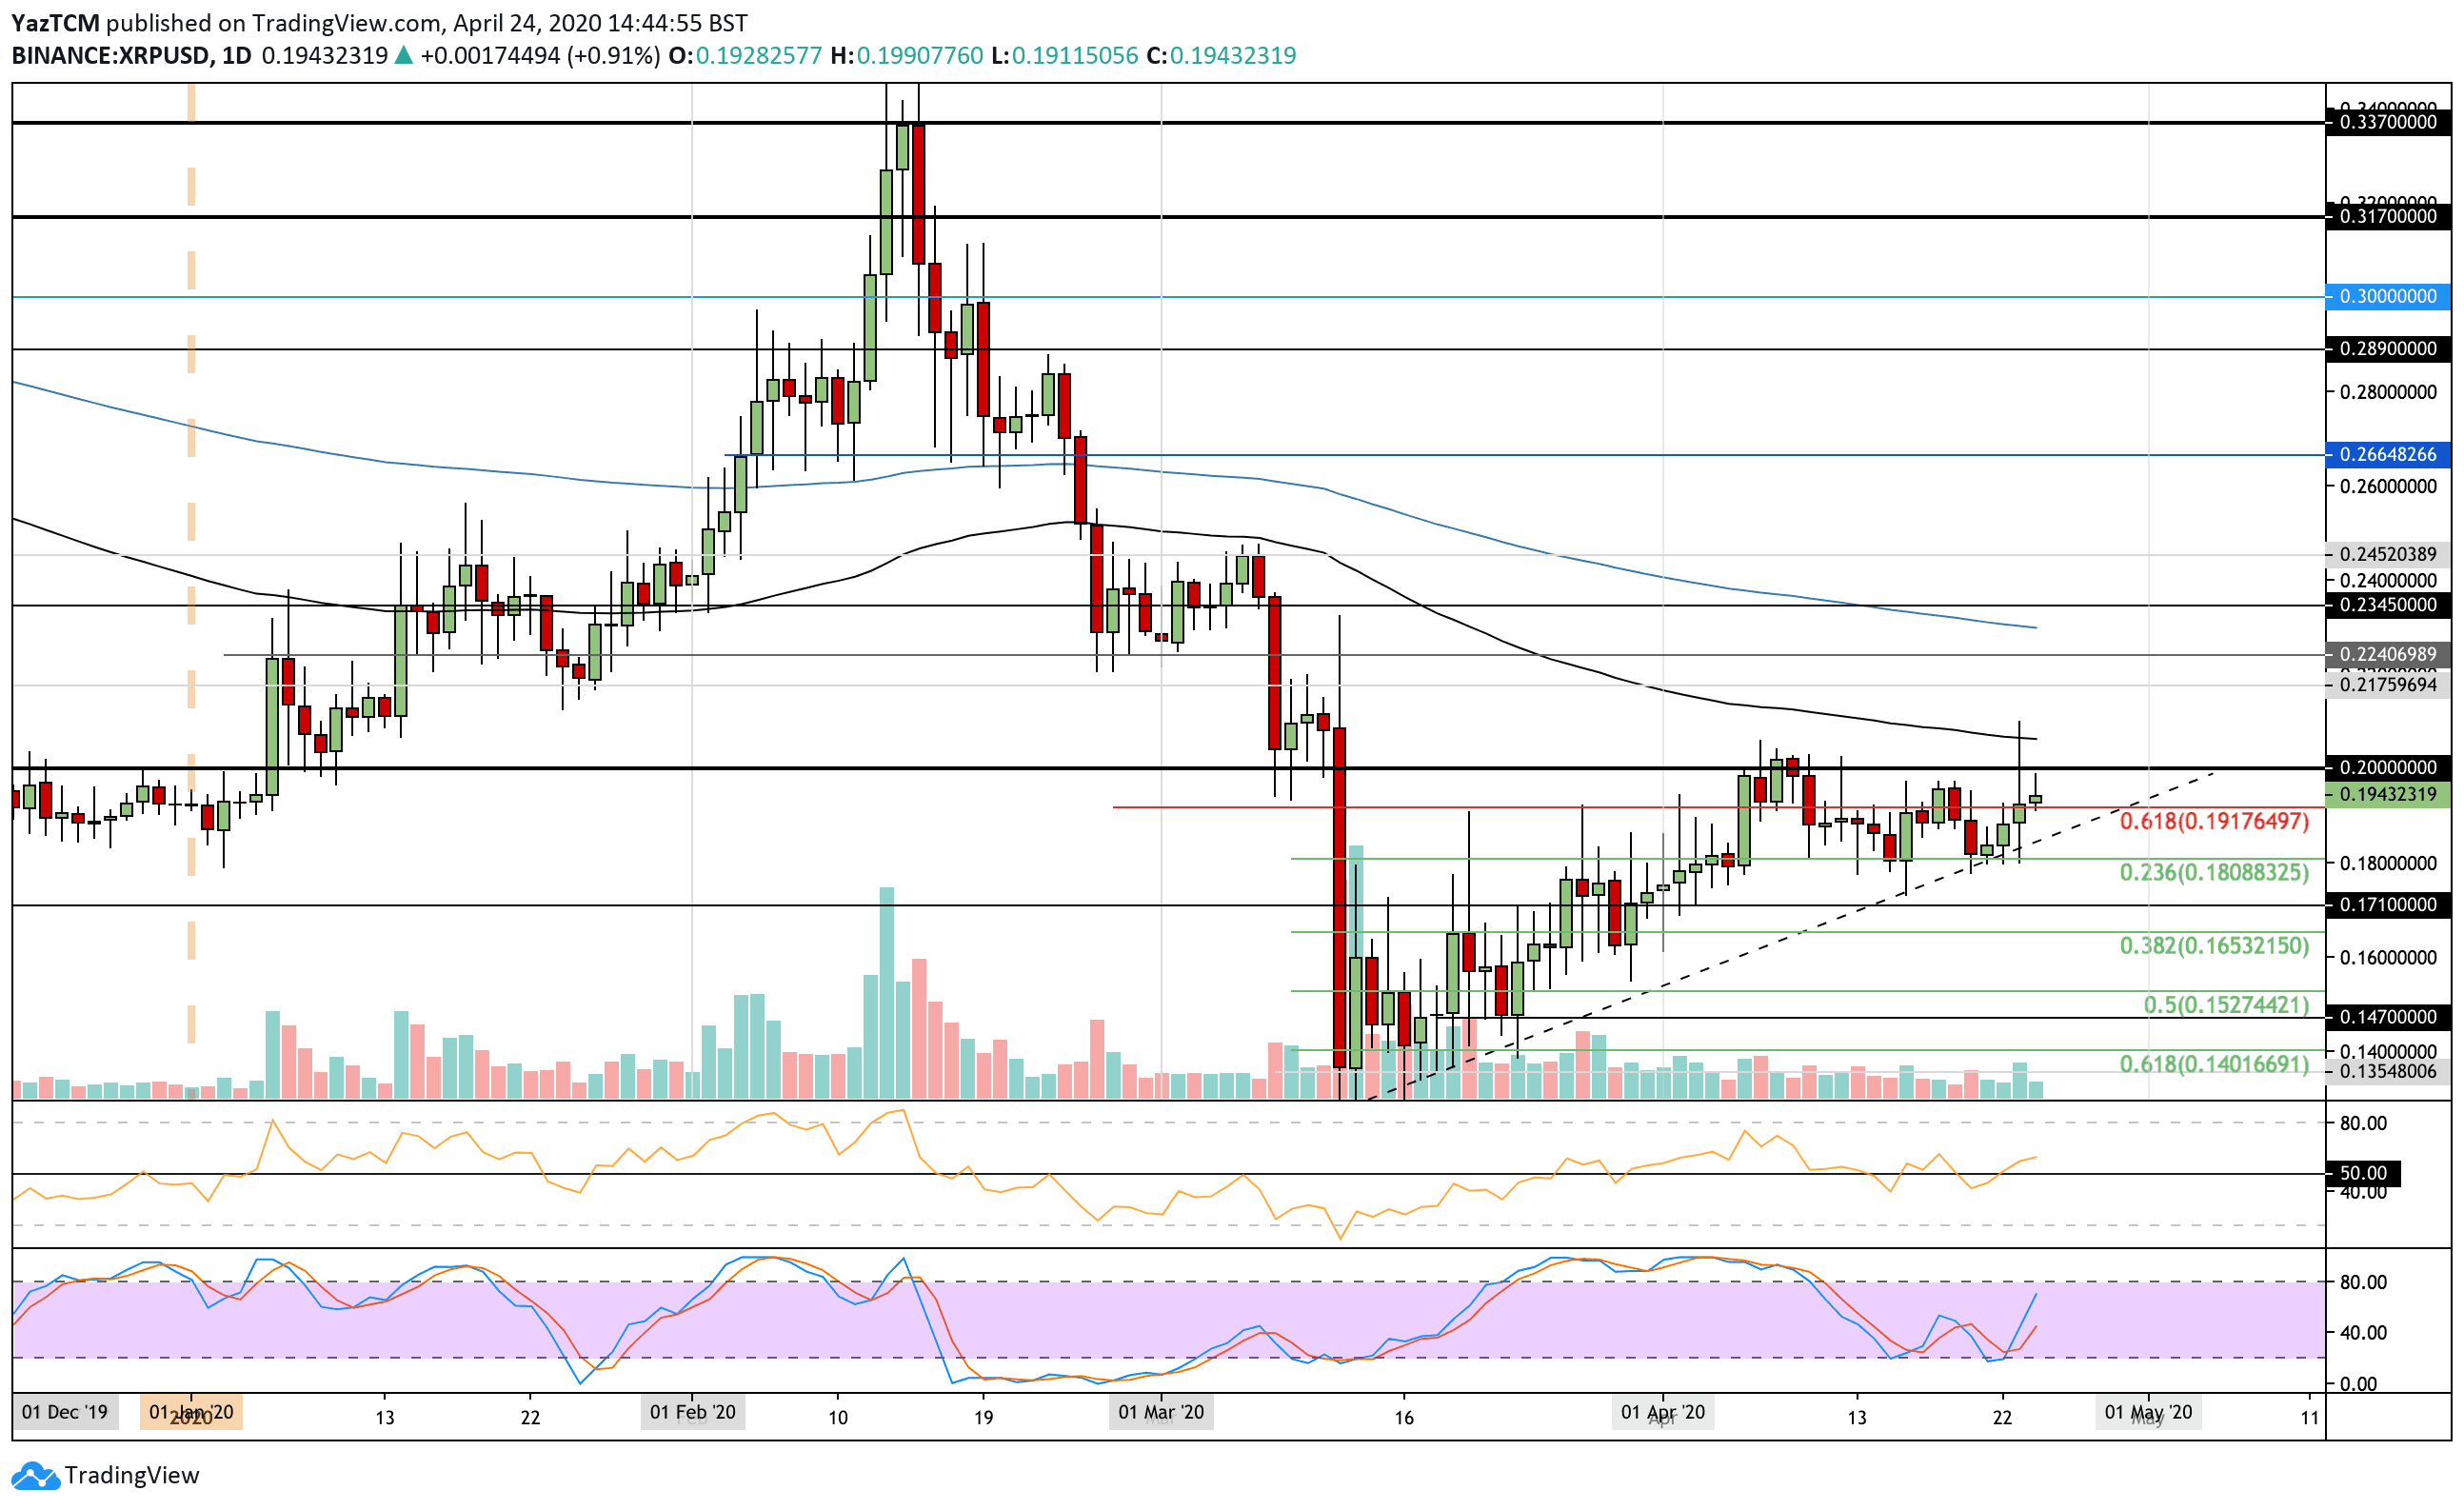
XRP saw a small 3% price increase this past week as it continues to remain trapped at the $0.20 resistance. It reached $0.0196 last Friday, which caused it to drop lower into support at $0.18 (short term .236 Fib Retracement & rising trend line).
XRP rebounded from here and started to climb higher as it breaks back above $0.19 to reach $0.195. XRP will need to cleanly break the $0.20 resistance for a bull run to be sparked.
Looking ahead, the first level of resistance is located at $0.20. Above this, resistance lies at $0.207 (100-days EMA), $0.217, and $0.224. Following this, added resistance lies at $0.23 (200-days EMA).
Toward the downside, support lies at $0.191, the rising trend line, and $0.18. Beneath this, added support lies at $0.171 and $0.165 (.382 Fib Retracement).
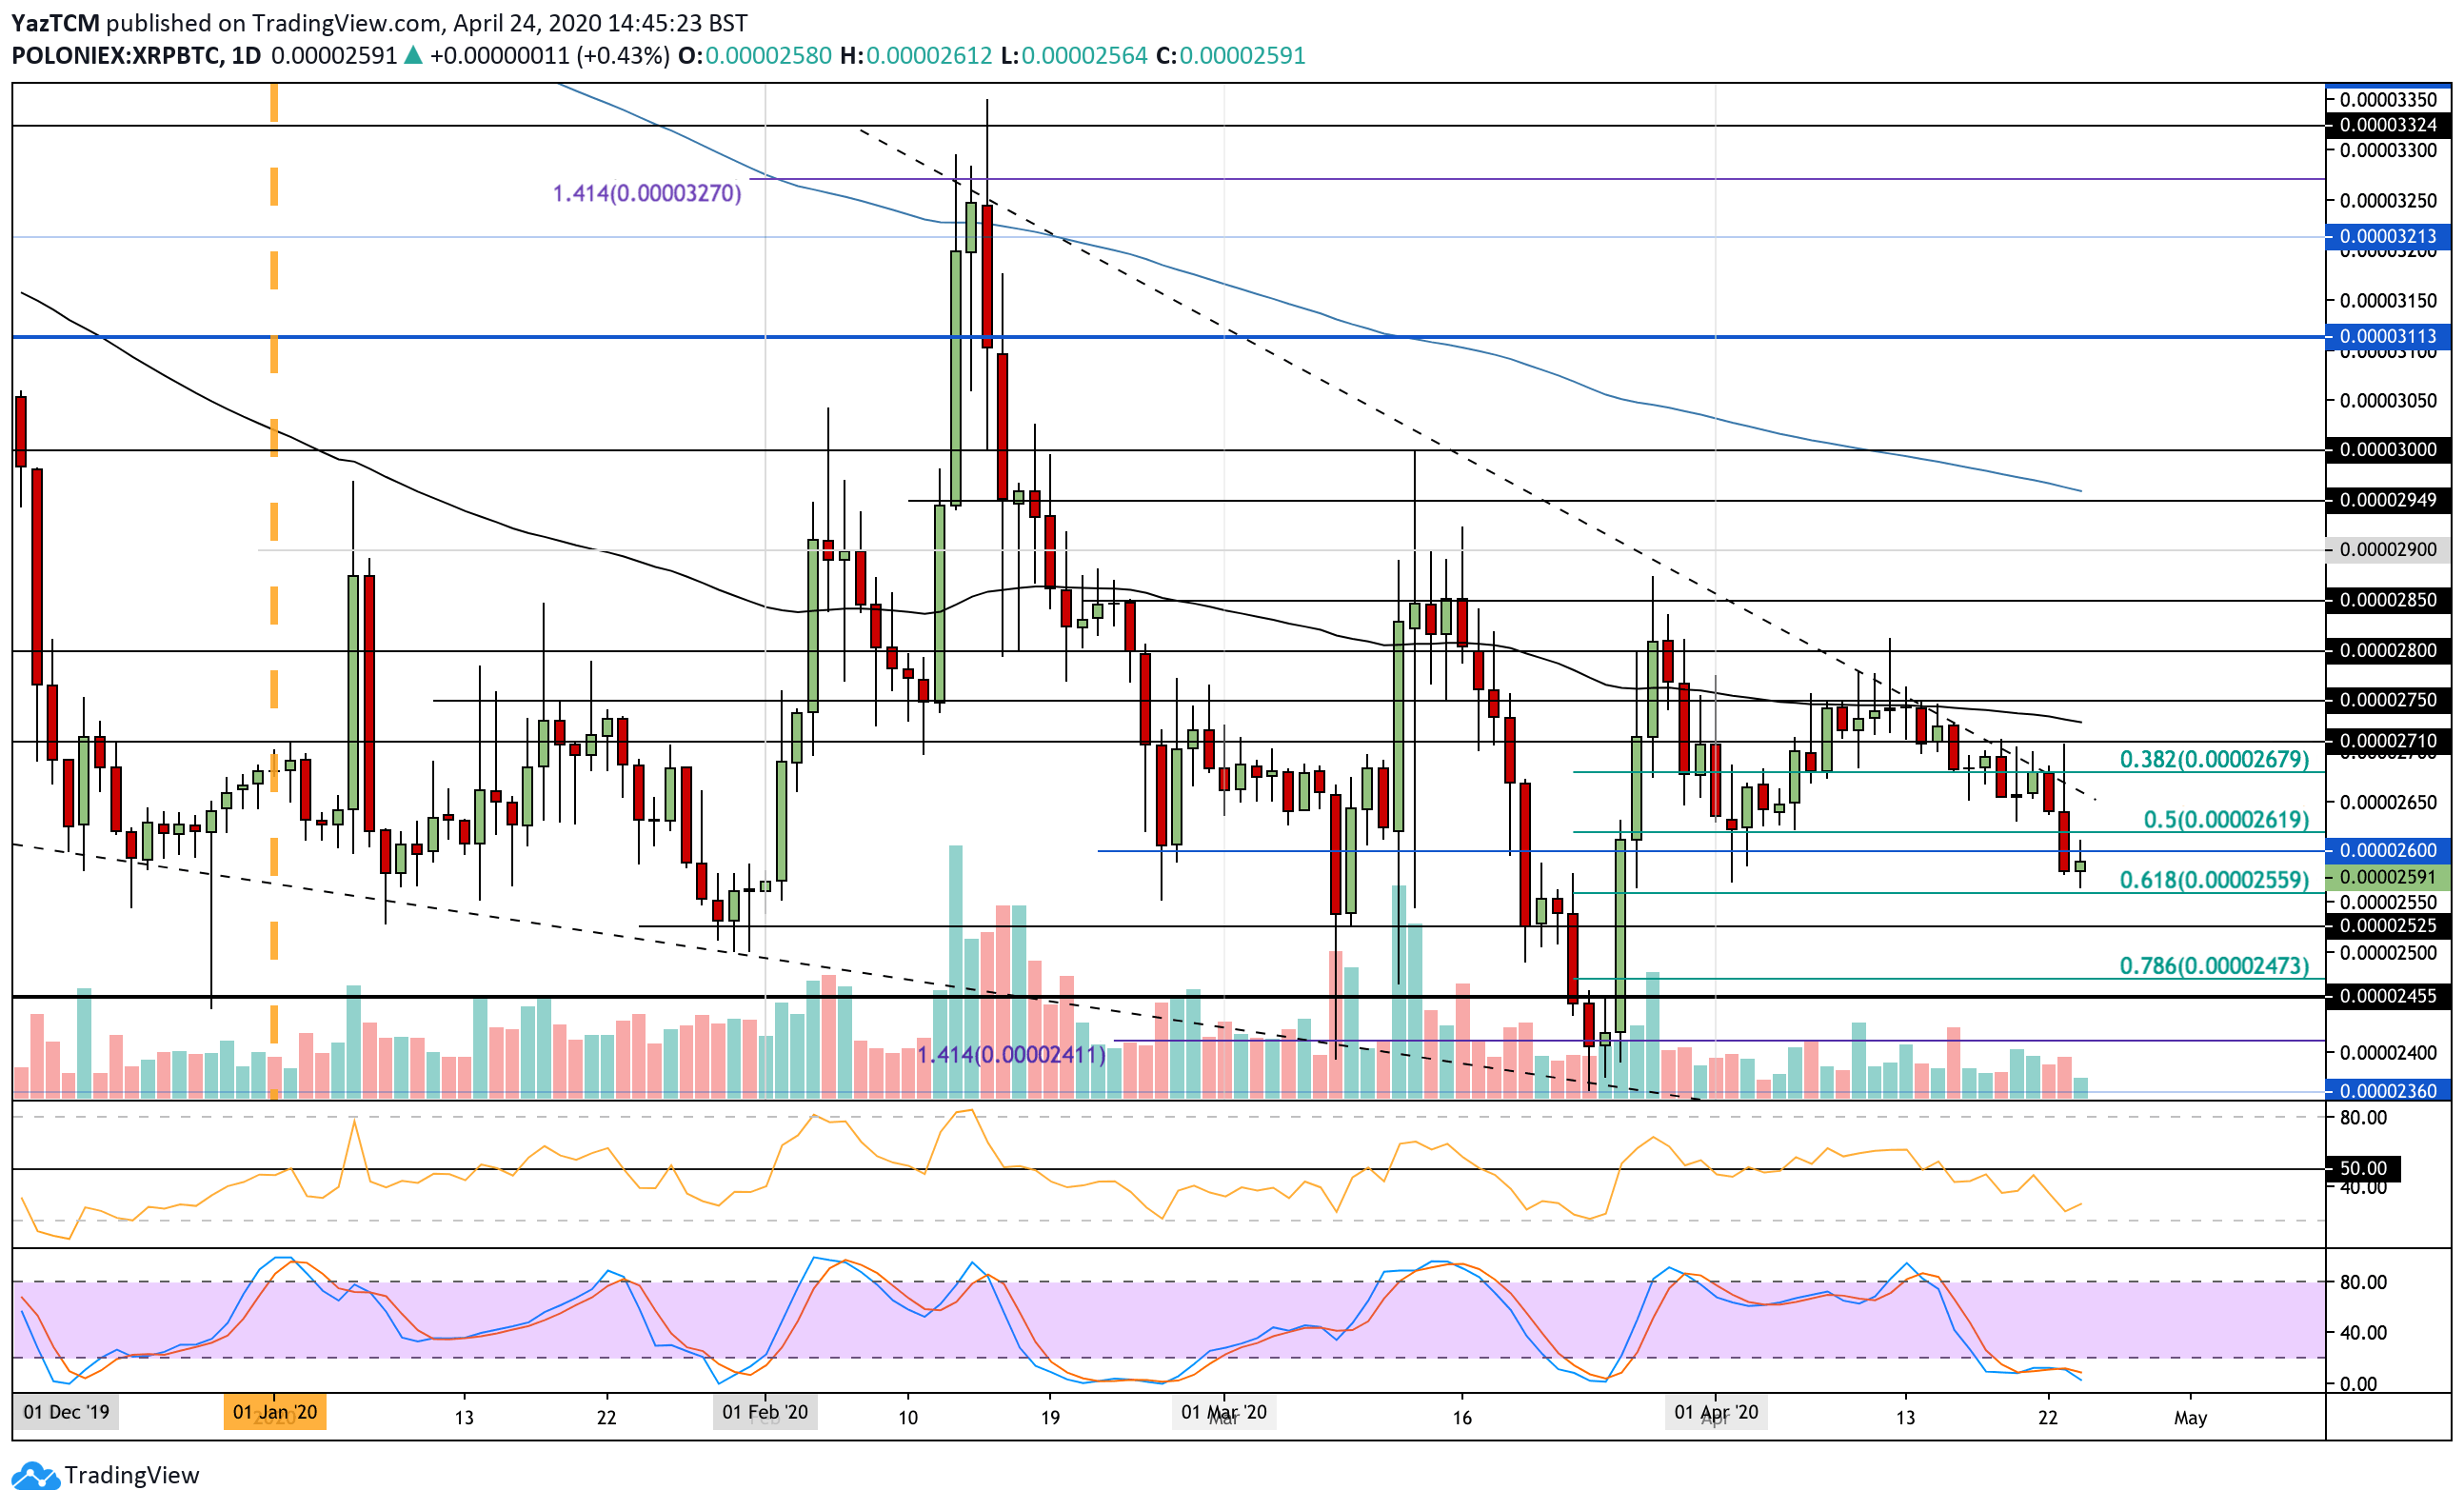
Against Bitcoin, XRP was trading at the 2710 SAT resistance last Friday as it continued to trade beneath a falling trend line. The coin made multiple attempts to break above this trend line this week but failed on each one.
In yesterday’s trading session, XRP fell further beneath this trend line as it broke the support at 2650 SAT and dropped as low as 2570 SAT.
Moving forward, if the sellers push lower, the first level of support lies at 2560 SAT (.618 Fib Retracement). Beneath this, support lies at 2525 SAT, 2500 SAT, and 2470 SAT (.786 Fib Retracement).
On the other hand, the first level of resistance lies at 2600 SAT. Above this, resistance lies at 2650 SAT, the falling trend line, and 2670 SAT. Added resistance is located at 2710 SAT and 2750 SAT.
Tezos
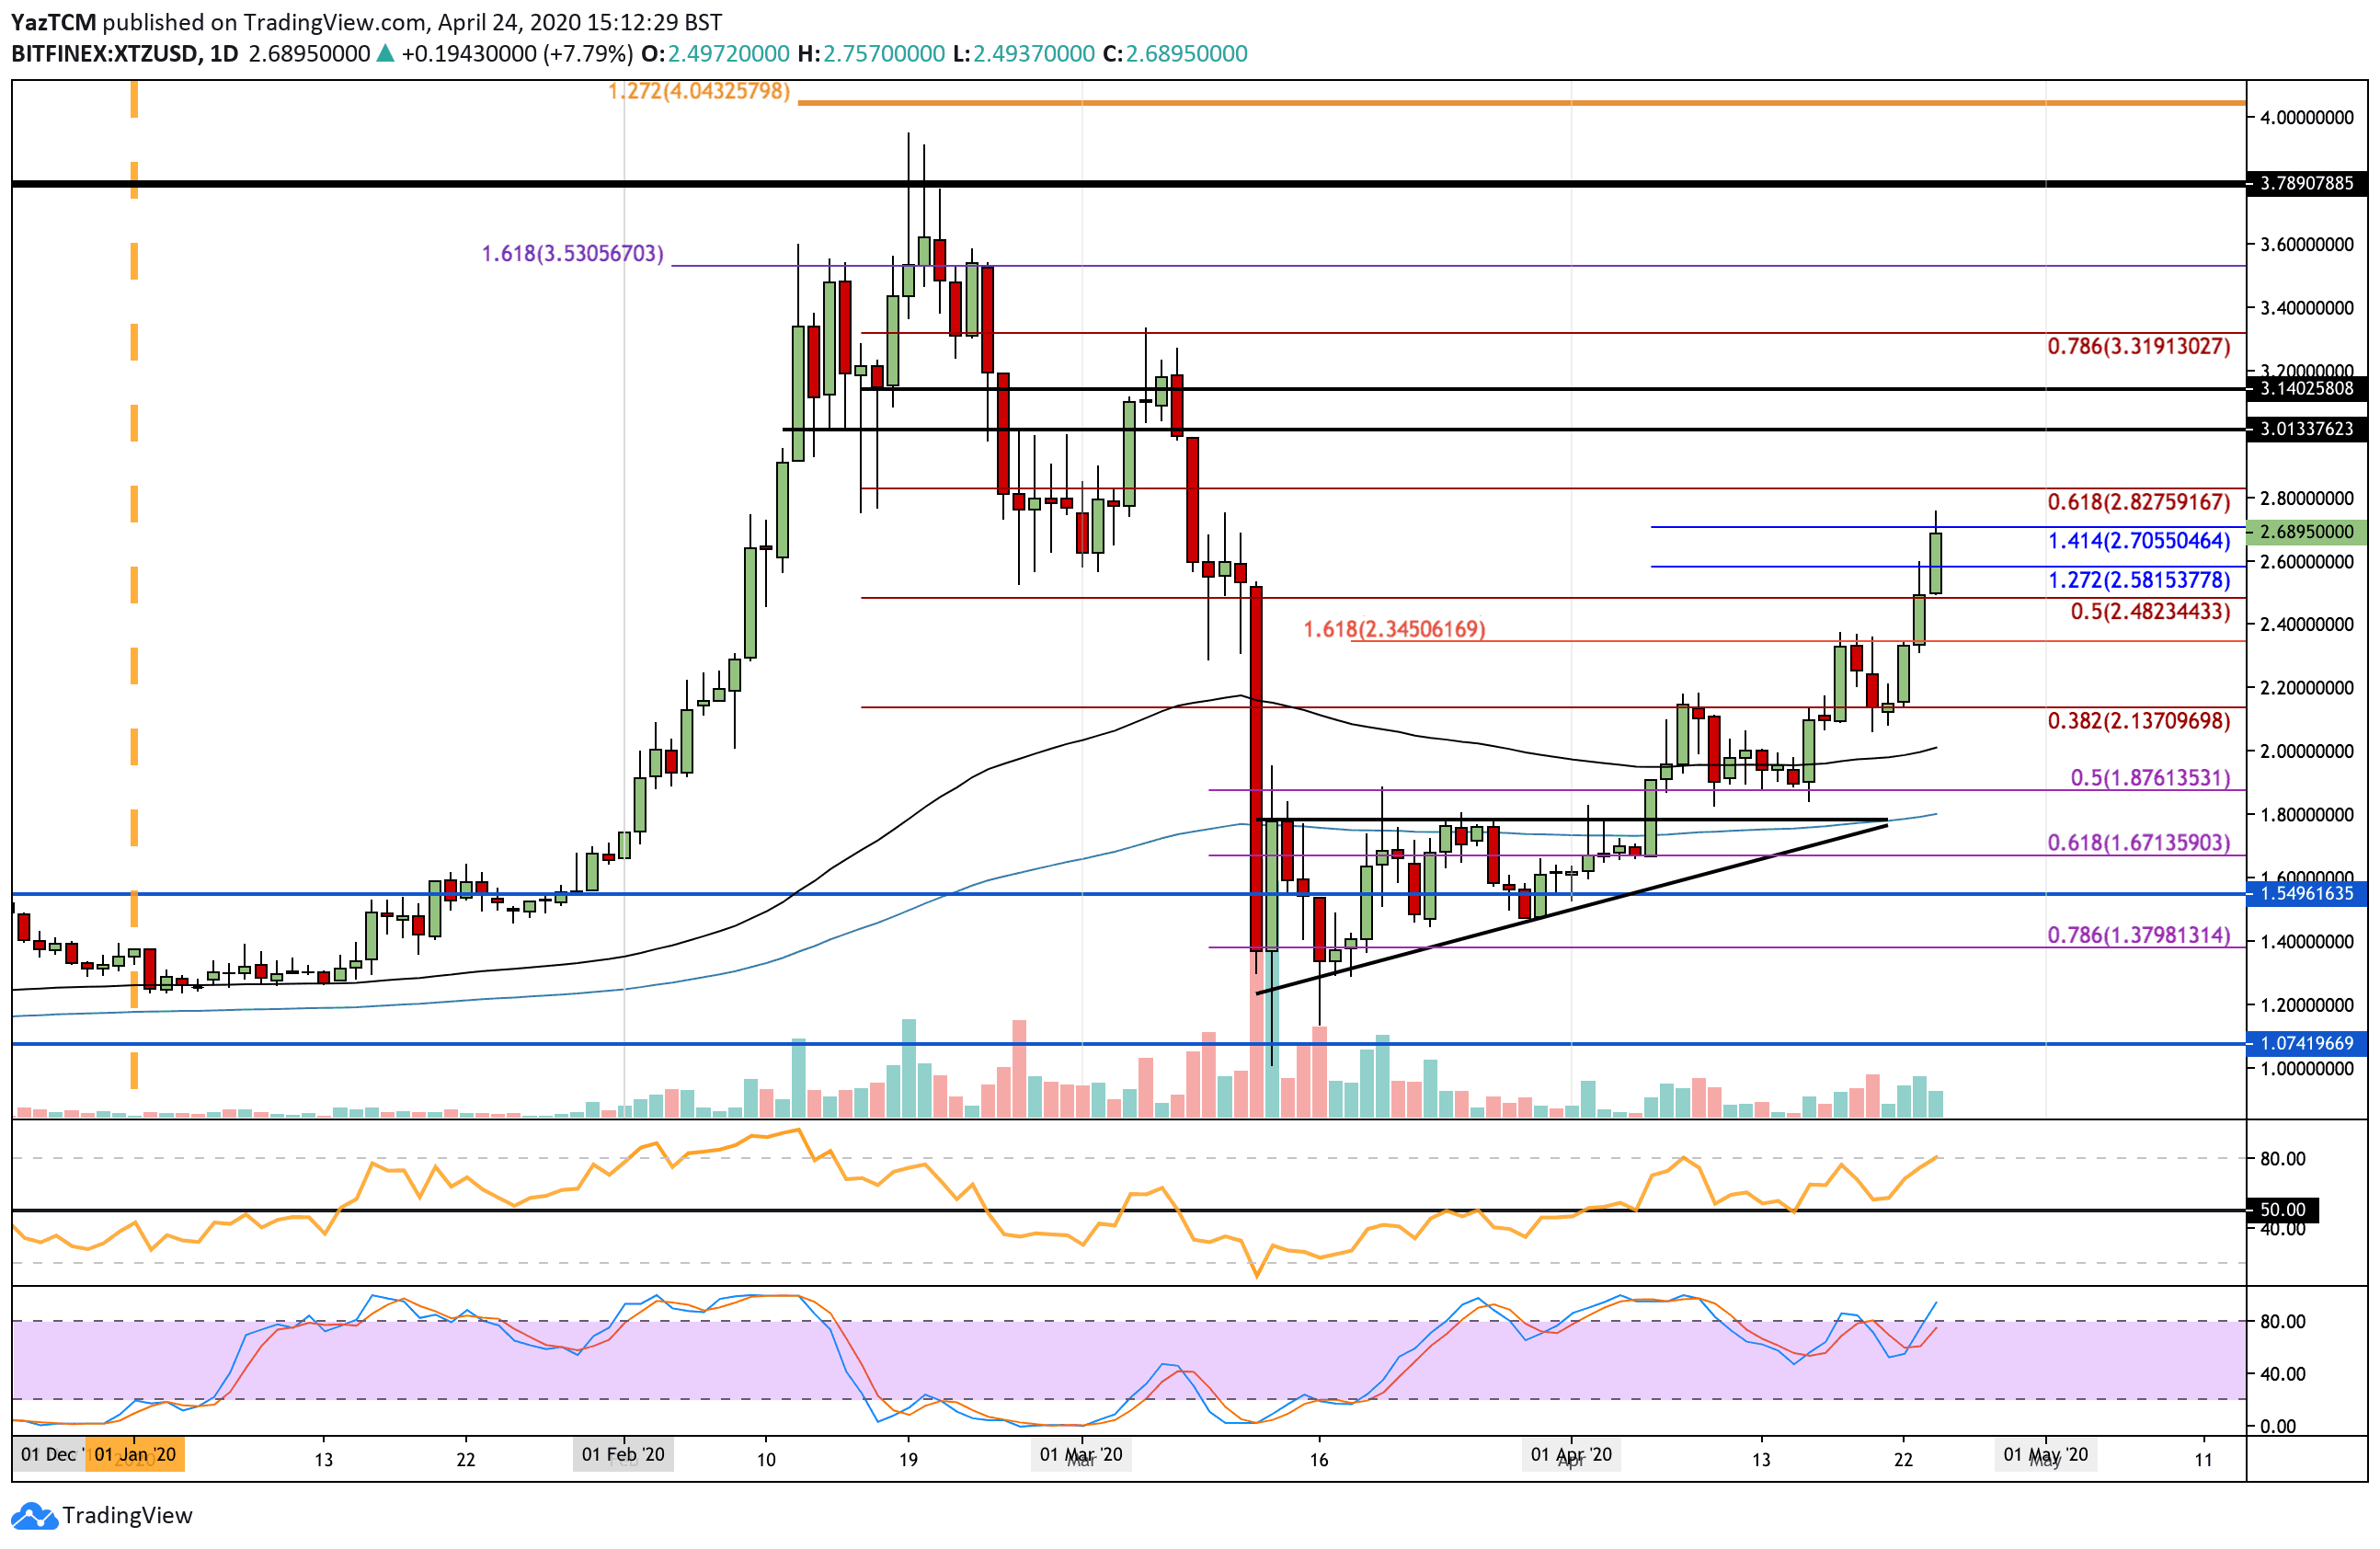
Tezos saw a very strong 27.5% price increase over the past 7-days of trading as the cryptocurrency surges to reach $2.70.
The coin began the week by meeting resistance at $2.34, which caused it trouble as it rolled over to reach $2.10. From here, the coin rebounded and went on to break the aforementioned resistance and continued to surge. It broke above $2.50 to reach the current resistance level at $2.70, provided by a 1.414 Fib Extension.
Looking ahead, if the buyers break $2.70, the first level of resistance lies at $2.82 (bearish .618 Fib Retracement). Above this, resistance is located at $3.00, $3.14, and $3.31 (bearish .786 Fib Retracement & March 2020 high).
Toward the downside, the first level of support lies at $2.58. Beneath this, support lies at $2.50, $2.34, $2.20, and $2.00 (100-days EMA).
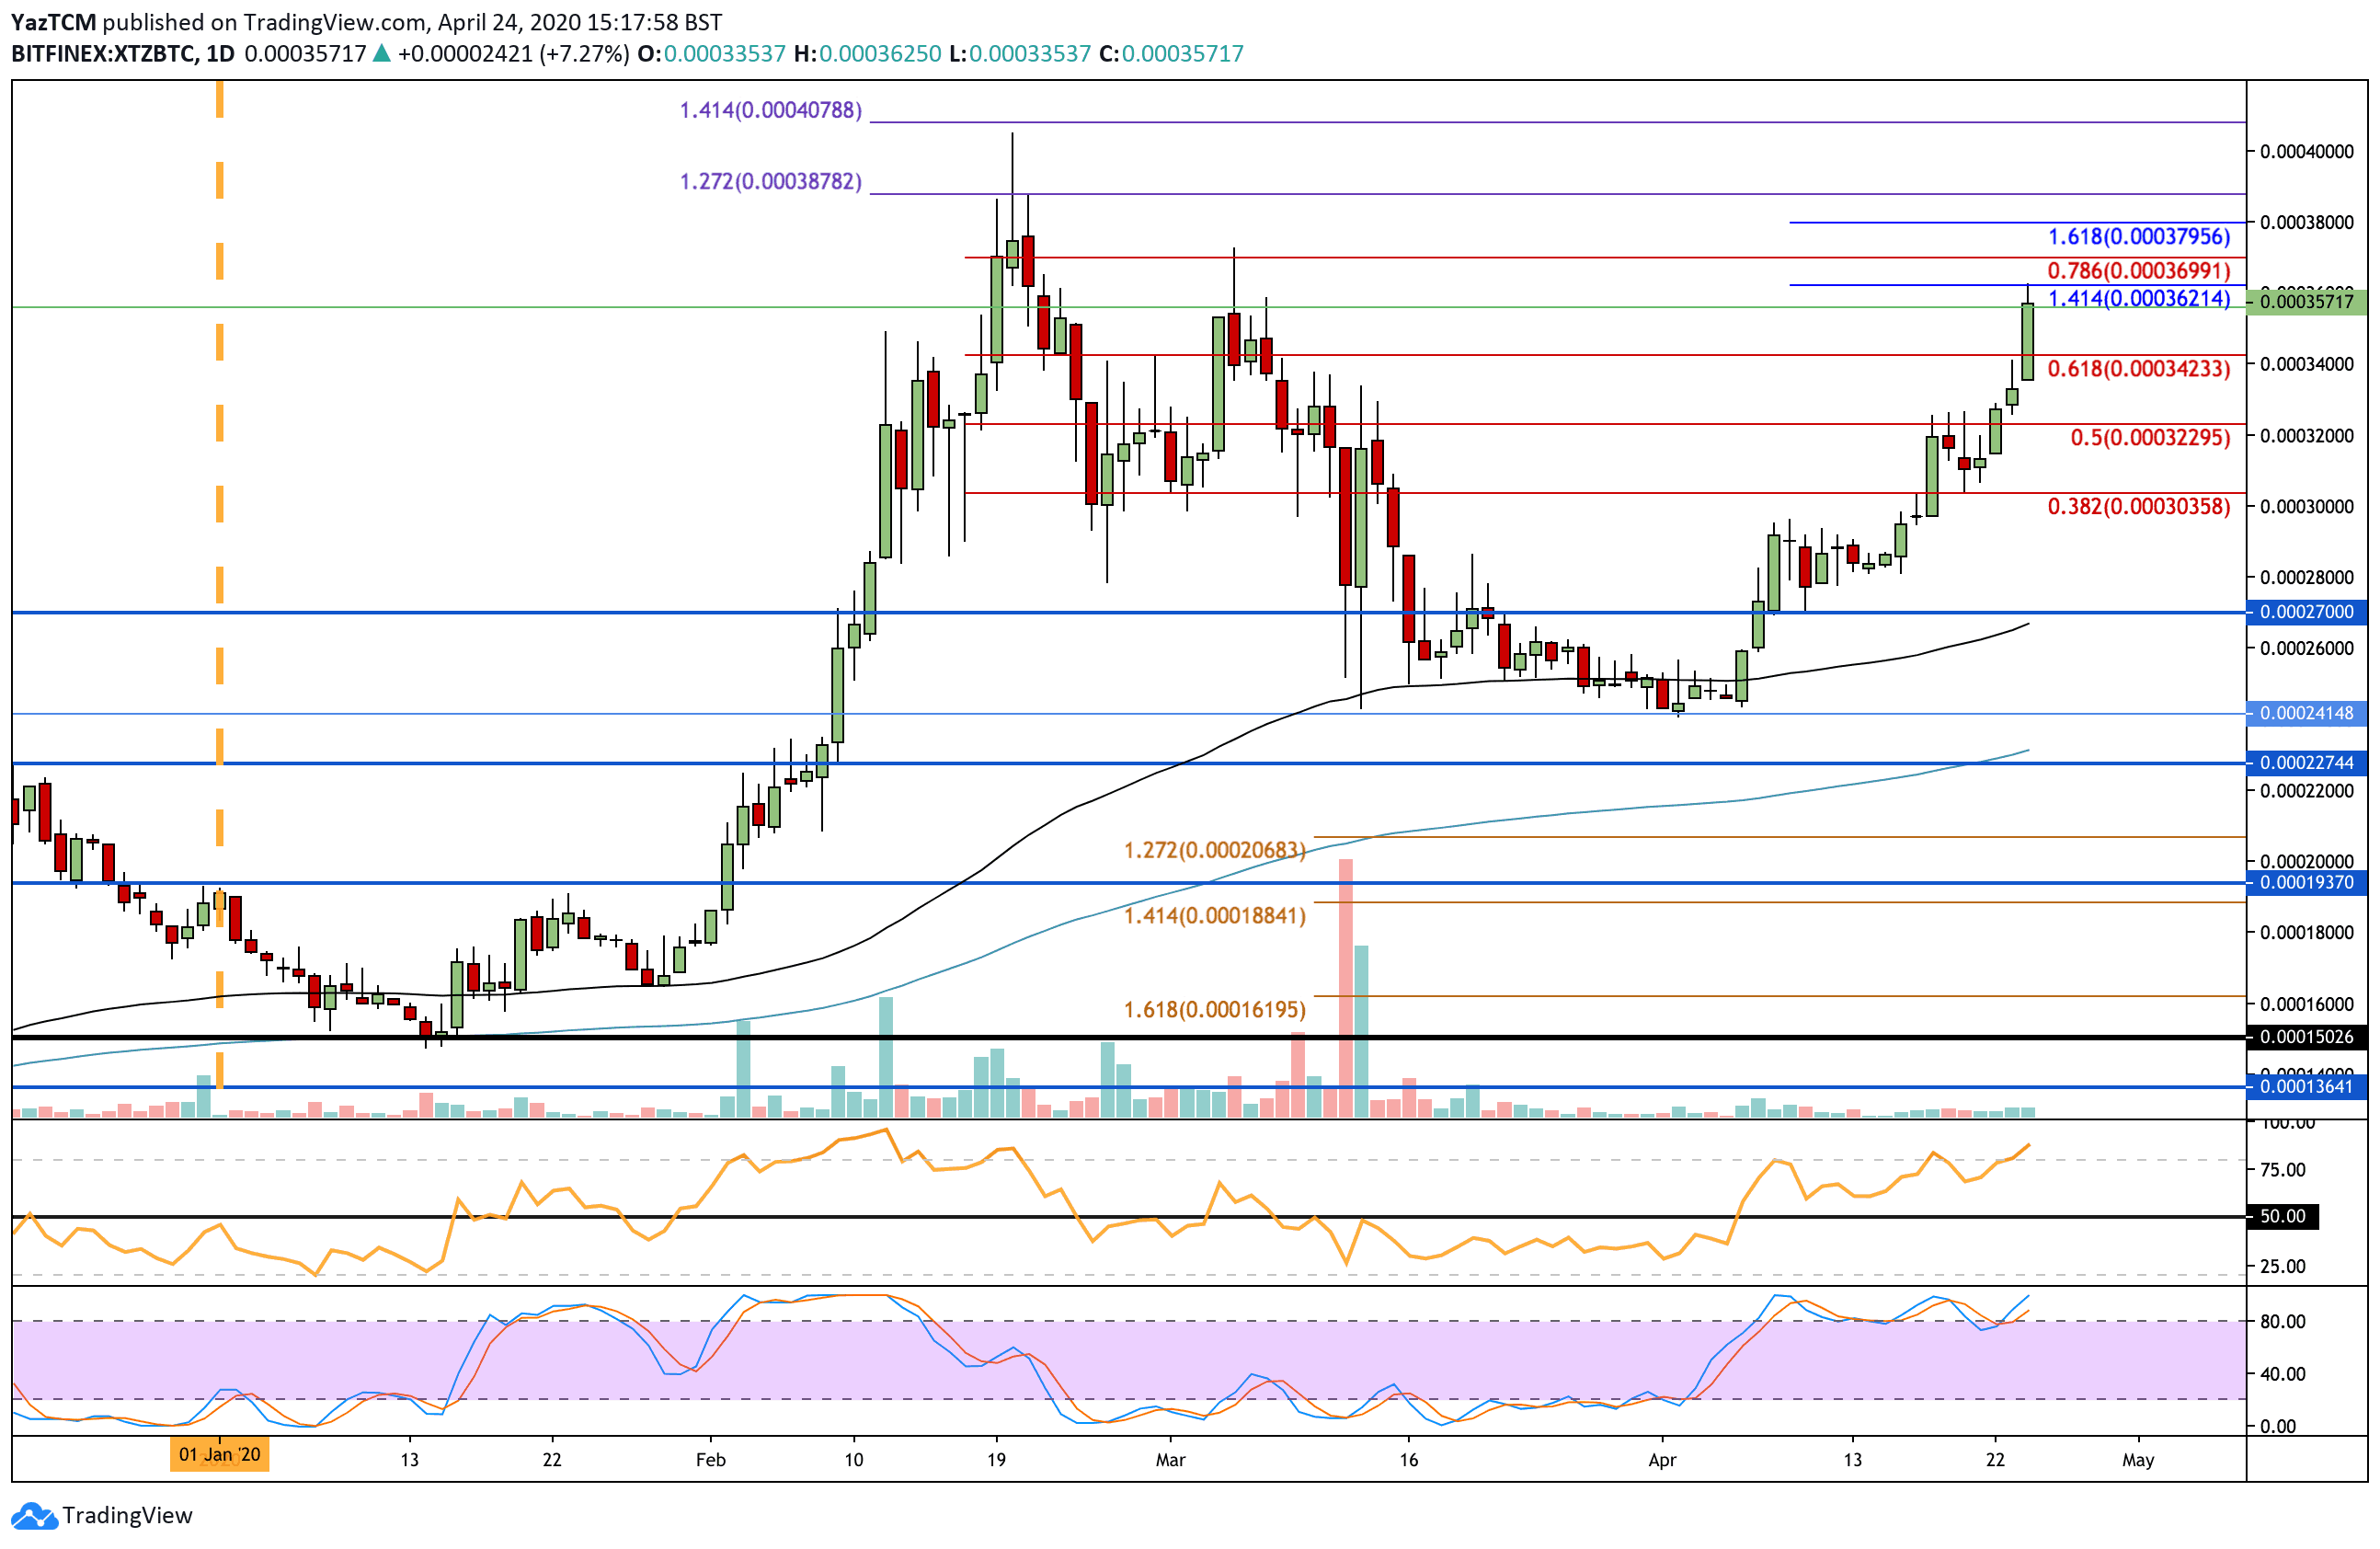
Against Bitcoin, Tezos also went on a rampage this week as it reaches a high of 0.000362 BTC, which is resistance provided by 1.414 FIb Extension level. It started the week by rebounding from the support at 0.0003 BTC as it went on to break resistance at 0.00032 BTC and 0.00034 BTC.
If the bulls continue to drive above 0.000362 BTC, resistance is expected at 0.00037 BTC (bearish .786 Fib Retracement). Above this, resistance lies at 0.00038 BTC (1.618 Fib Extension), 0.000387 BTC, and 0.0004 BTC.
On the other side, support lies at 0.00034 BTC, 0.00032 BTC, and 0.0003 BTC.
Cardano
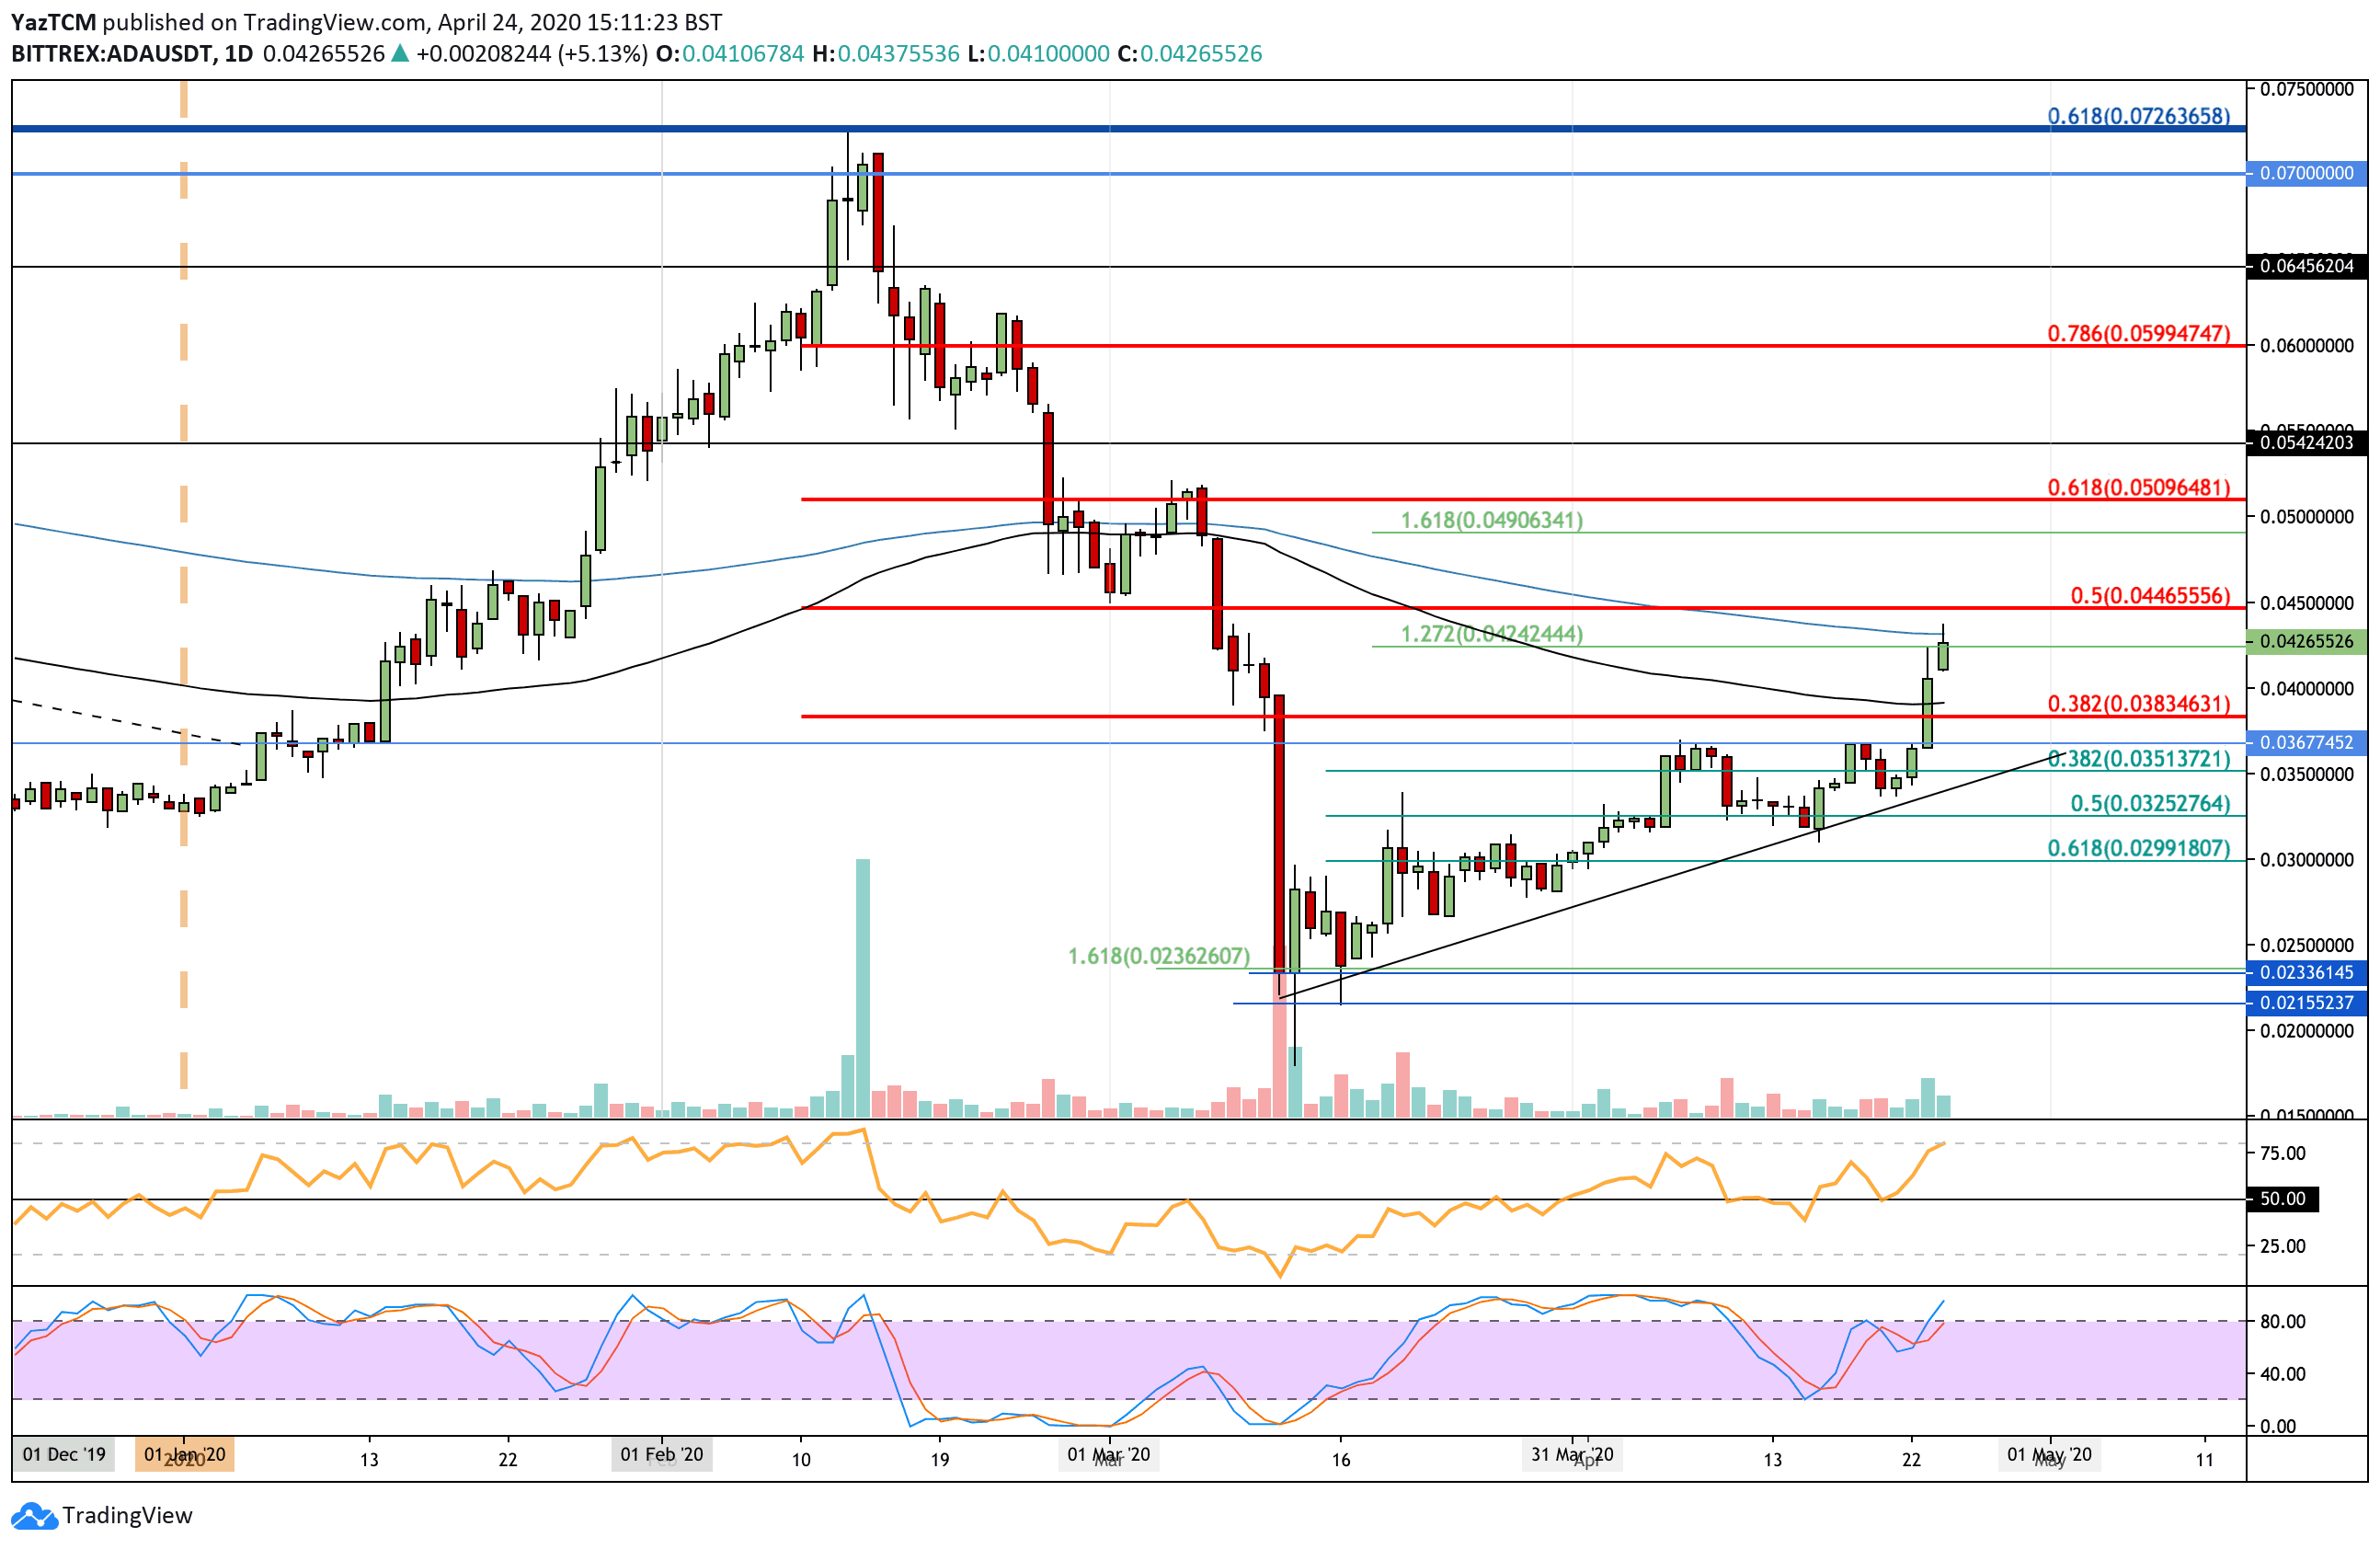
Cardano also witnessed a fantastic price surge this week as it increased by 24% to reach the 200-days EMA at around $0.042. The coin started the week by breaking above the $0.035 level and continued higher to break the previous April high at $0.0367.
It went on to break resistance at $0.038 (bearish .382 Fib Retracement) to reach the 200-days EMA where it currently trades.
Looking ahead, once the bulls break the 200-days EMA, resistance is located at $0.0446 (bearish .5 Fib Retracement). Above this, resistance lies at $0.047, $0.049 (1.618 FIb Extension), and $0.05 (bearish .618 Fib Retracement).
If the sellers push lower, support can be expected at $0.04, $0.0383 (100-days EMA), and $0.0367. Beneath this, additional support lies at $0.035.
Cardano has also been surging against Bitcoin. The cryptocurrency began the week trading at 500 SAT as it started to climb higher. It broke above the 100-days EMA and resistance at the 200-days EMA at around 550 SAT to reach the current trading level at 570 SAT.
It spiked higher today to break above the March 2020 high of 573 SAT as it reached the 585 SAT level.
Looking ahead, if the buyers continue above 570 SAT, resistance is located at 580 SAT and 600 SAT (bearish .618 Fib retracement). Above this, resistance lies at 620 SAT (1.414 Fib Extension) and 640 SAT (bearish .786 Fib Retracement).
Alternatively, if the sellers push lower, support lies at 550 SAT (200-days EMA), 535 SAT, and 520 SAT. This is followed by support at 510 SAT (100-days EMA) and 500 SAT.

The post Crypto Price Analysis & Overview April 24th: Bitcoin, Ethereum, Ripple, Tezos, and Cardano appeared first on CryptoPotato.
The post appeared first on CryptoPotato


