Bitcoin
Bitcoin saw a 5% price rise over the past 7 days of trading as the cryptocurrency rebounds from support at $9,145 to meet resistance at around $9,815. With the 30-day 21% bullish surge, Bitcoin can be expected to break $10,000 pretty soon. Other cryptocurrencies are outpacing Bitcoin. However, this does not mean it cannot continue above $10,000.
Once the bulls break $9,815, the next level of resistance lies at $10,000. Beyond this, higher resistance lies at $10,200, $10,430, and $10,707 (1.414 Fib Extension). On the other side, if the sellers push BTC lower, support can be found at $9,480, $9,145, and $9,000.
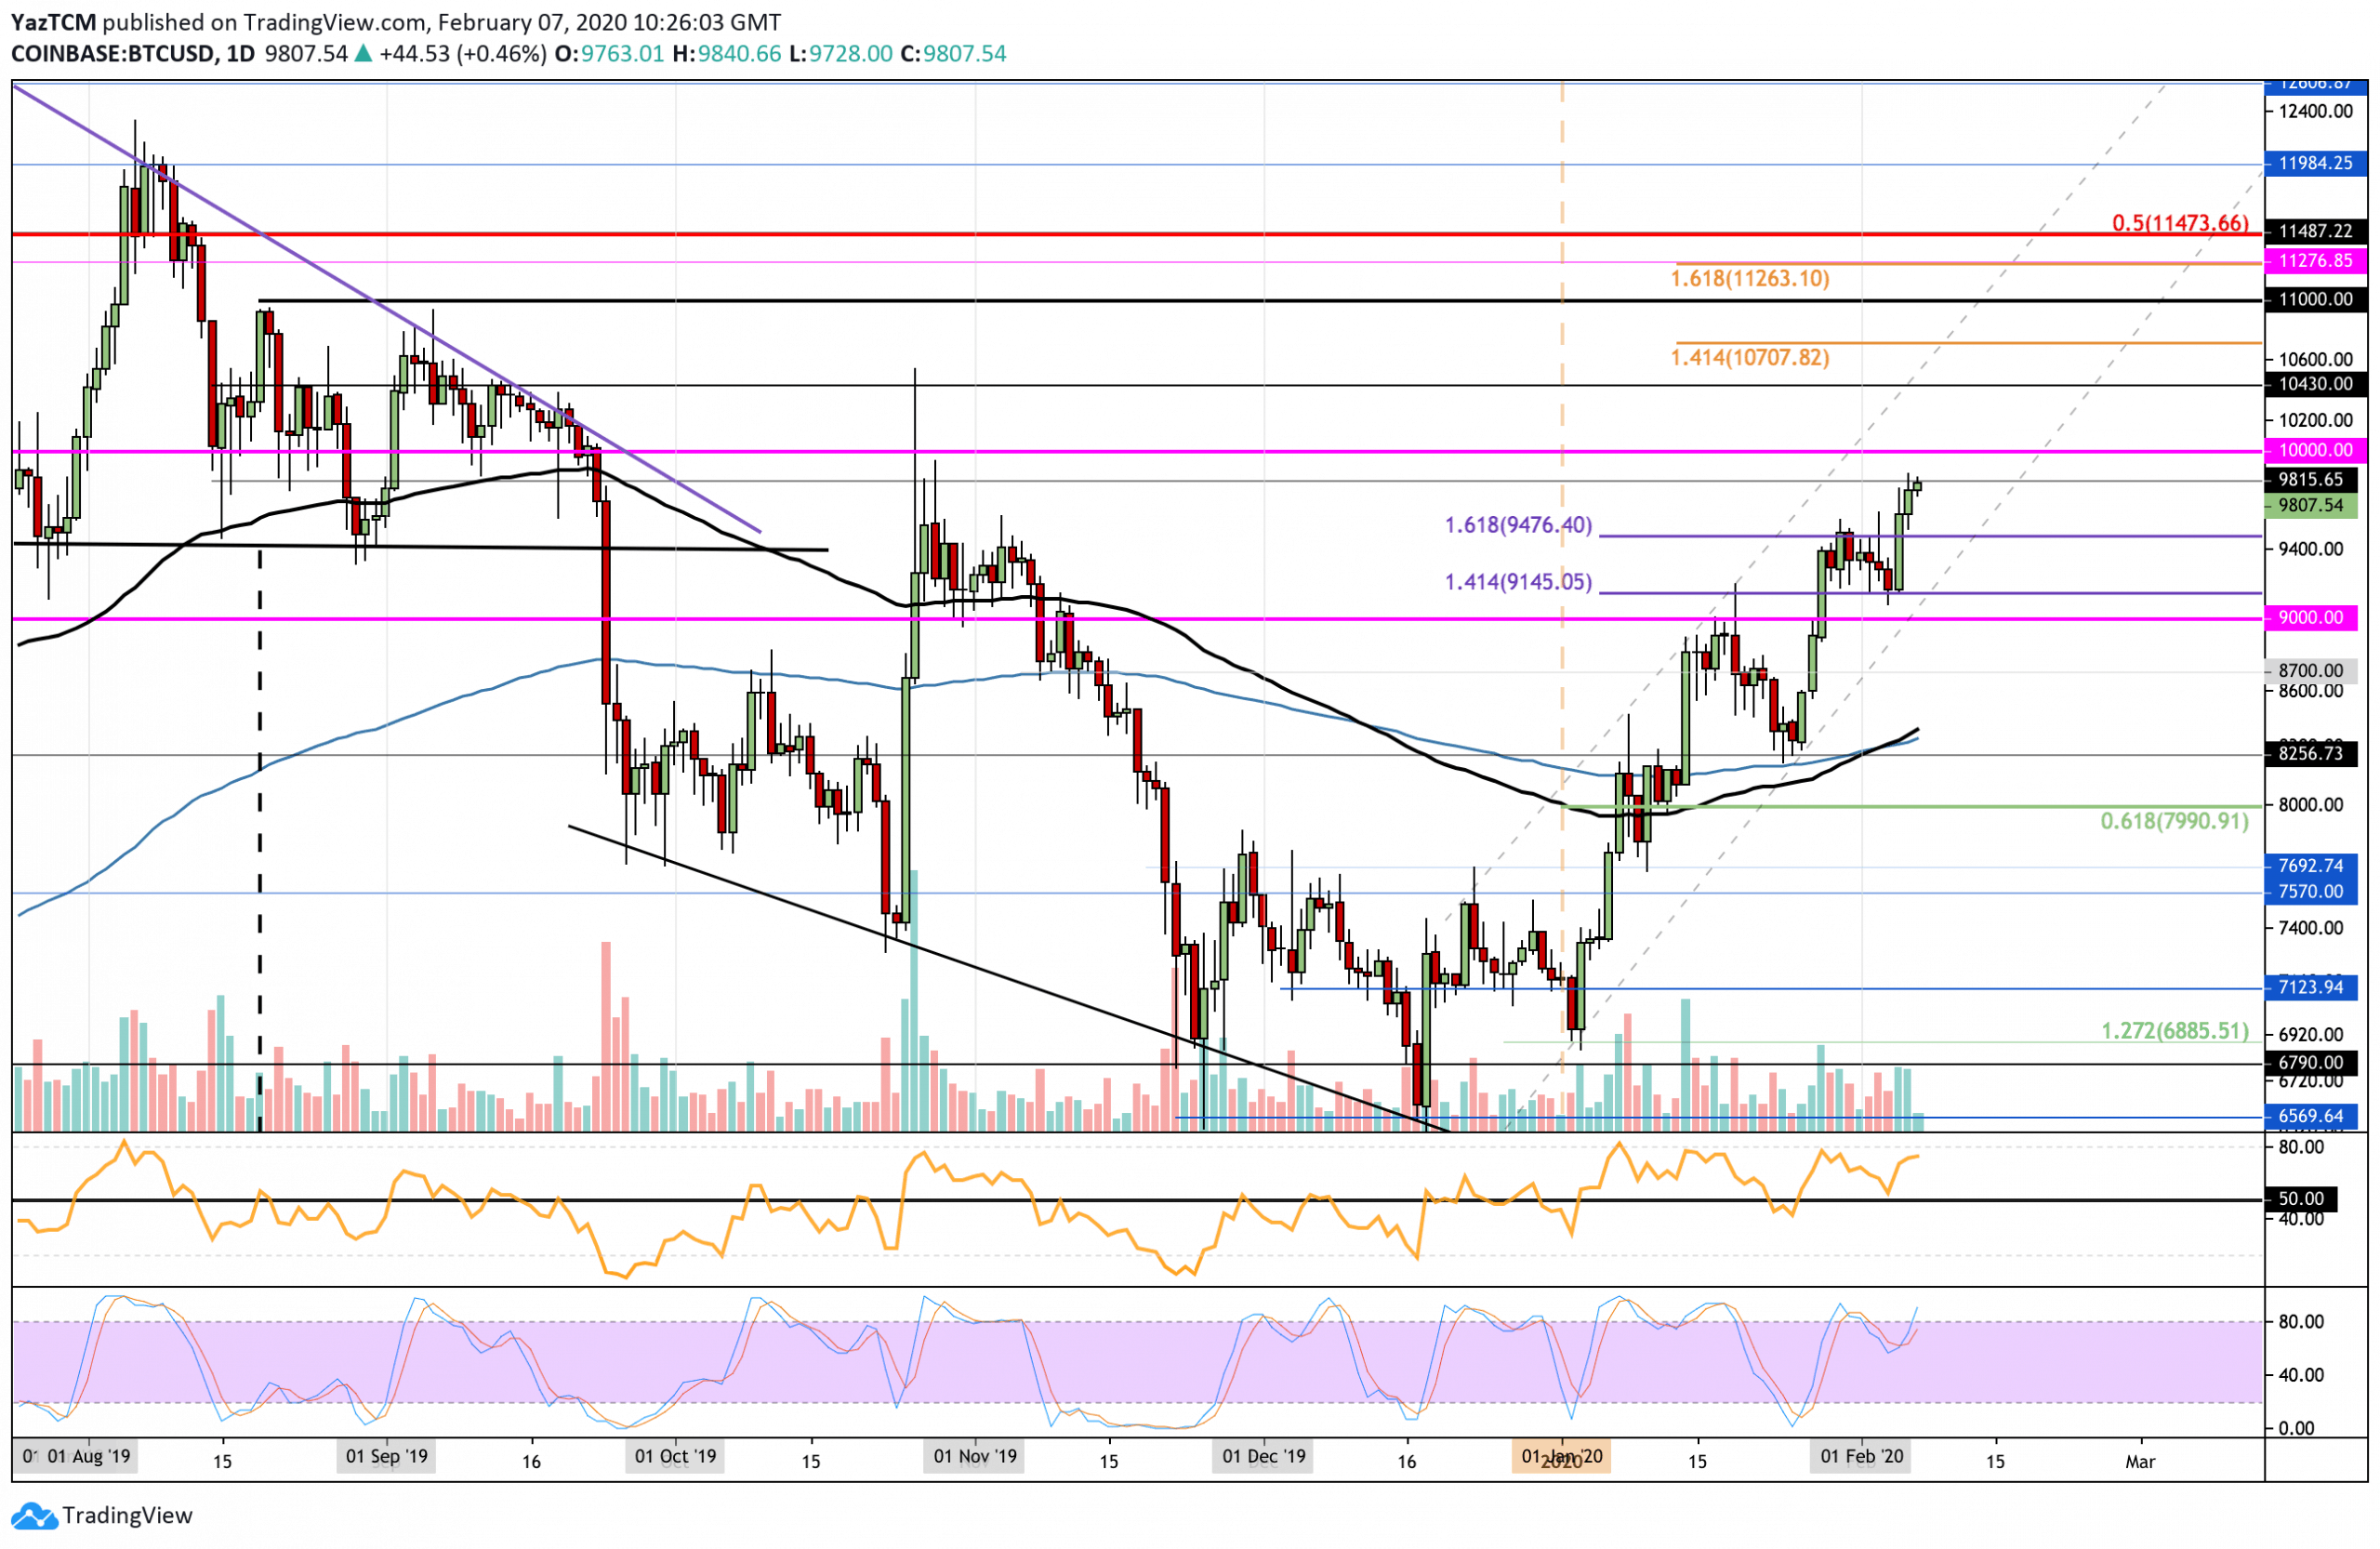
BTC/USD. Source: TradingView
Ethereum
Ethereum witnessed a price explosion of 23% over the past week of trading, making it the highest performing top 10 cryptocurrency. It penetrated above the strong resistance at $178 and went on to break above $200 to reach the current price of around $222.
Looking ahead, if the buyers manage to break $225, resistance lies at $235 (1.414 Fib Extension), $240, and $250. On the other hand, if the sellers push ETH lower, support is expected at $212, $200, and $194.
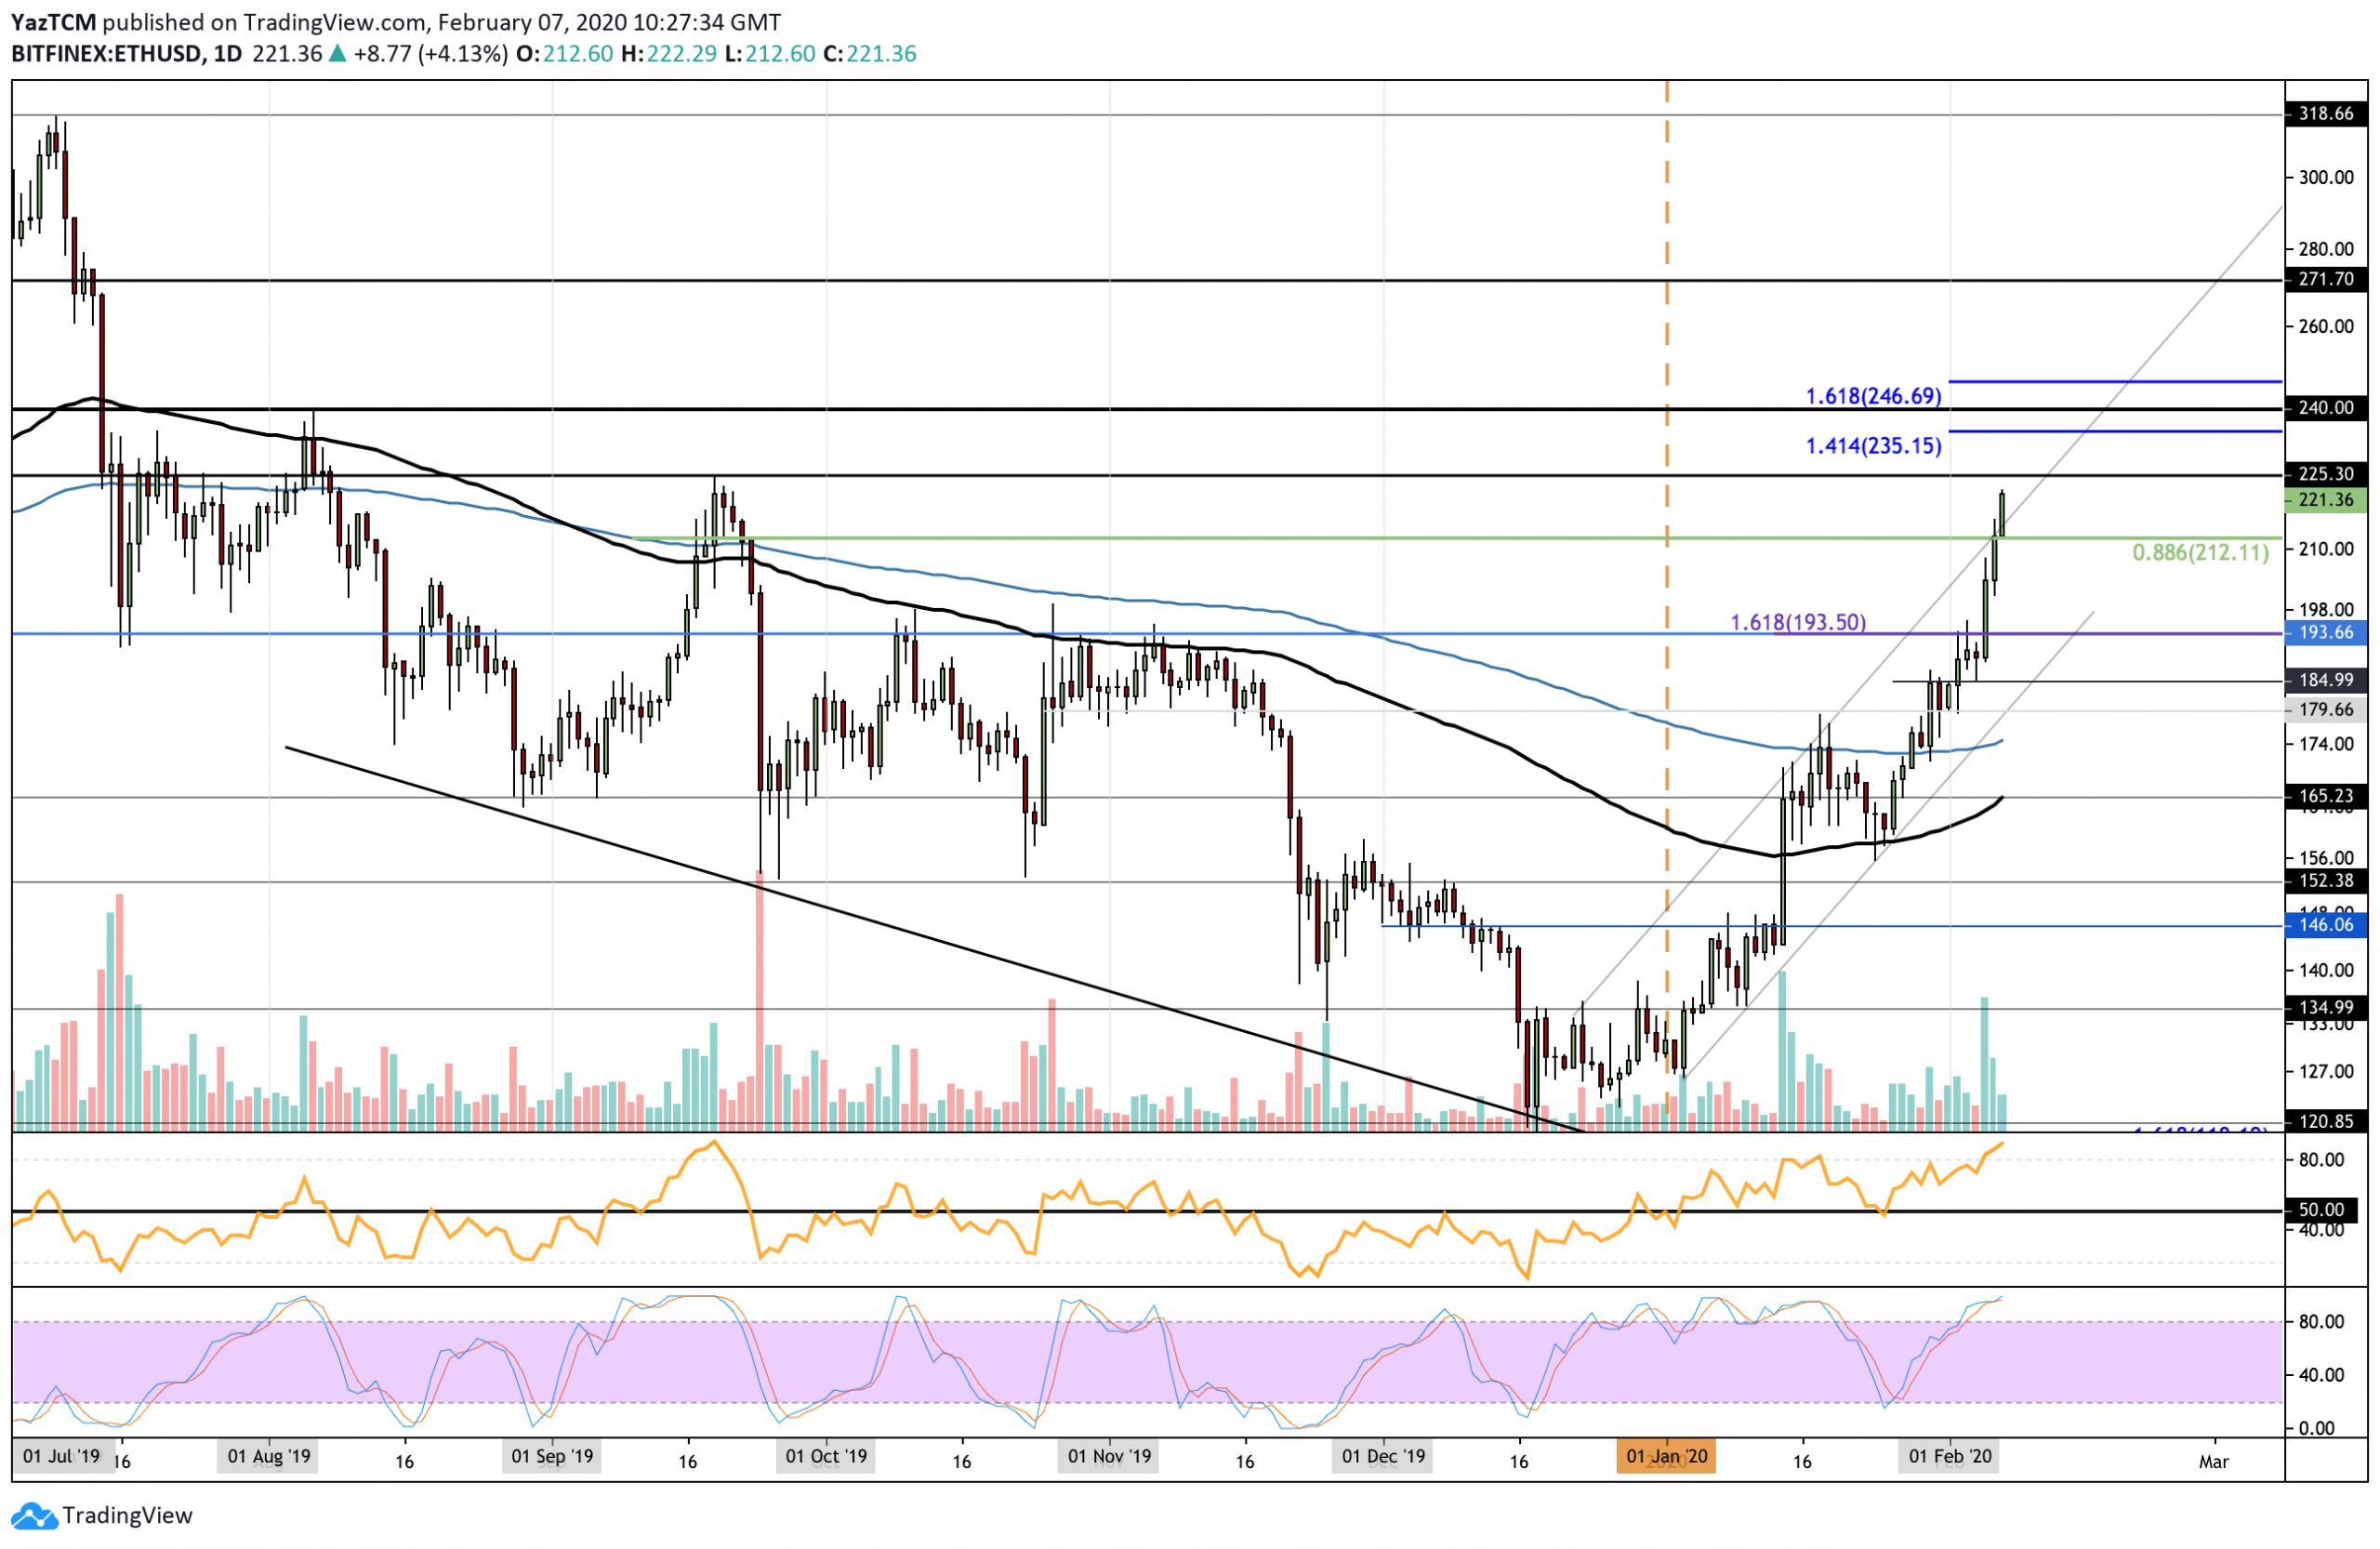
ETH/USD. Source: TradingView
Against Bitcoin, ETH surged by a total of 19% this week, bringing the price well above 0.02 BTC to reach the current trading level at 0.0227 BTC. In today’s trading session, Ethereum managed to break very strong resistance at 0.0223 BTC provided by a long term bearish .392 Fib Retracement.
Moving forward, the next level of resistance lies at 0.023 BTC. Above this, resistance lies at 0.0232 BTC, 0.024 BTC, and 0.0245 BTC. Alternatively, if the sellers push lower, initial support lies at 0.0223 BTC. Beneath this, additional support lies at 0.0218 BTC, 0.021 BTC, and 0.020 BTC.
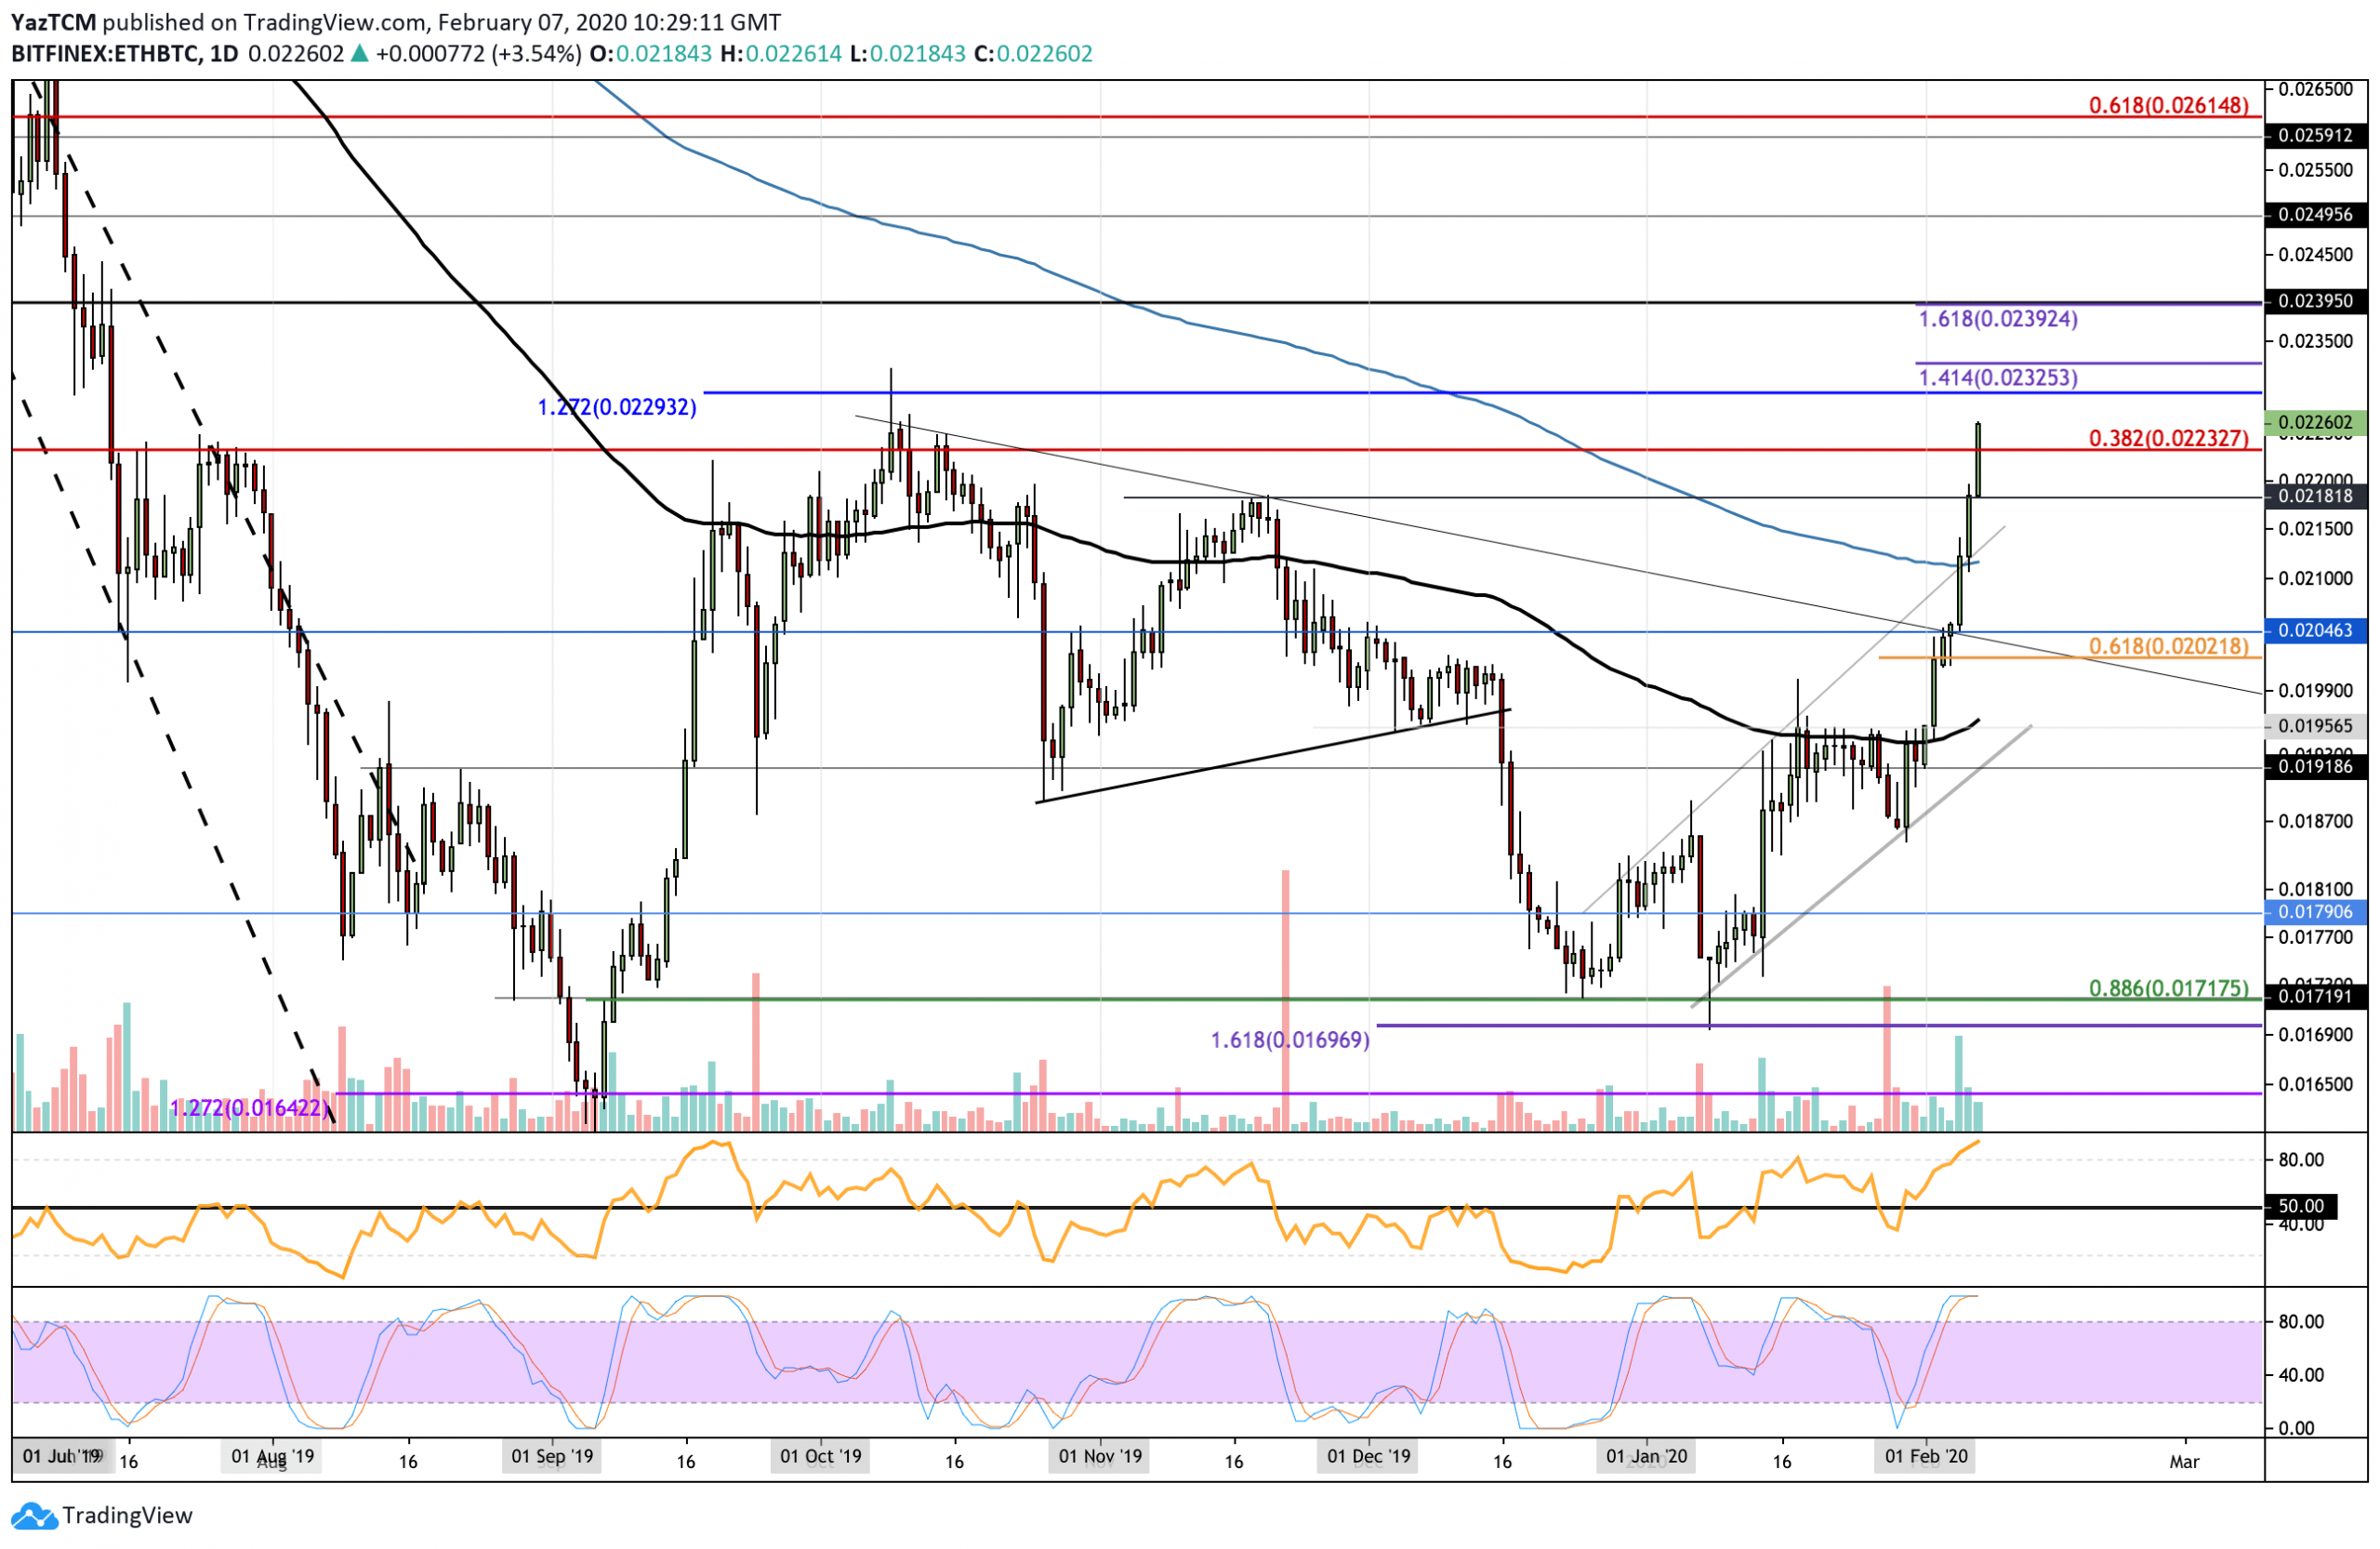
ETH/BTC. Source: TradingView
Ripple
XRP also outperformed Bitcoin this week as it rose by a total of 18.5%. The cryptocurrency broke above strong resistance at $0.245 and continued above the 200-days EMA to reach the current trading price of $0.283. It is bound by an ascending price channel as it battles the upper boundary.
Looking ahead, if the buyers continue above the channel, resistance lies at $0.289. Beyond this, additional resistance lies at $0.30, $0.317, and $0.326 (bearish .382 Fib Retracement). On the other side, if the sellers push lower, support lies at $0.275, $0.265, and $0.26 (200-days EMA). Added support lies at $0.25 and $0.245.
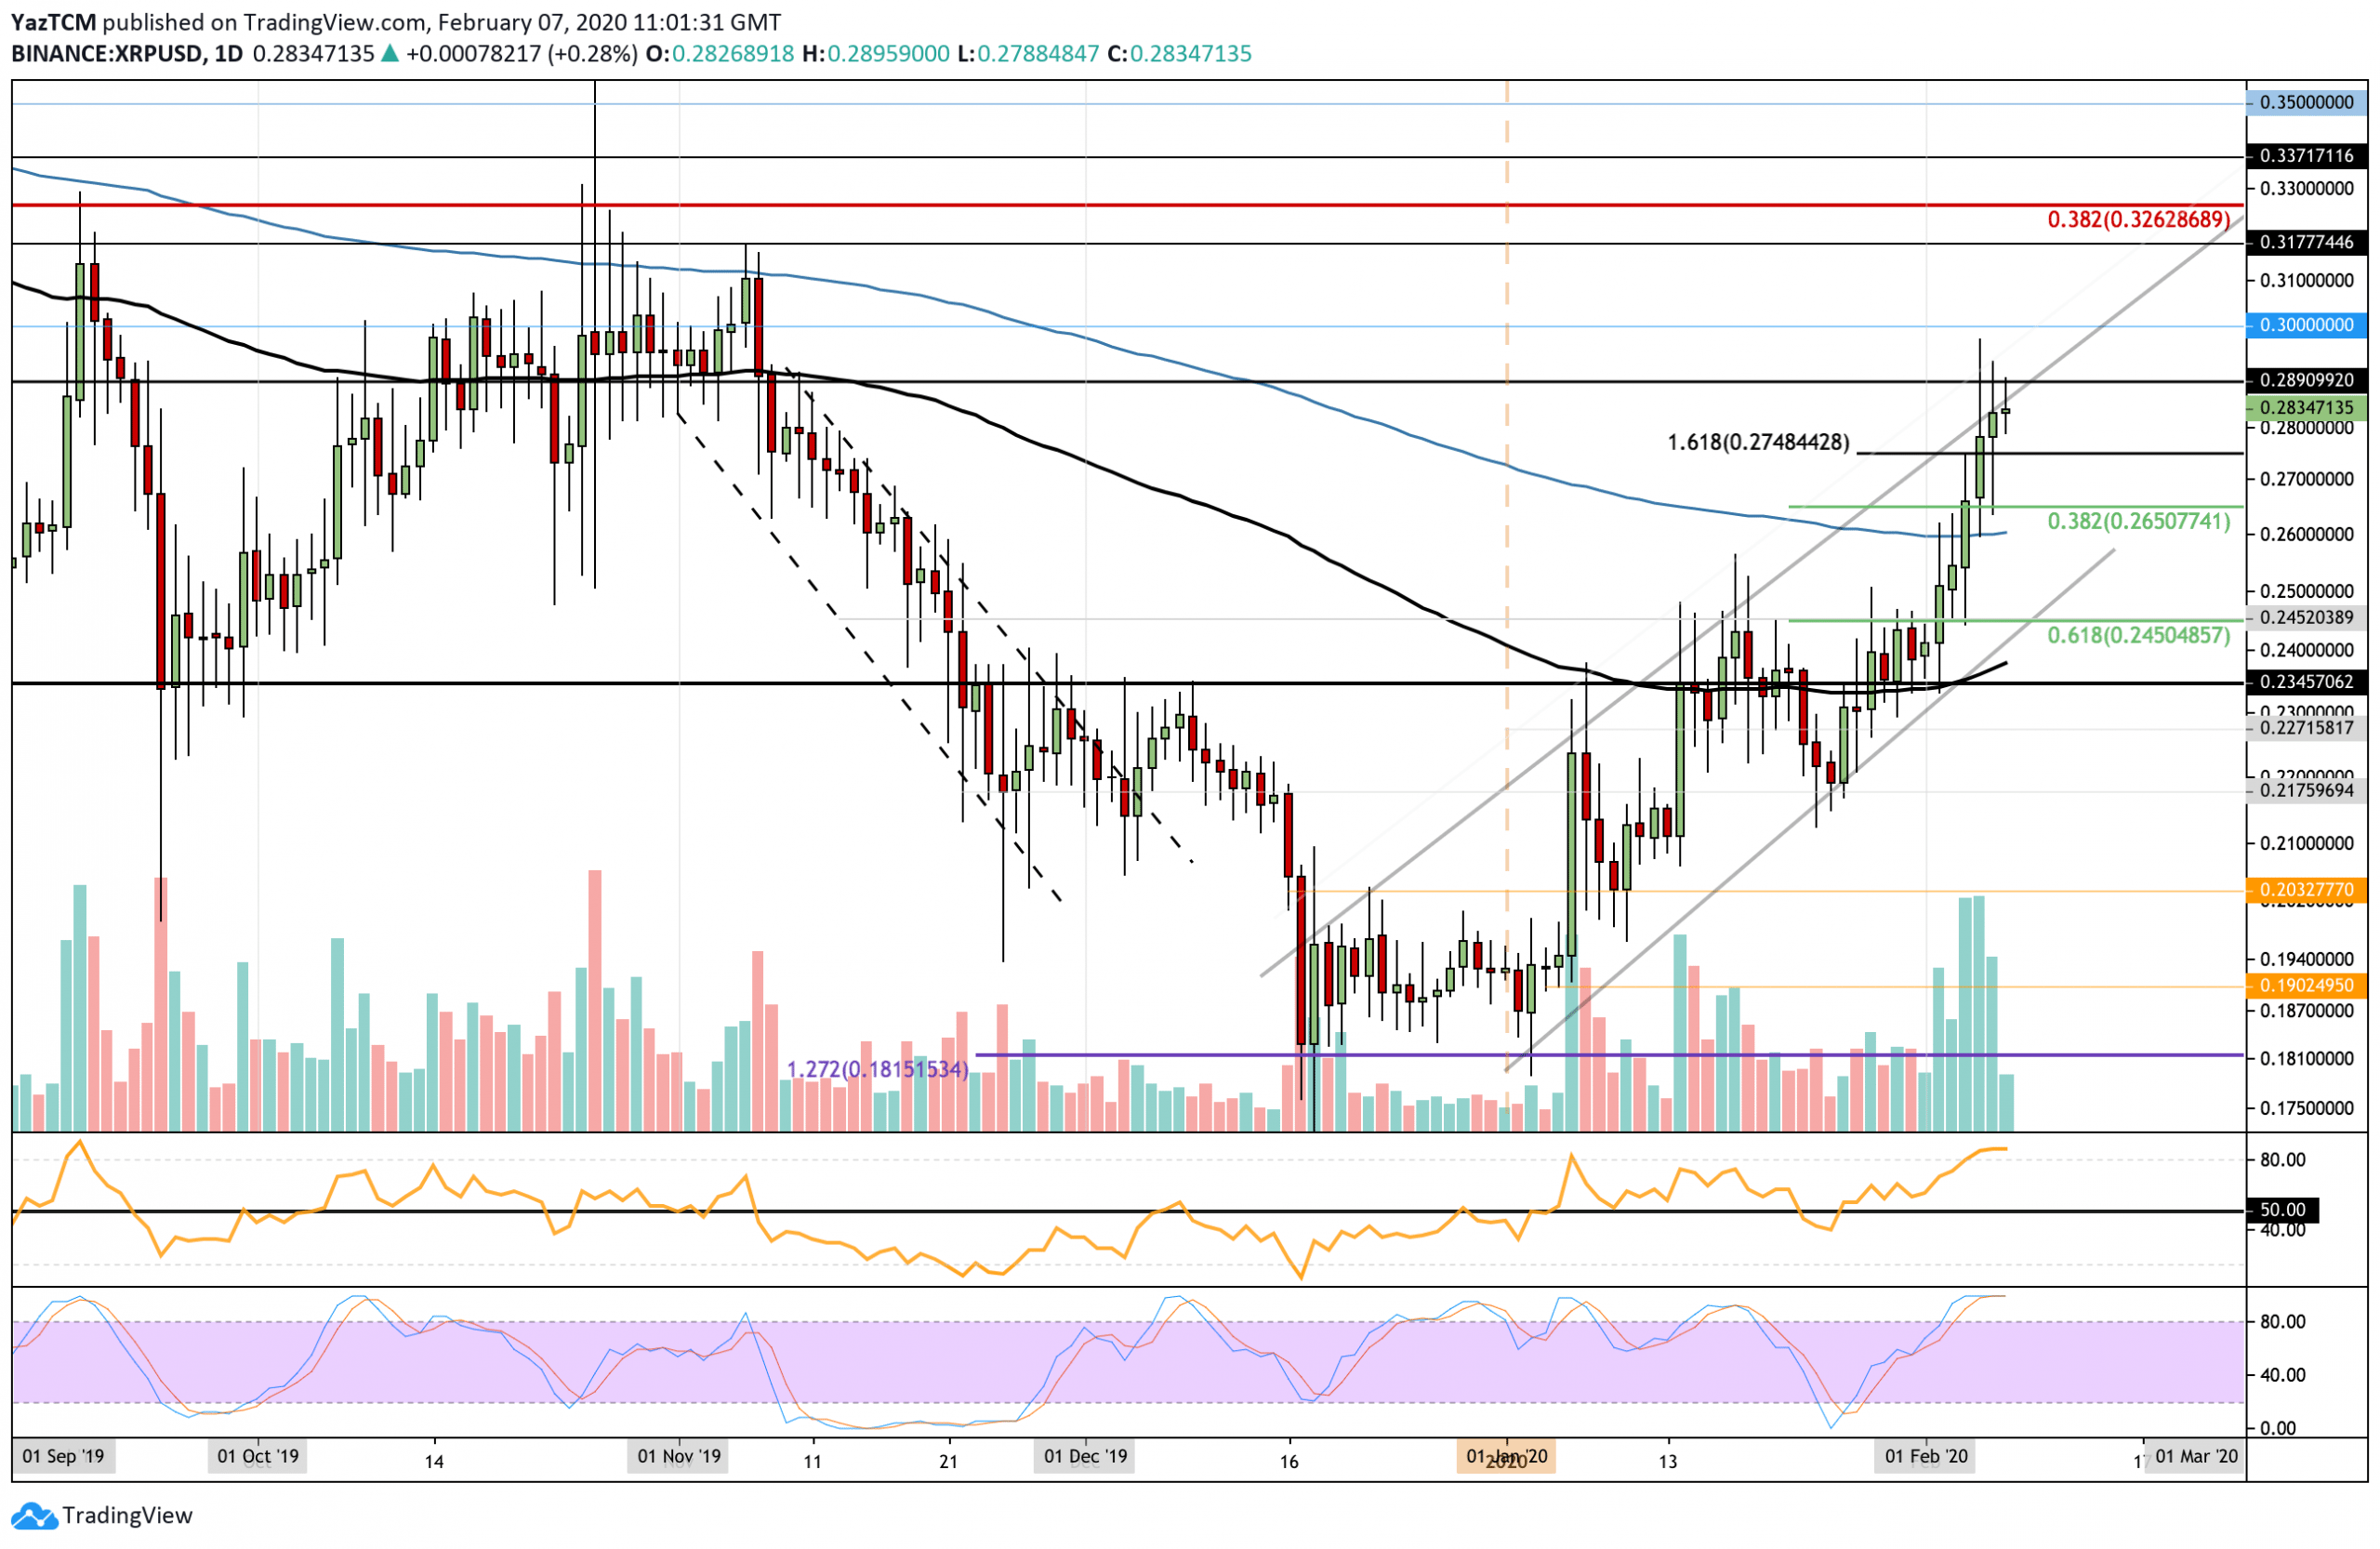
XRP/BTC. Source: TradingView
Against BTC, XRP increased by 13% to rise above the 3-month old descending trend line and climb above the 100-days EMA to reach the current price of 2900 SAT.
Looking ahead, if the buyers push beyond 2900 SAT, strong resistance lies at 3000 SAT. Above this, resistance lies at 3115 SAT, 3250 SAT (200-days EMA), and 3325 SAT. On the other hand, if the sellers push lower, the first level of support lies at the 100-days EMA at 2850 SAT. Beneath this, support lies at 2800 SAT and 2710 SAT.
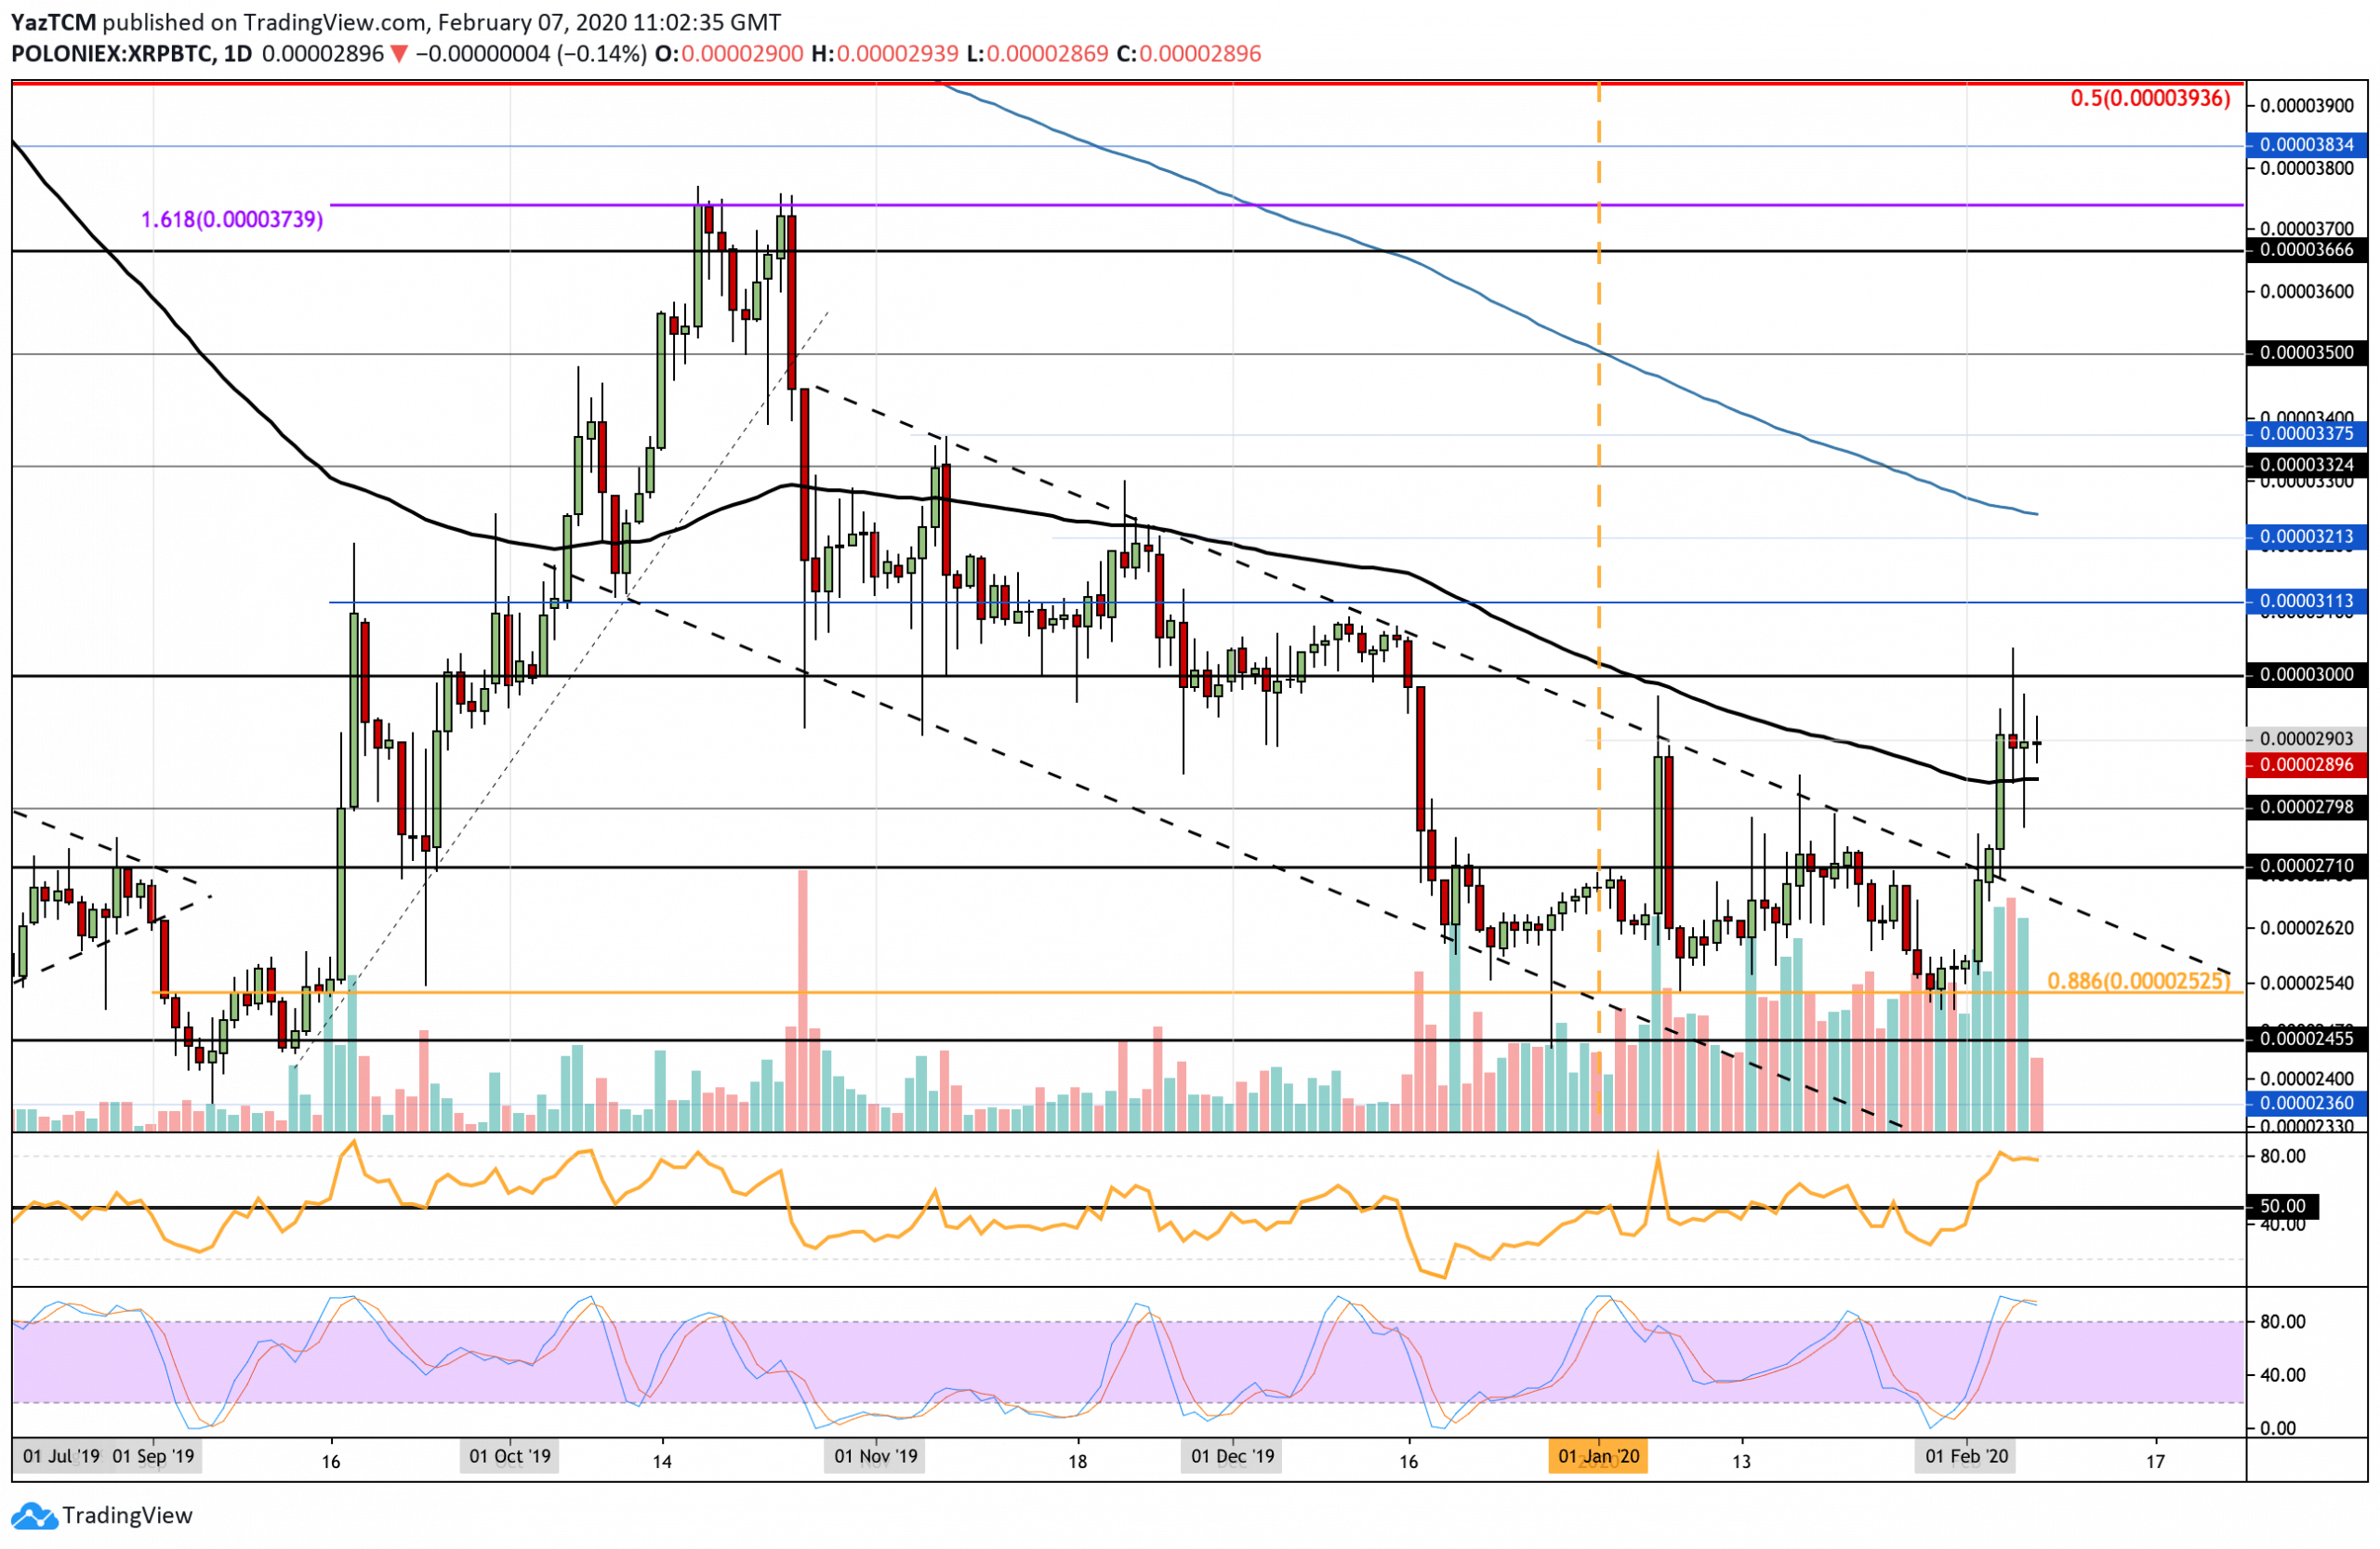
XRP/BTC. Source: TradingView
Tron
Tron increased by a total of 24% this week after news that Justin Sun finally met with Warren Buffet for his charity meal. The cryptocurrency managed to climb above the 200-days EMA at $0.018 and has managed to break resistance at the October high to reach $0.023.
Looking ahead, if the buyers climb higher, resistance lies at $0.024, $0.025, and $0.026 (bearish .5 Fib Retracement). Above this, additional resistance lies at $0.0275 and $0.0293 (bearish .618 Fib Retracement). On the other hand, if the sellers push lower, support lies at $0.022, $0.0208, and $0.0196 (.382 Fib Retracement).
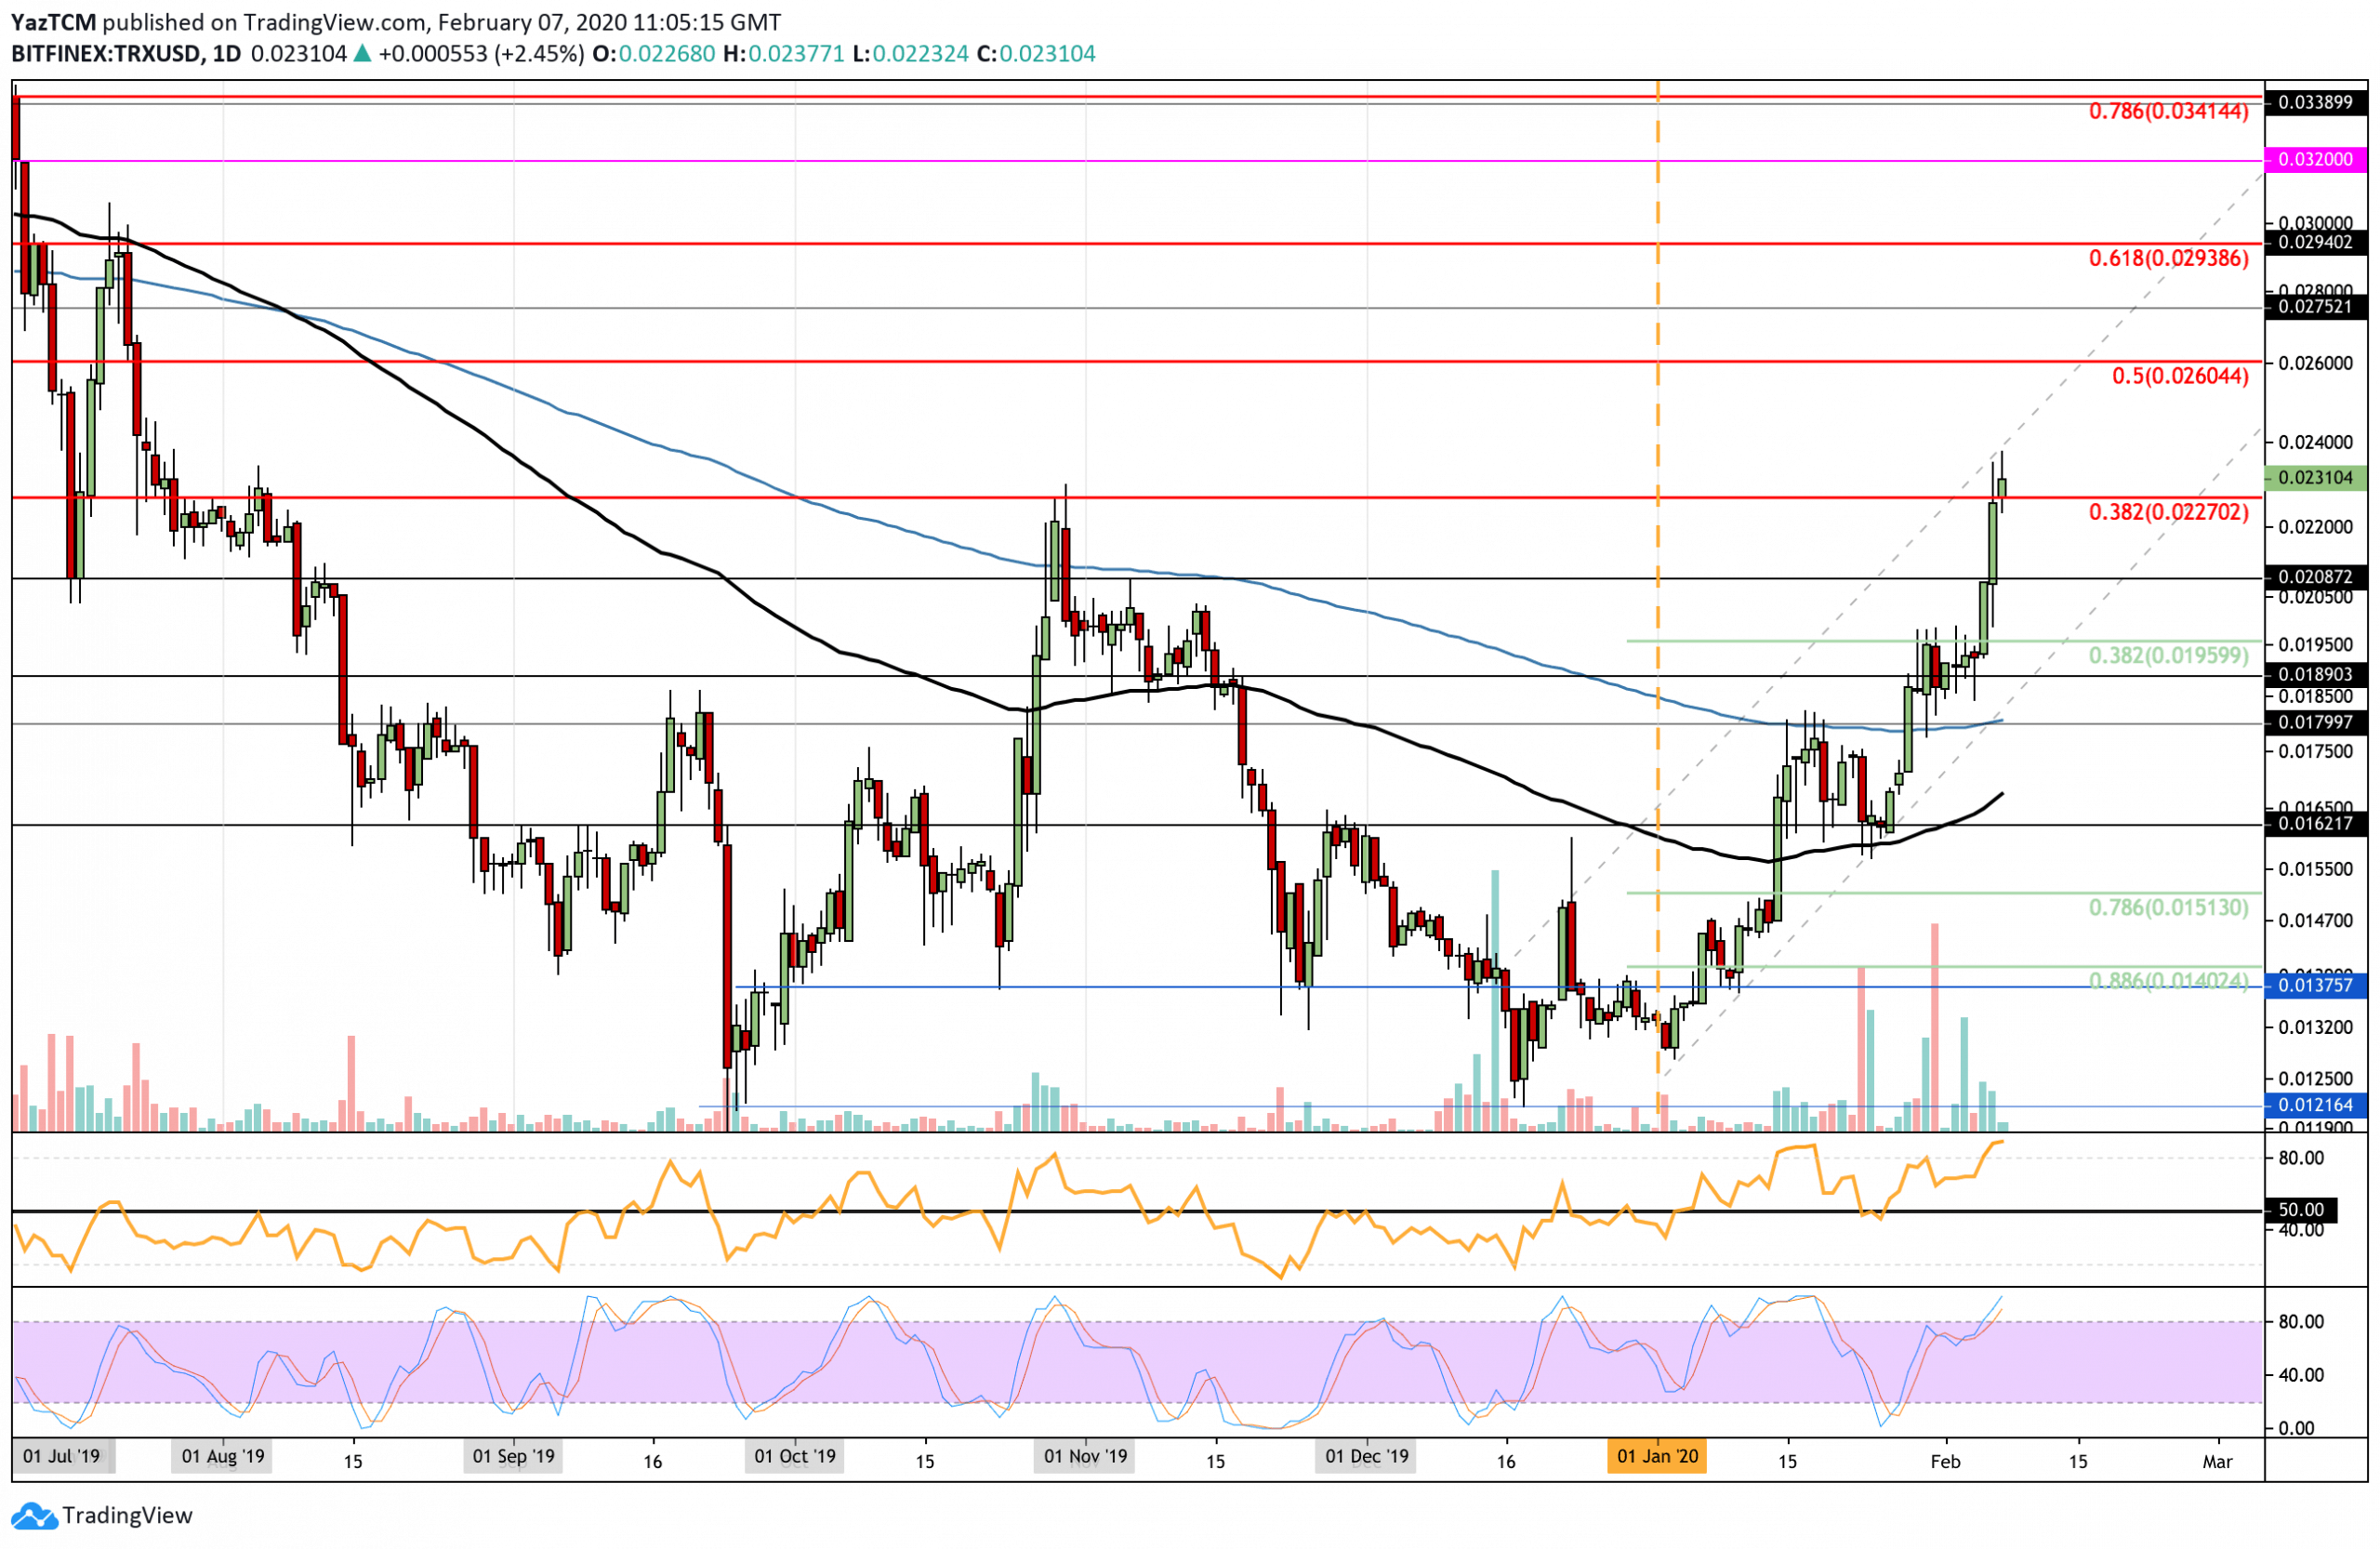
TRX/USD. Source: TradingView
Against BTC, TRX also climbed higher as it rose from 200 SAT to reach the resistance at 240 SAT, which had “troubled” the market during October 2019. TRX is now above the 200-days EMA but must close above 240 SAT to turn bullish.
If the buyers do break 240 SAT, resistance lies at 253 SAT (1.618 Fib Extension), 263 SAT (bearish .382 Fib Retracement), and 283 SAT. On the other hand, if the sellers push lower, support lies at 220 SAT (200-days EMA), 215 SAT, and 200 SAT (100-days EMA).
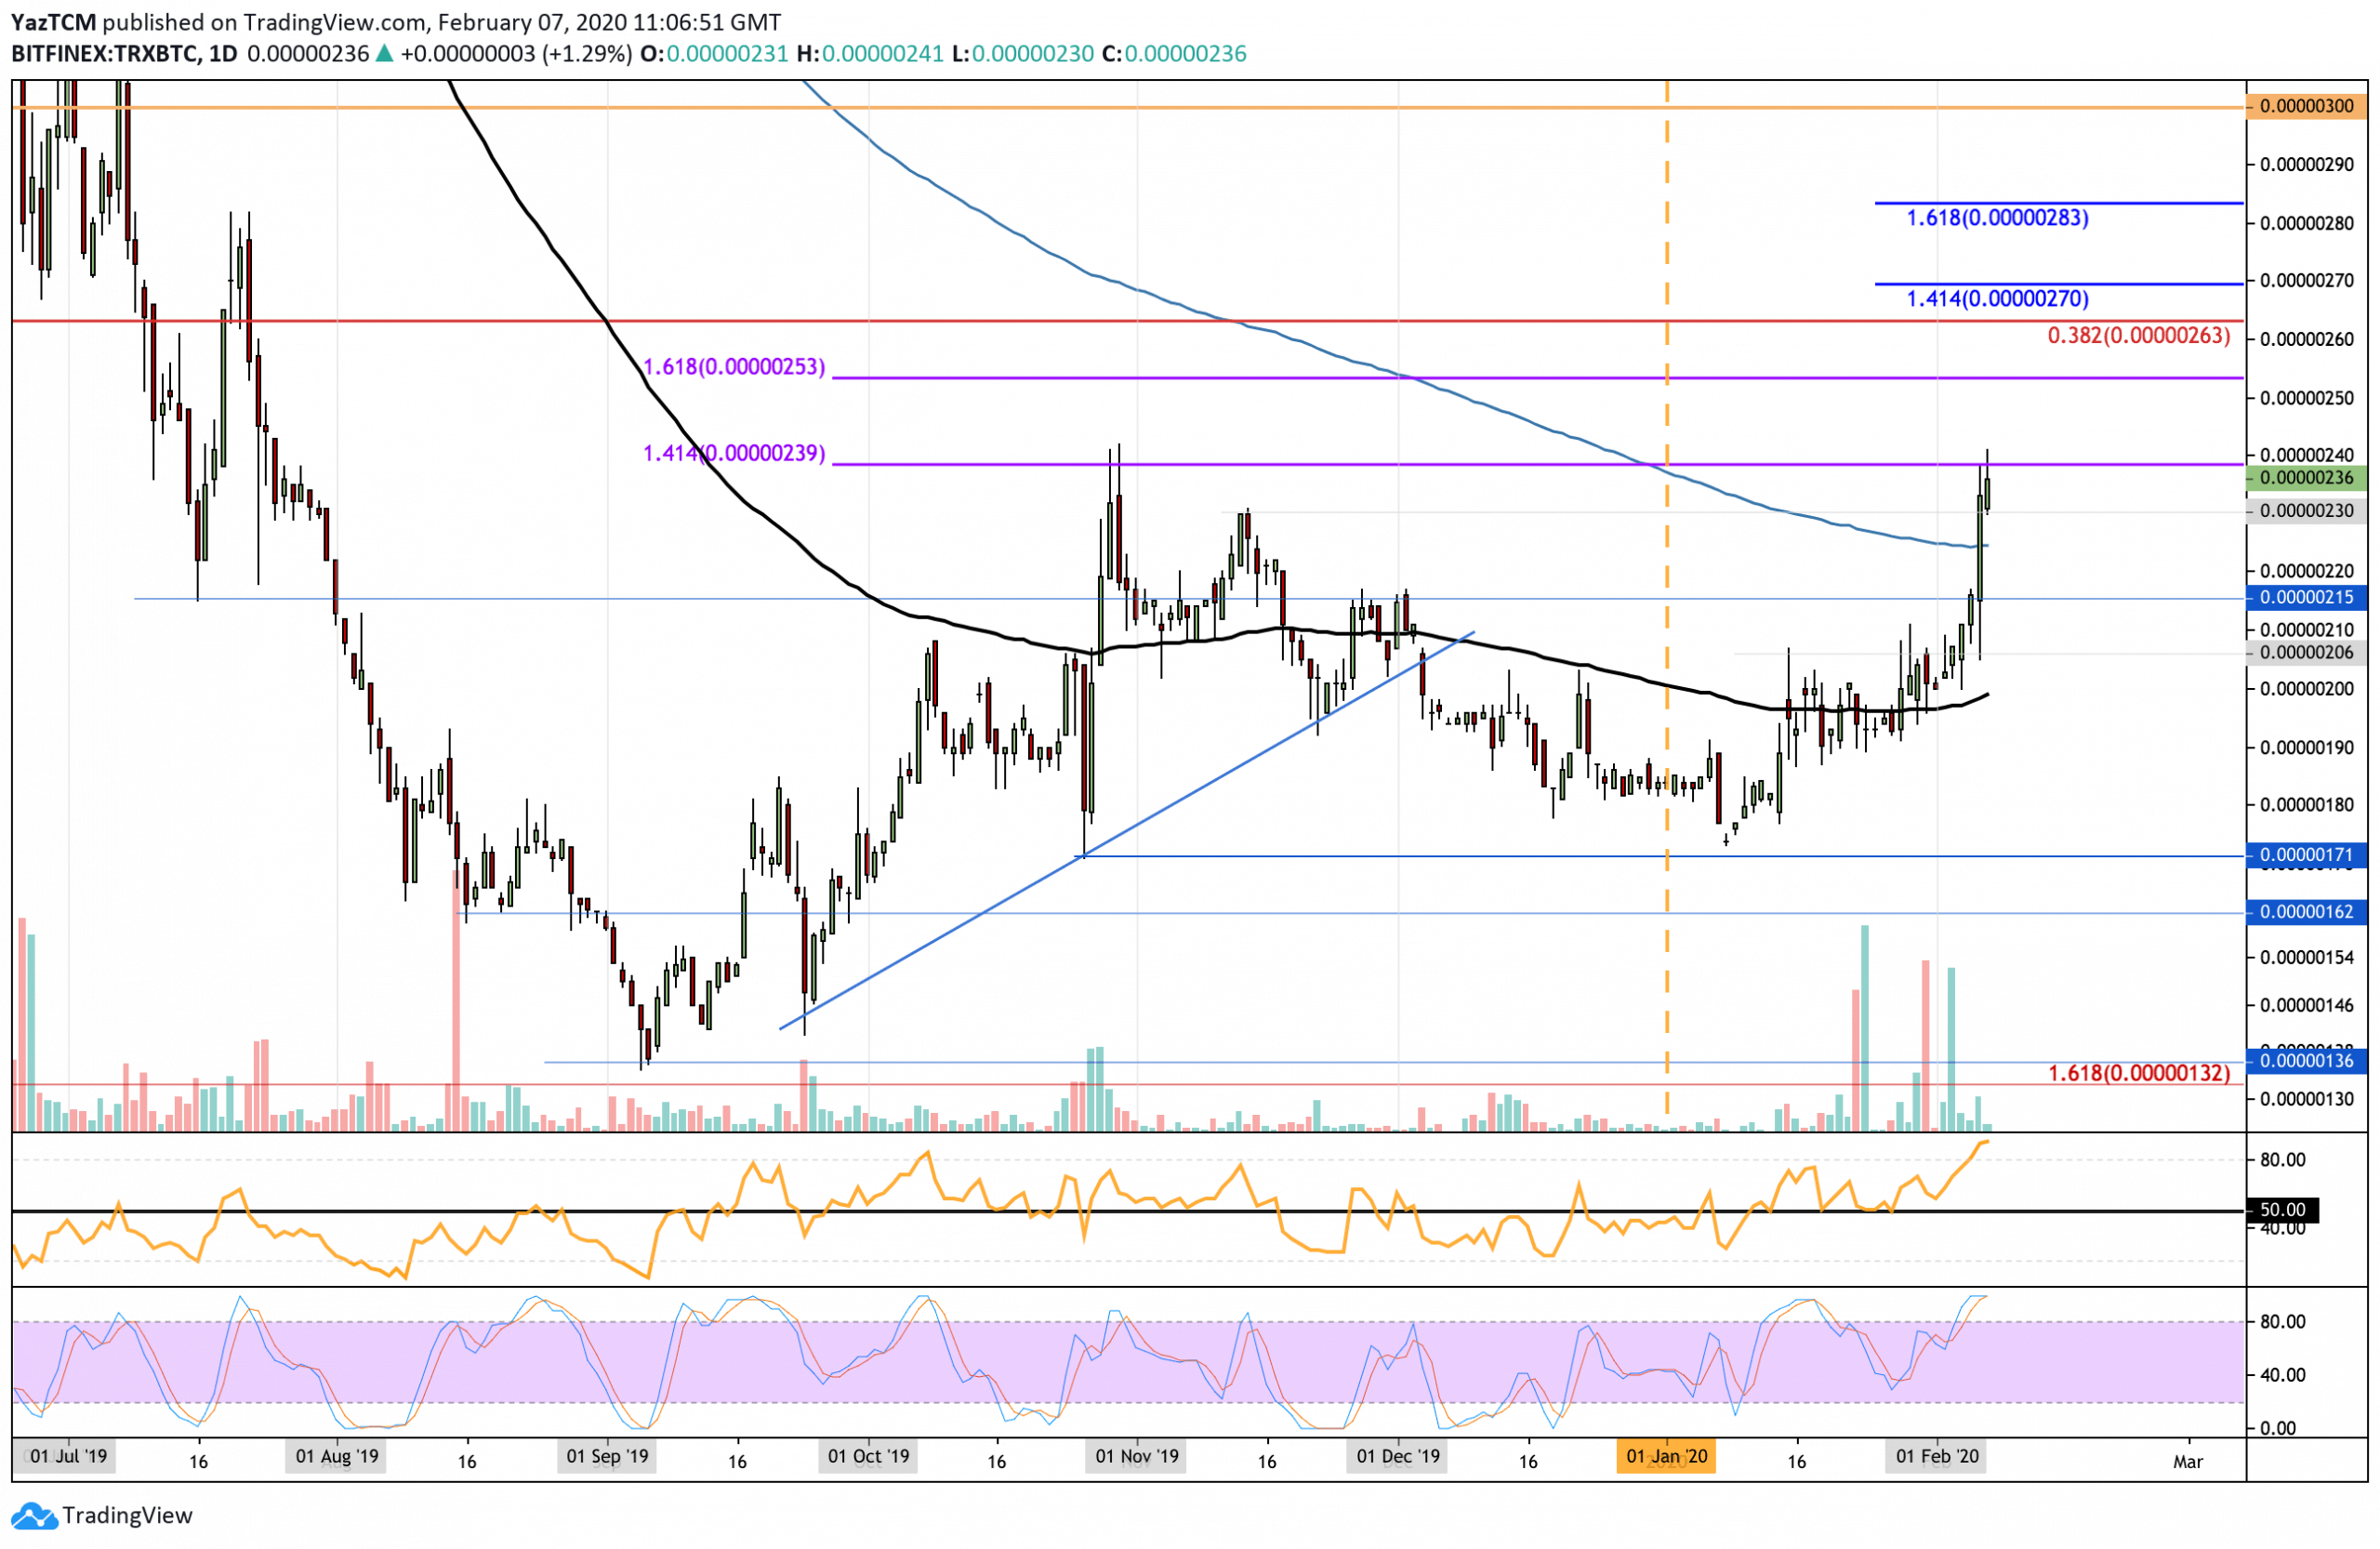
TRX/BTC. Source: TradingView
LINK
ChainLink rose by a total of 13% this week to create a fresh 2-month high at the $3.24 level. Once LINK breaks resistance at $3.40, it will be creating a new high not seen since July 2019. Chainlink continues to climb the market cap rankings as it sits in the 16th position with a total market cap of $1.13 billion.
Looking ahead, if the bulls break $3.40, the next level of resistance lies at $3.75, which is the 2019 high-day closing price. Above this, resistance lies at $4.05, $4.40, and $4.81, which is the 2019 high. Alternatively, support lies at $3.00, $2.78, and $2.37 (100-days EMA).

LINK/USD. Source: TradingView
LINK has also created a fresh 2-month high against Bitcoin as it reaches resistance at 0.000341 BTC. It has since dropped slightly as it trades at 0.000329 BTC. LINK remains neutral until it can make fresh ground above the November 2019 high at 0.000367 BTC.
Moving forward, if the bulls break 0.000341 BTC, additional resistance lies at 0.000352 BTC, 0.000367 BTC, and 0.00391 BTC. On the other hand, support lies at 0.00031 BTC, 0.00030 BTC, and 0.000288 BTC.

LINK/BTC. Source: TradingView
Disclaimer: Information found on CryptoPotato is those of writers quoted. It does not represent the opinions of CryptoPotato on whether to buy, sell, or hold any investments. You are advised to conduct your own research before making any investment decisions. Use provided information at your own risk. See Disclaimer for more information.
The post appeared first on CryptoPotato


