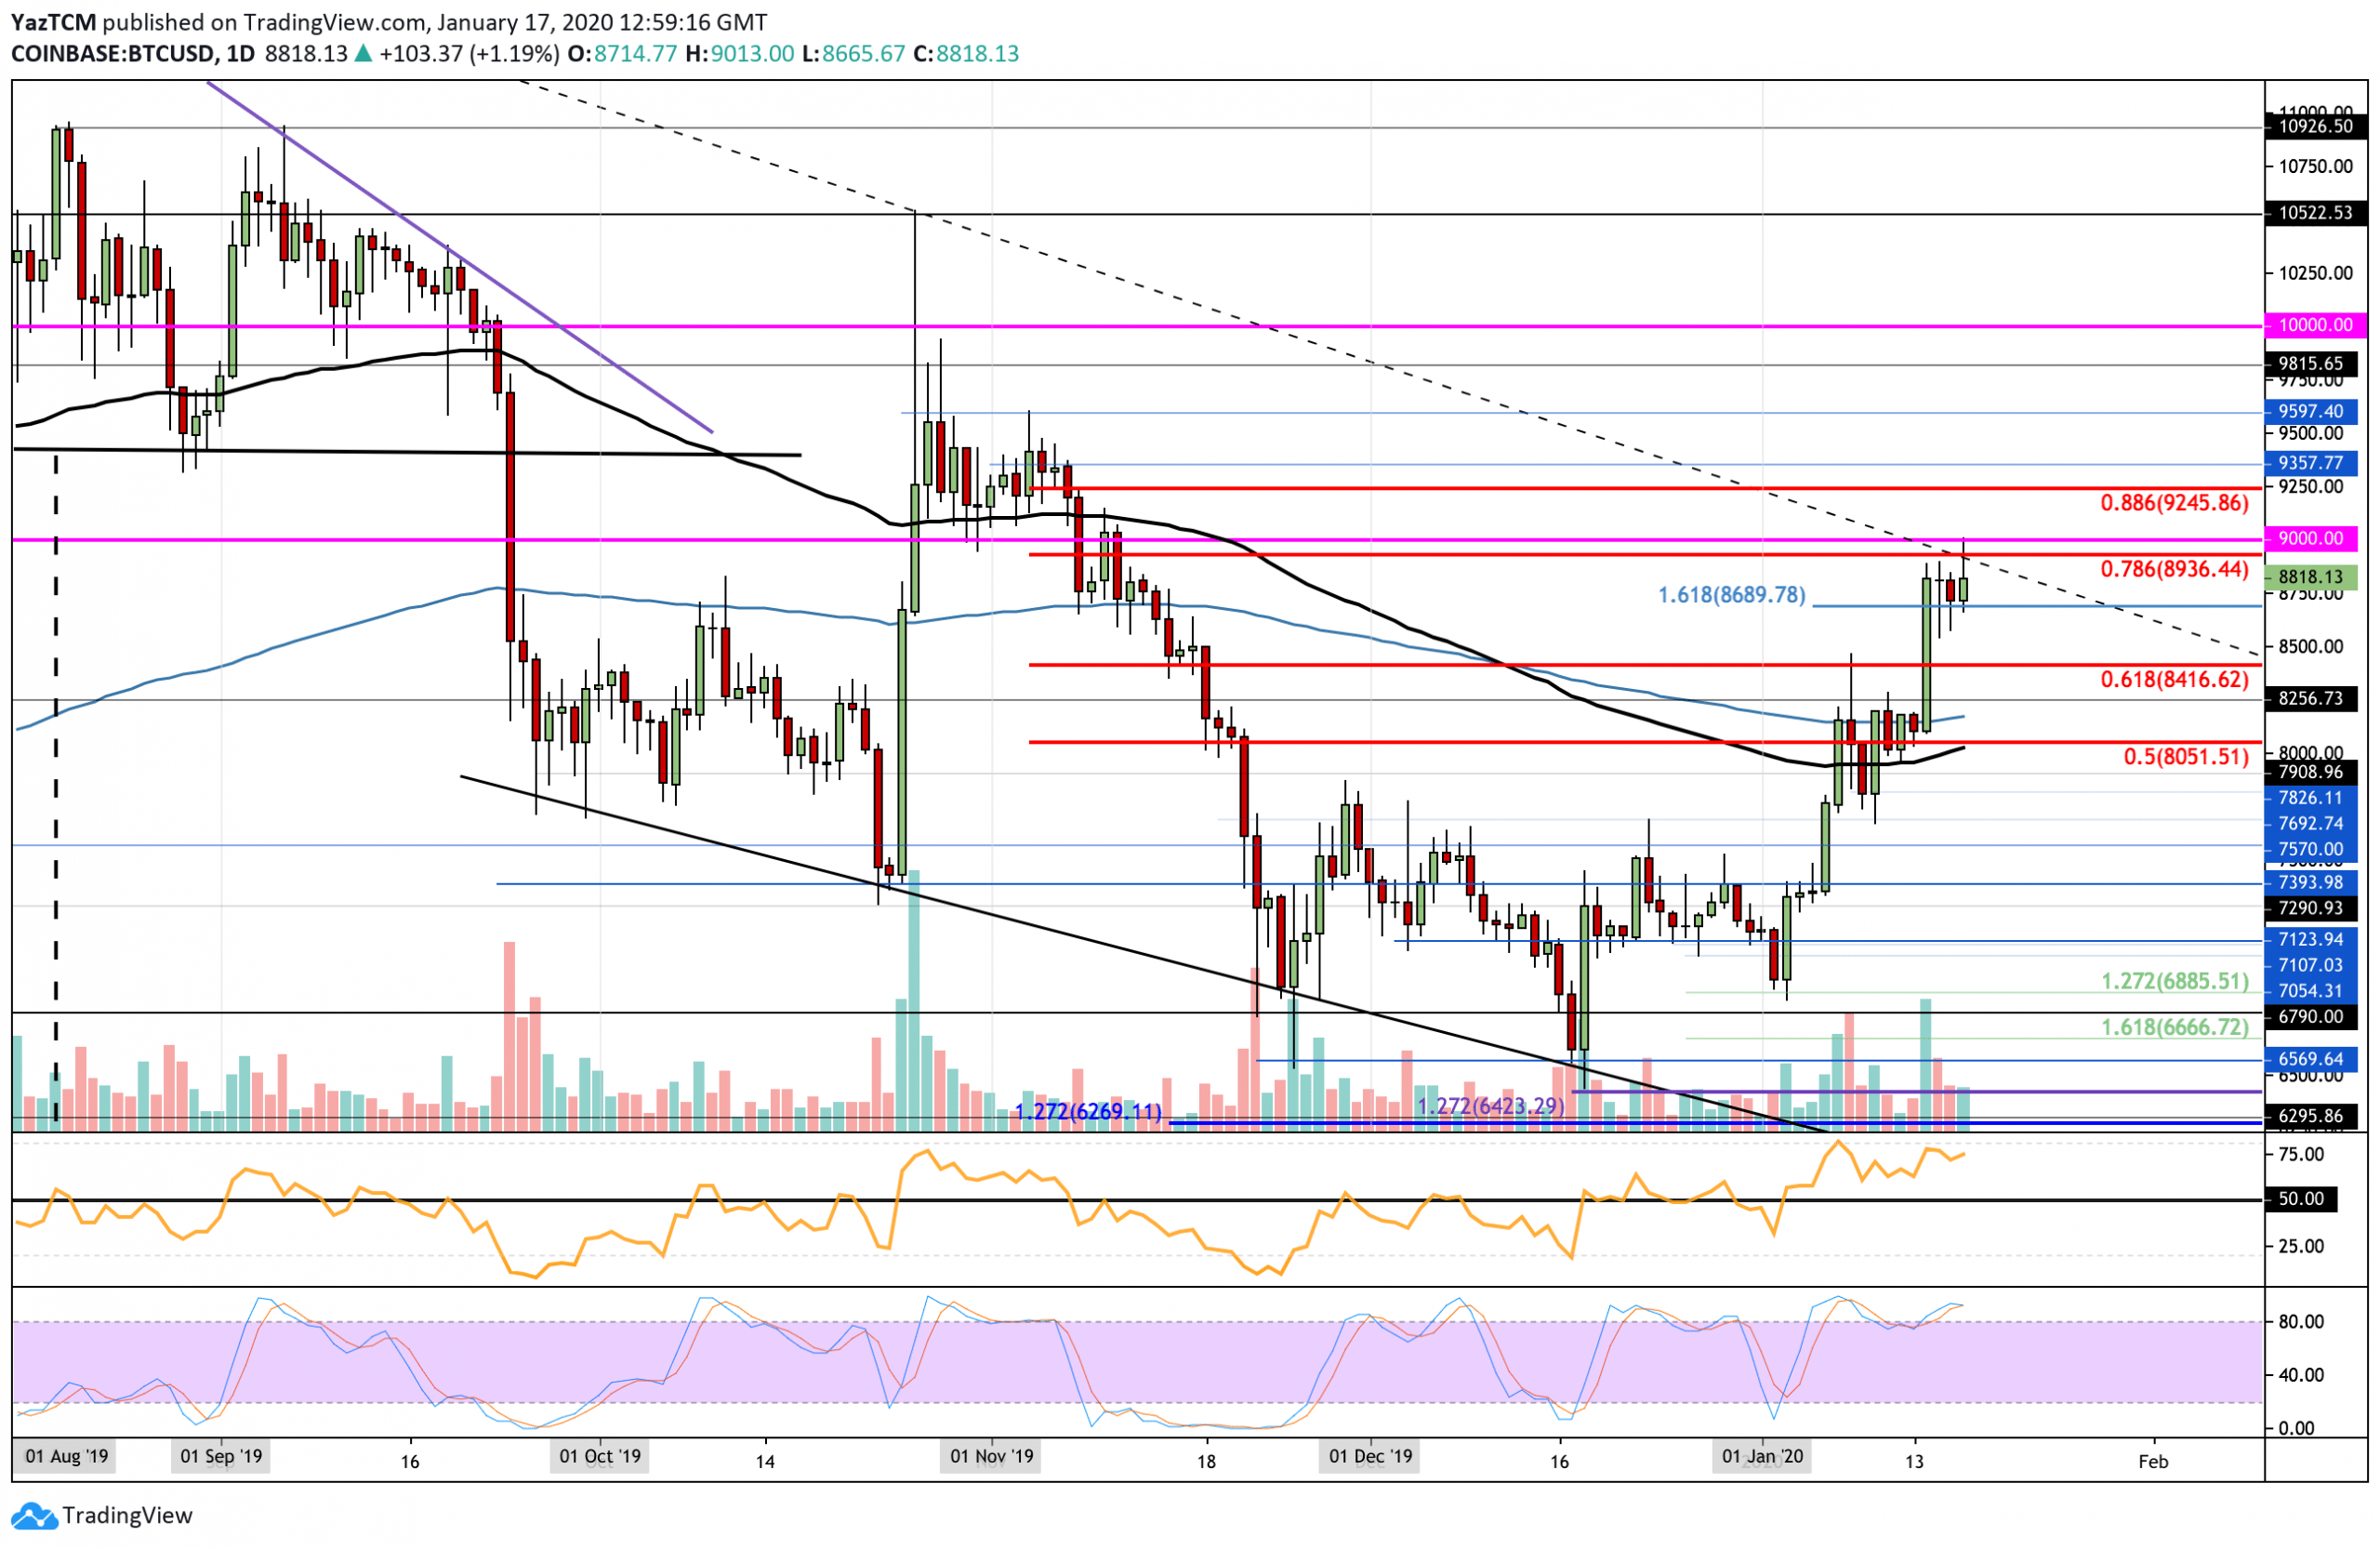
Bitcoin saw a serious 12% price increase this week, allowing the cryptocurrency to rises toward the $8,800 level. BTC actually managed to rise into the $9,000 resistance level today but has since rolled over and fallen slightly. The latest price increase saw Bitcoin rising well above the 200-days EMA as it approached resistance at $8,960 (provided by a bearish .786 Fibonacci Retracement level). This price surge puts Bitcoin on a strong bullish footing as the cryptocurrency gears itself to break above $9,000 and approach $10,000. For Bitcoin to turn bearish, it must fall and break beneath the $7,000 level.
If the bulls continue to push above $9,000, immediate higher resistance lies at $9,100 and $9,245 (bearish .886 Fibonacci Retracement level). Above this, resistance is expected at $9,600 (November highs) and $9,815. On the other hand, if the sellers step in and push Bitcoin lower, initial support is located at $8,690. Beneath this, support lies at $8,400, $8,200 (200-days EMA), and $8,000 (100-days EMA).
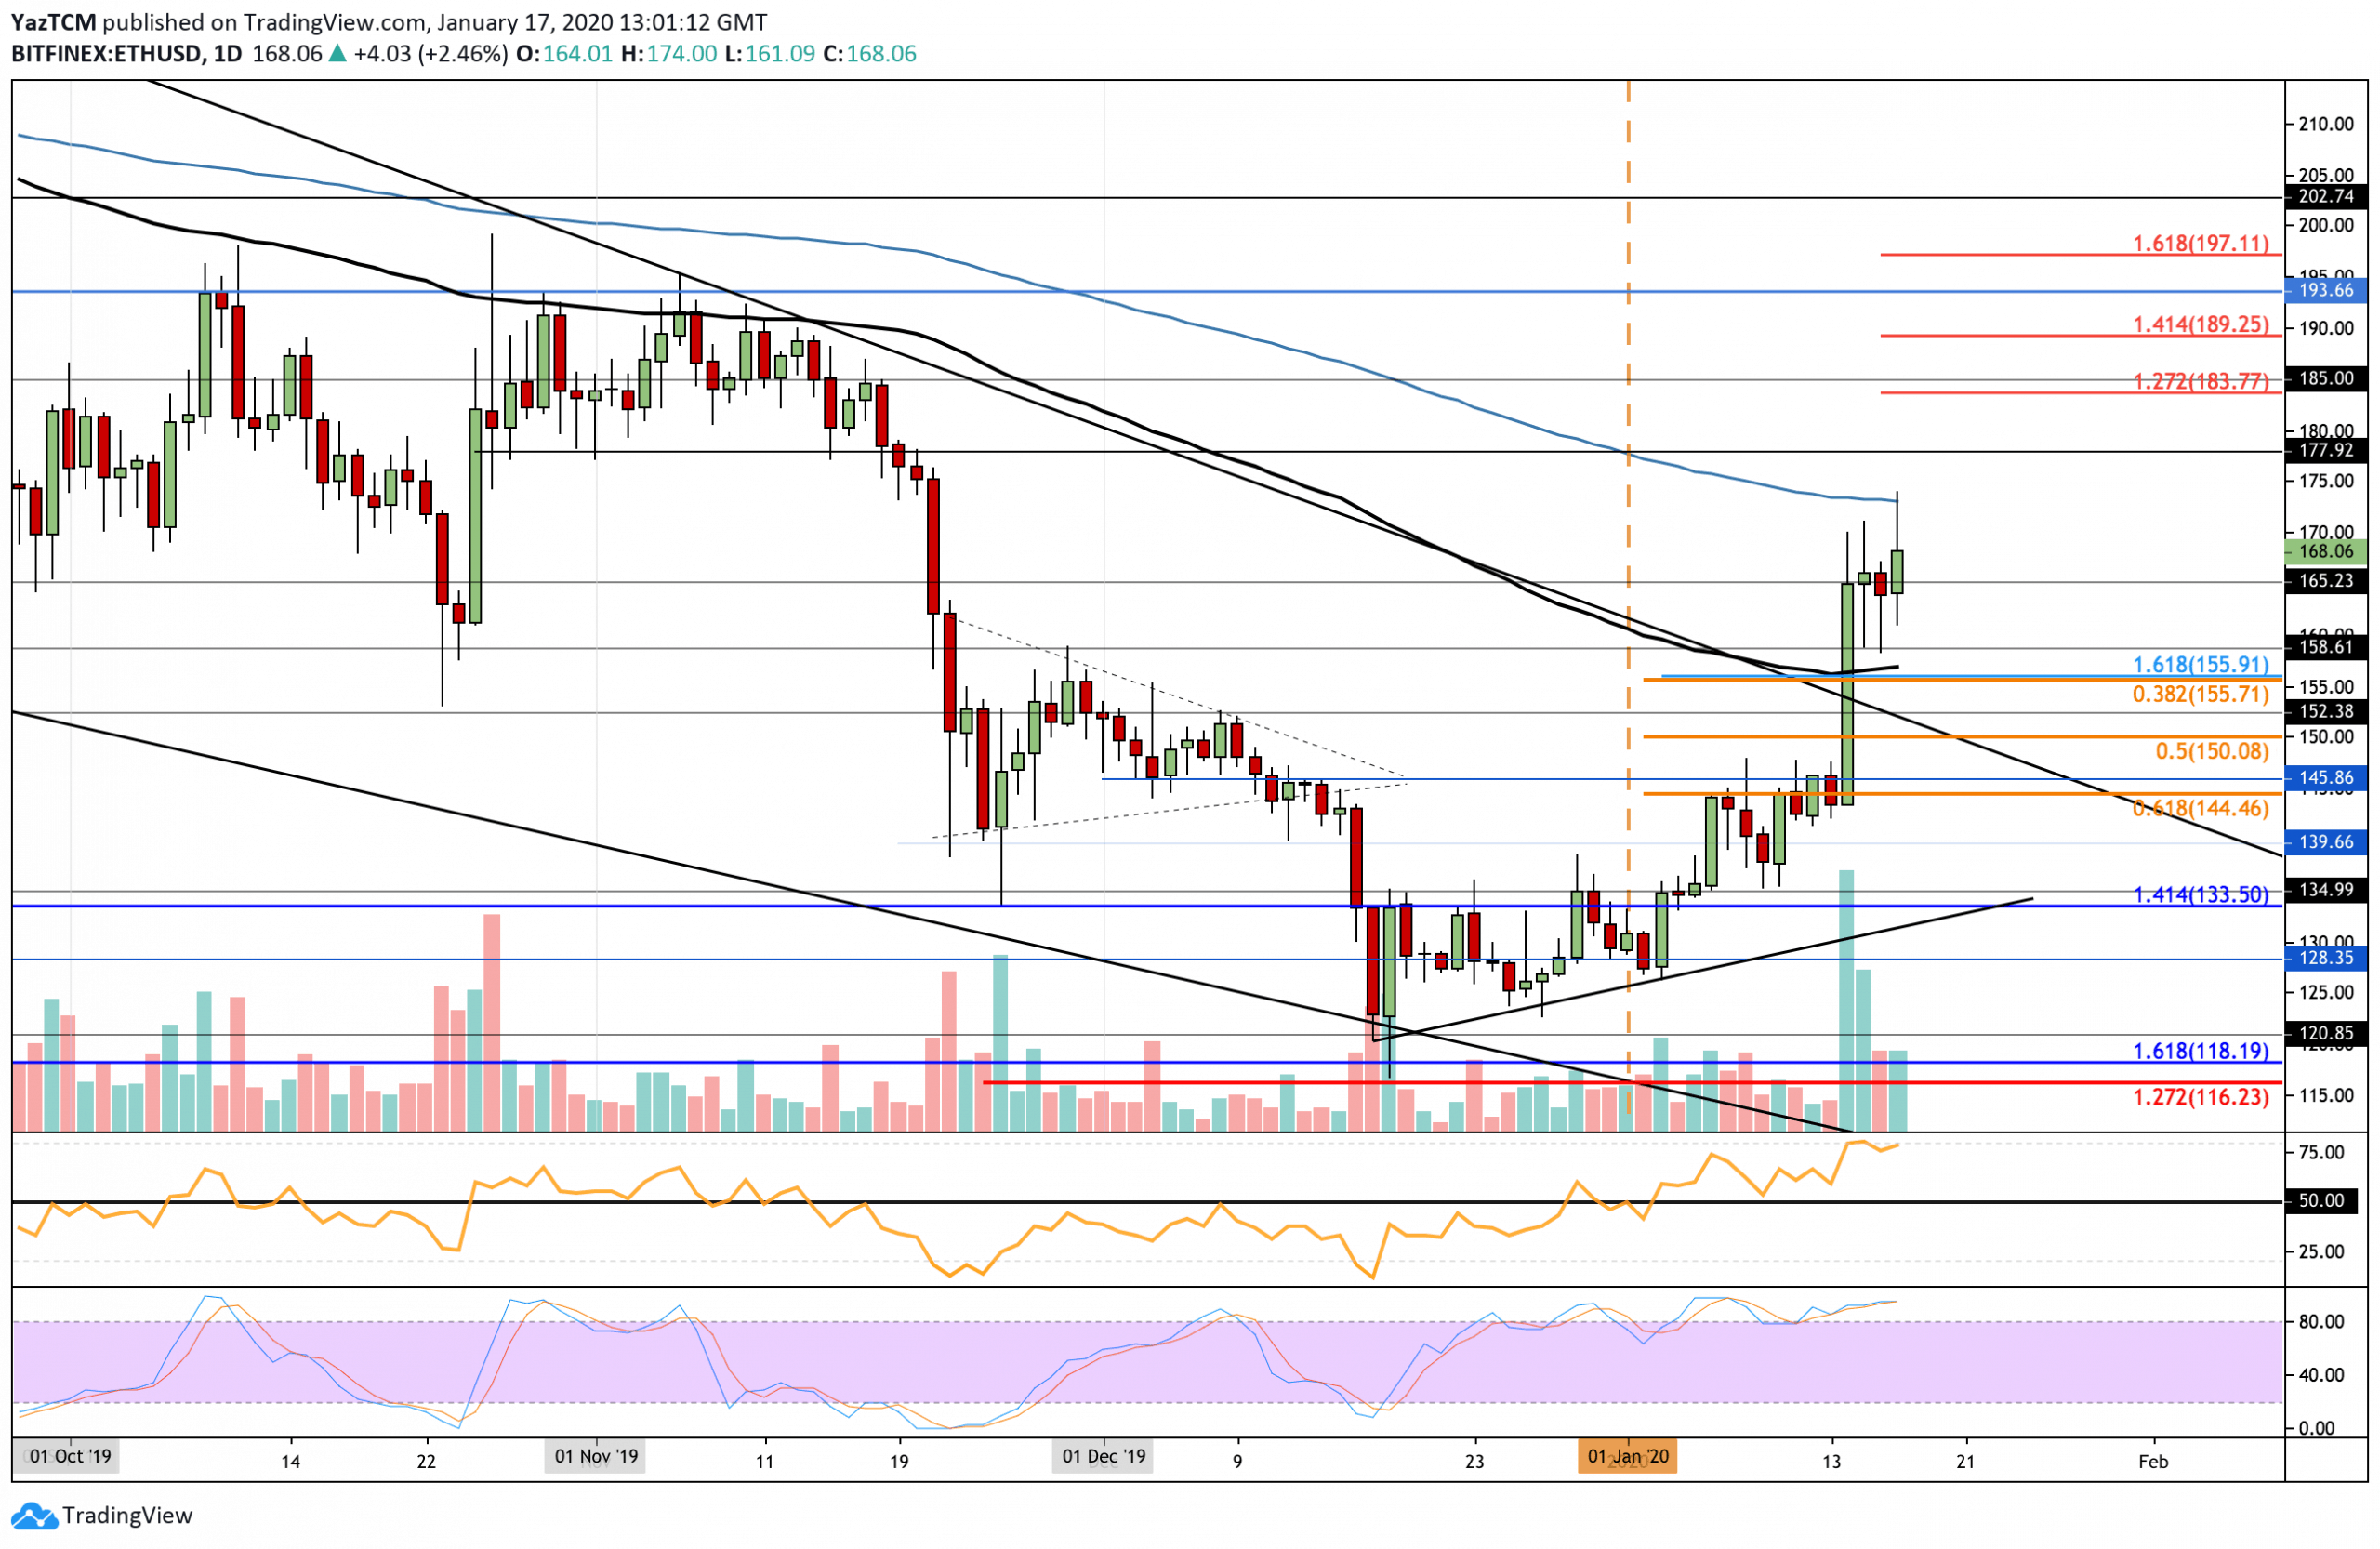
Ethereum surged by an epic 21% this week, which saw it breaking above strong resistance at $145 and continued to climb further higher above the 100-days EMA and into resistance provided by the 200-days EMA. This price hike has now turned Ethereum bullish after it broke above the December highs at $152. Ethereum would now need to fall beneath the support at $133.50 before it can turn bearish.
Moving forward, if the bulls continue to push higher, the first level of resistance to overcome lies directly at the 200-days EMA at around $175. Above this, resistance lies at $178 (November support), $183.77 (1.272 Fib Extension), $190 (1.414 Fib Extension), and $194 (November highs). Alternatively, if the sellers regroup and push ETH lower, initial support lies at $165 and $160. Beneath this, support lies at $155 (.382 Fib Retracement & 100-days EMA) and $150 (.5 Fibonacci Retracement).
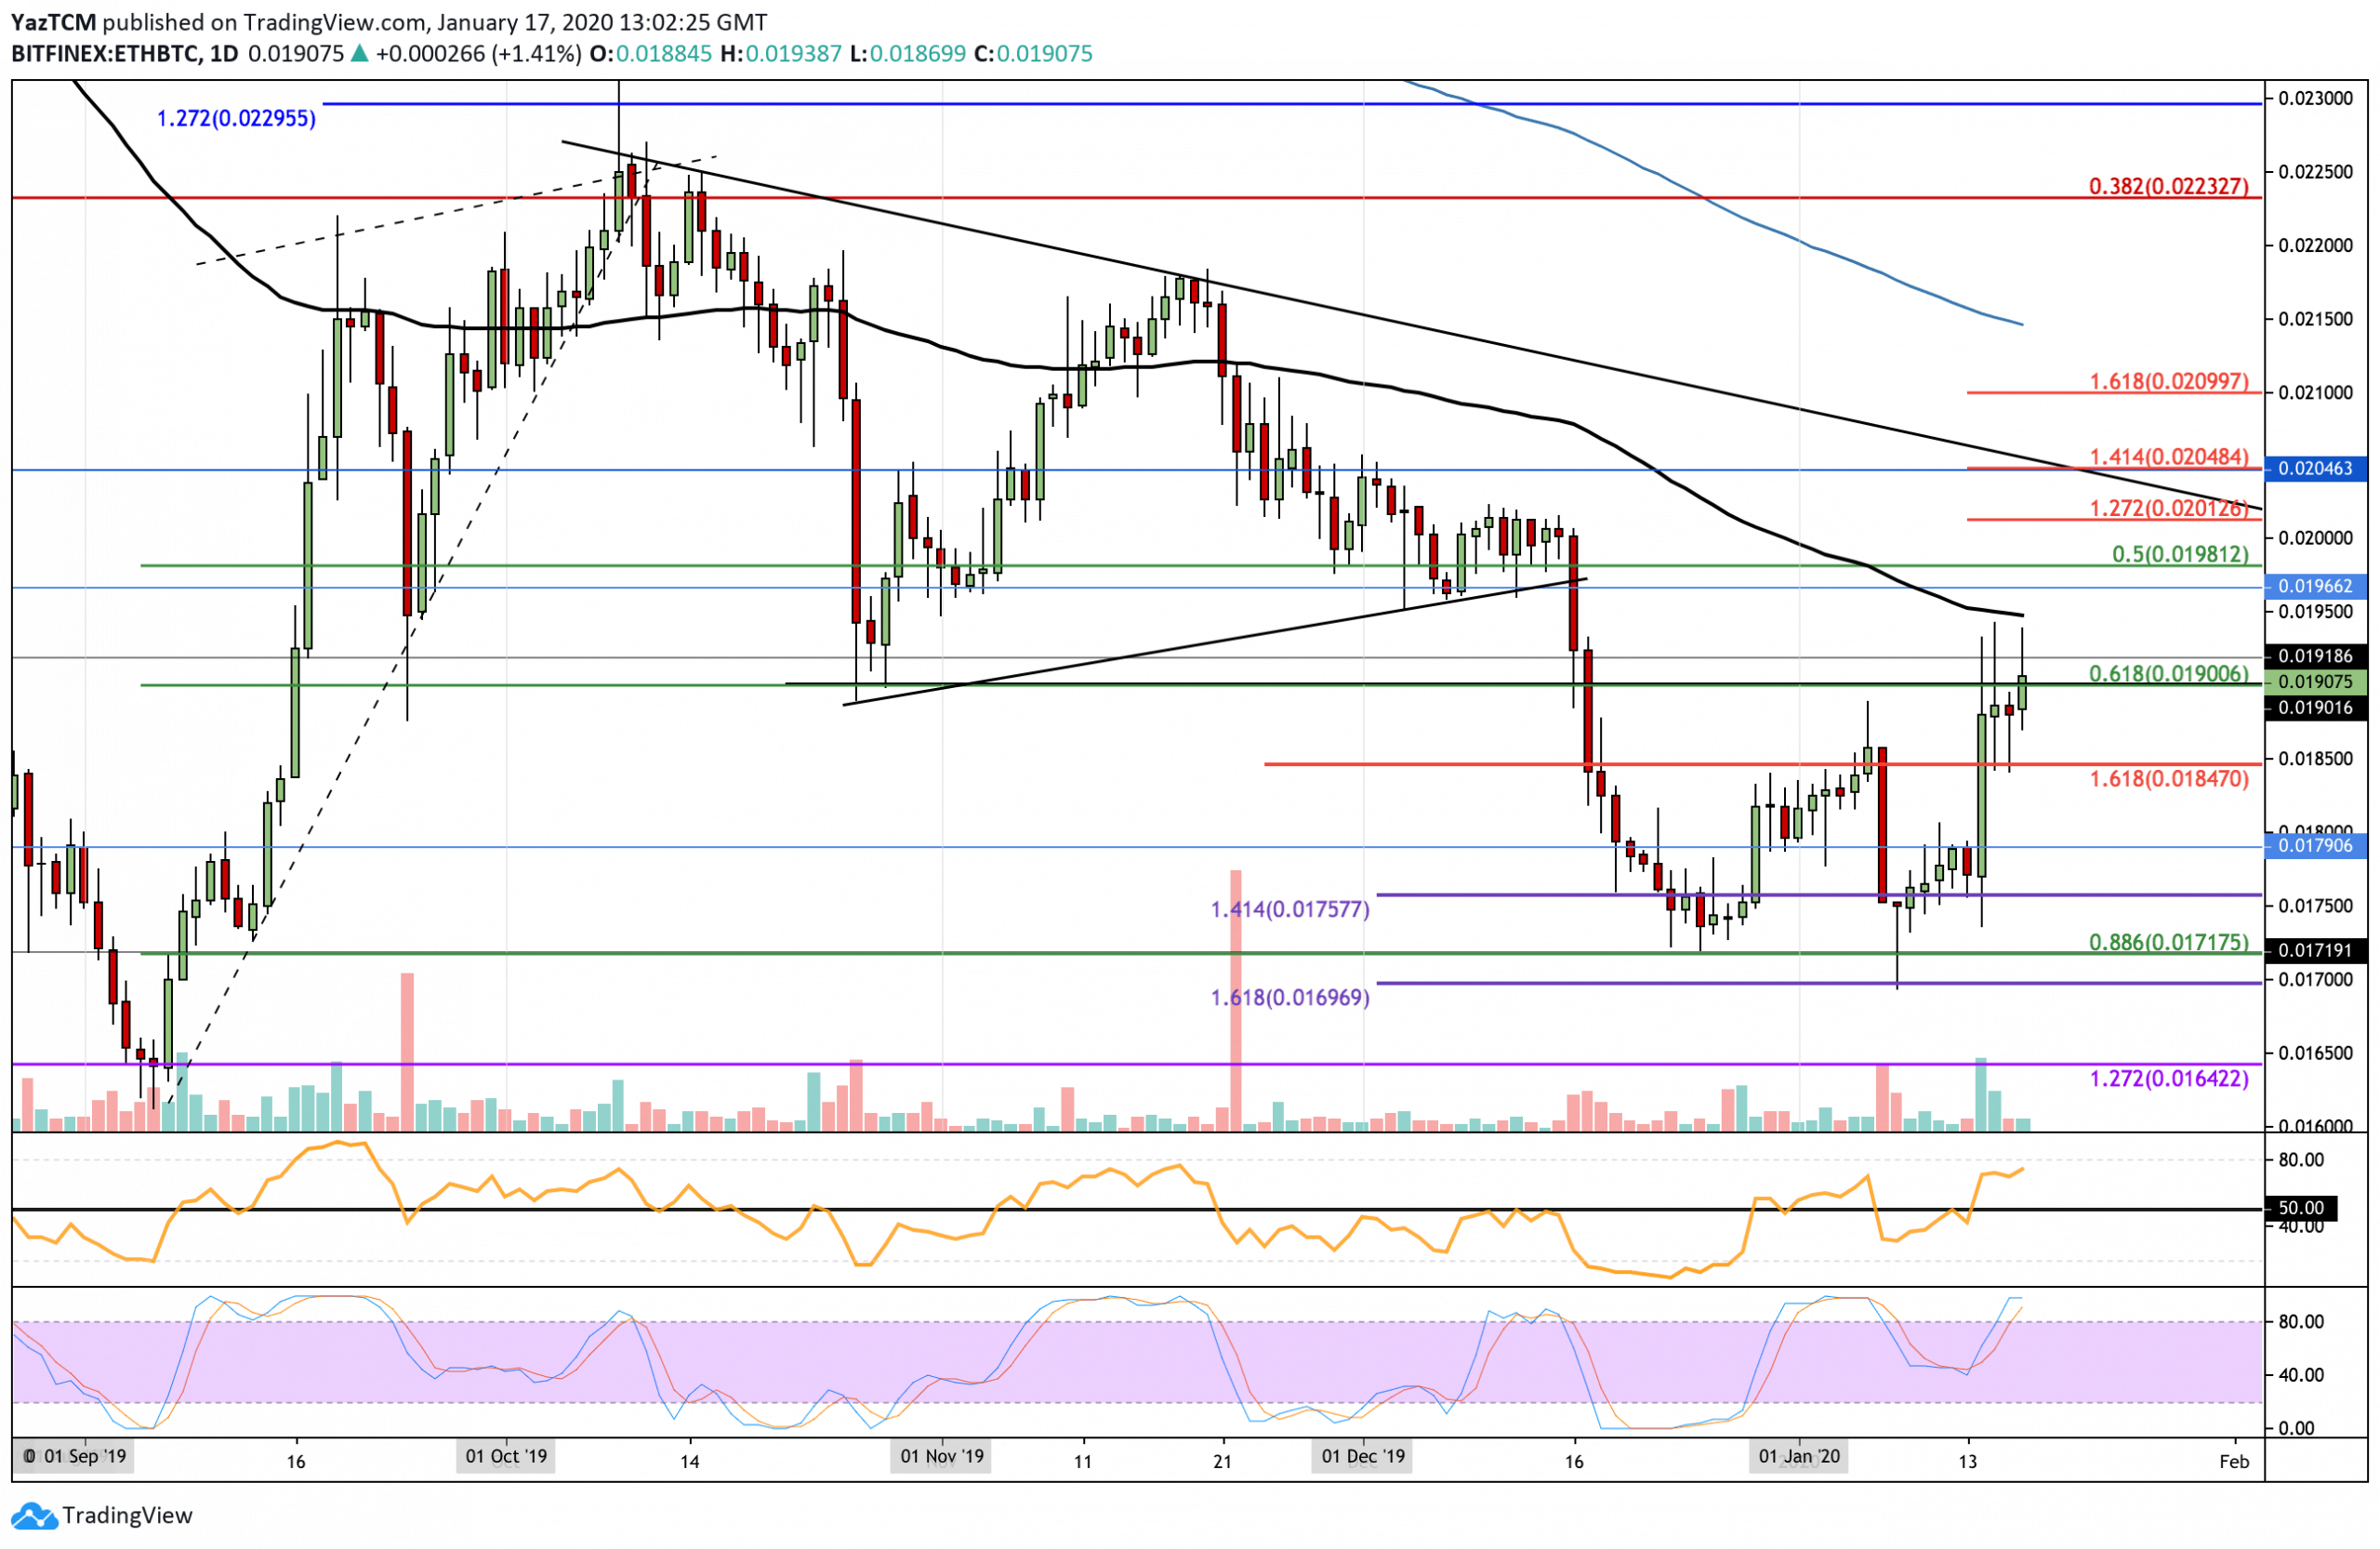
Against Bitcoin, ETH rebounded from the support at 0.0175 BTC and started to surge significantly. This price surge helped ETH to climb higher against the USD. It broke above the January 2020 resistance at 0.0185 BTC and continued higher to where it currently trades at 0.019 BTC.
If the bulls push ETH higher, the first level of resistance to crack lies at 0.0195 BTC, which is provided by the 100-days EMA. Above this, resistance lies at 0.02 BTC and 0.0204 BTC (1.414 Fibonacci Retracement & falling trend line resistance). On the other hand, if the sellers push ETH lower, support can be found at 0.0185 BTC, 0.018 BTC, and 0.0175 BTC.
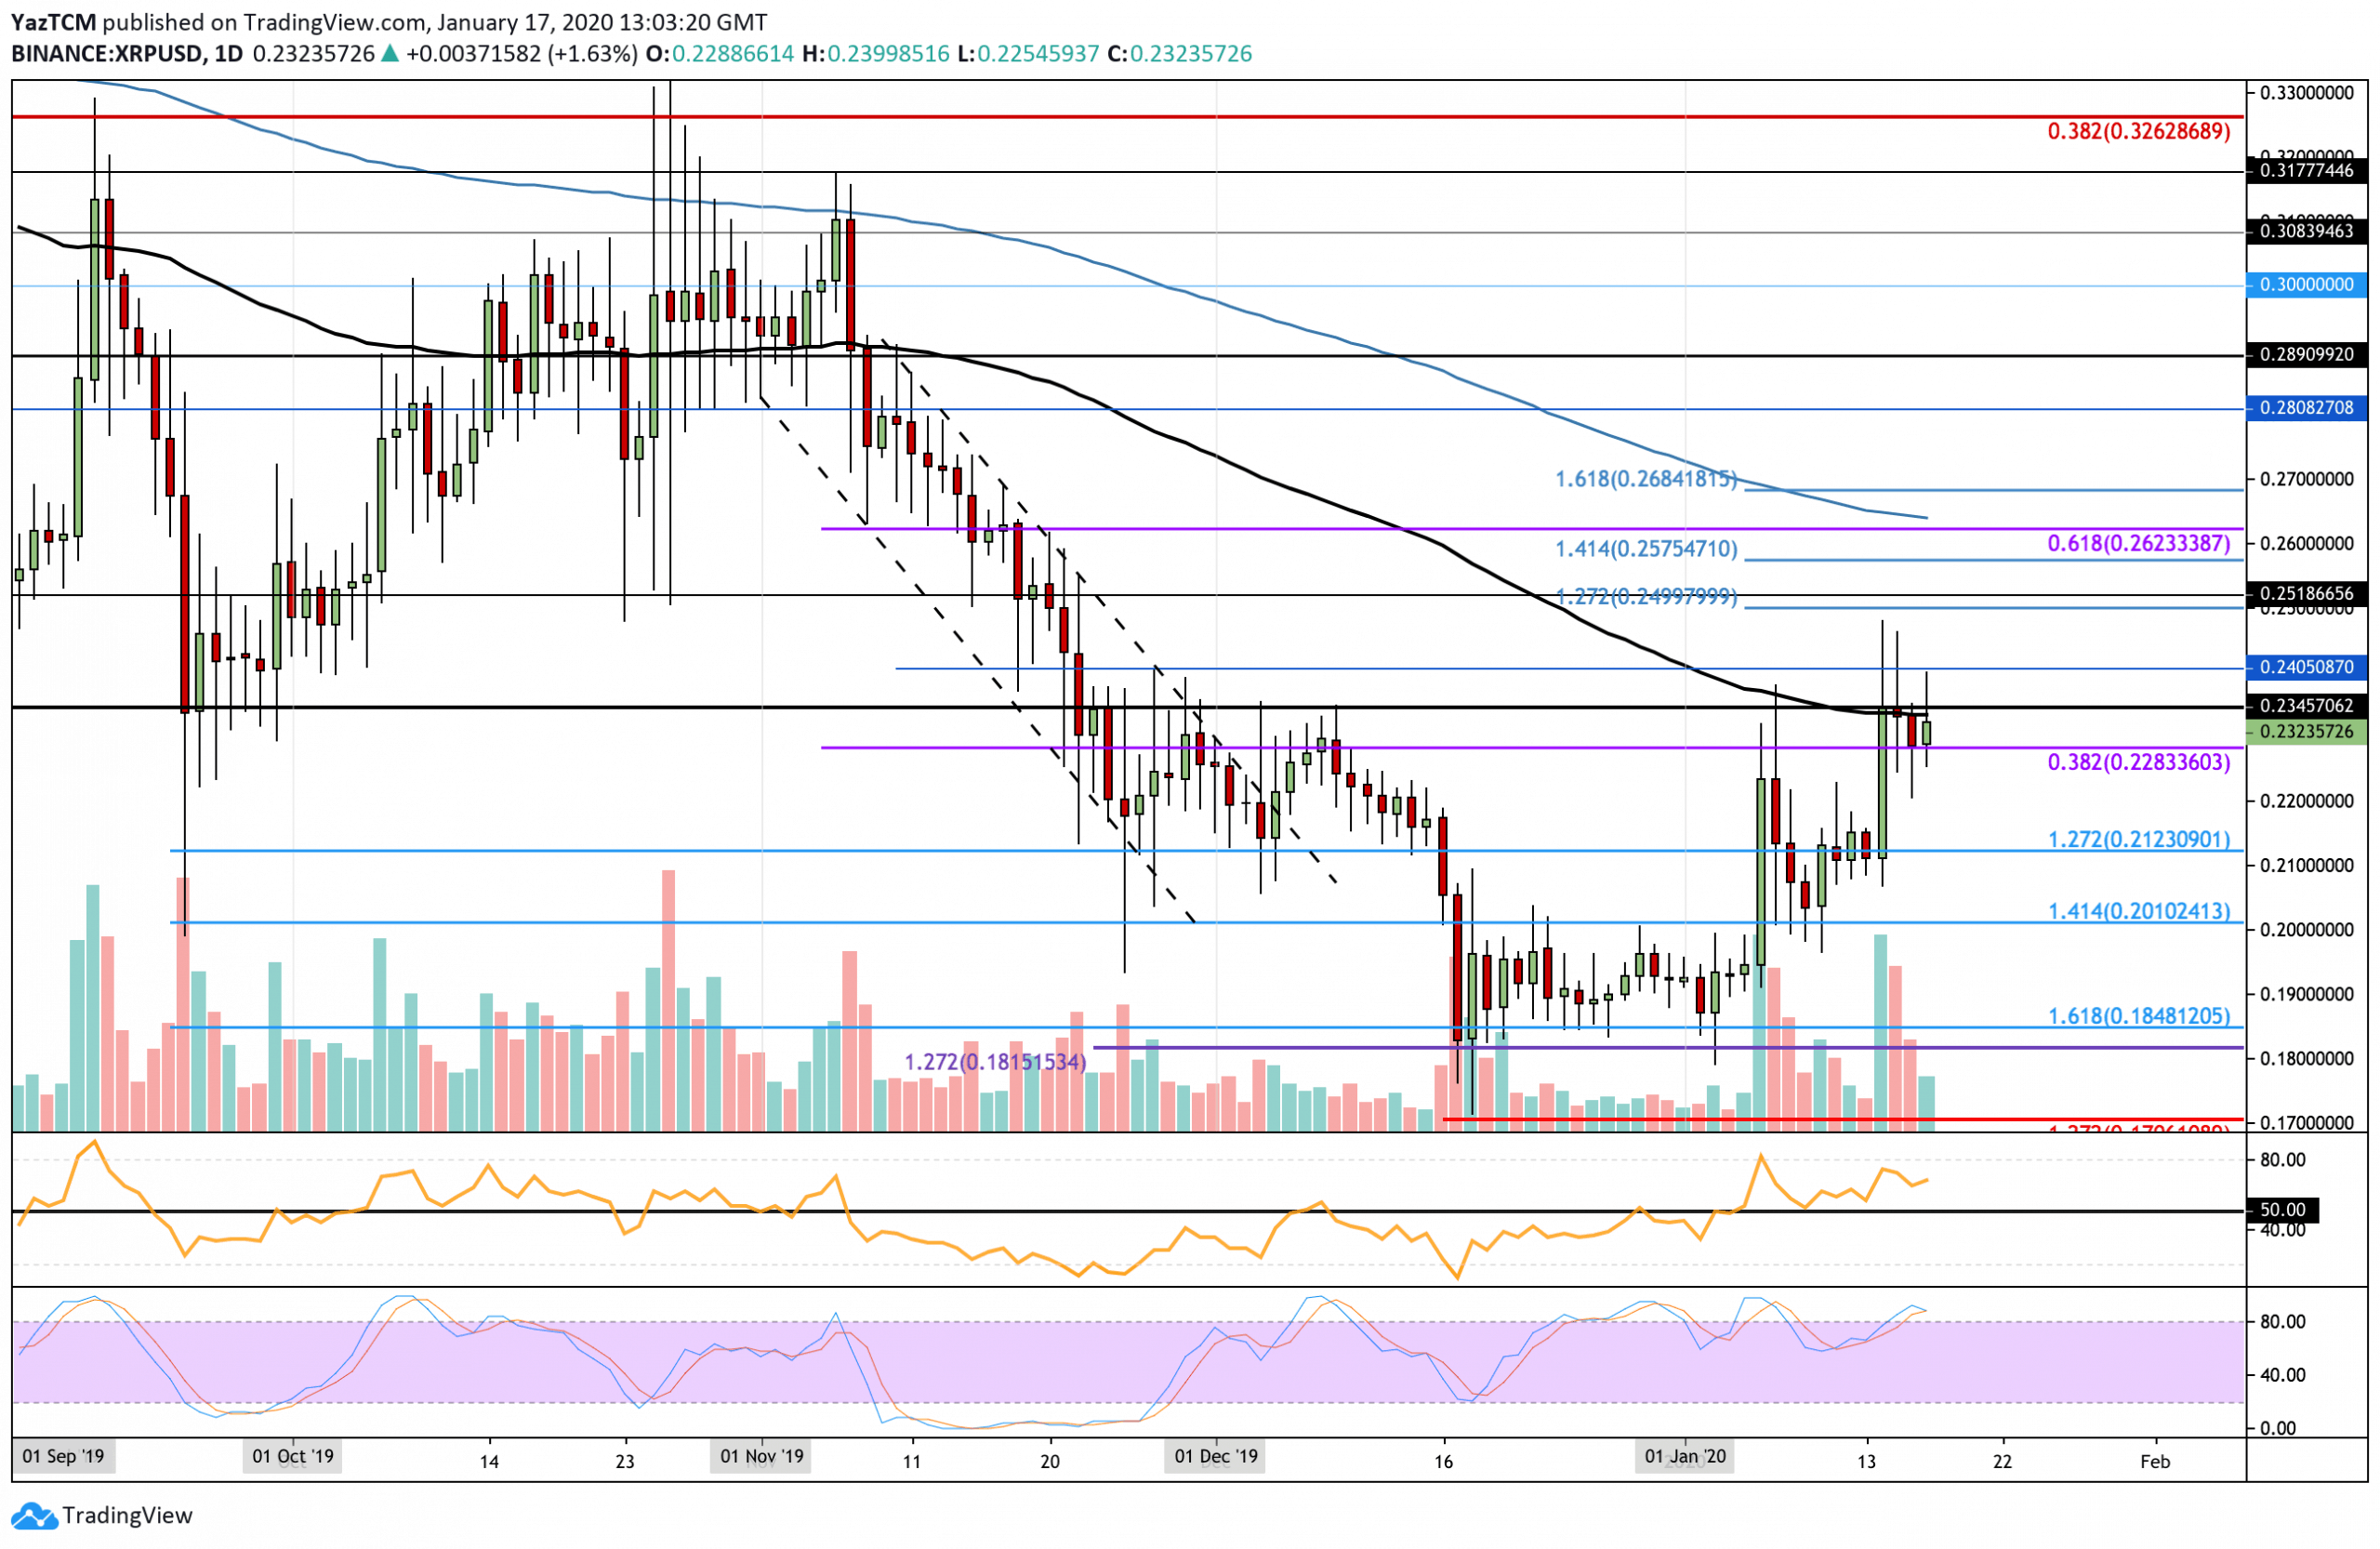
This week saw XRP increasing by a total of 13% as it passes resistance at $0.22 to reach the current trading level at $0.232. XRP bumped into resistance at the 100-days EMA at $0.234 but has struggled to overcome it over the past four days. XRP must overcome $0.234 before it can turn bullish in the short term. It would need to fall beneath $0.185 to turn bearish.
If the bulls are successful in breaking above $0.234, immediate higher resistance lies at $0.24. Above this, resistance is located at $0.25, $0.262 (bearish .618 Fib Retracement & 200-days EMA), and $0.268 (1.618 Fib Extension). On the other hand, if the sellers push XRP lower, support lies at $0.228, $0.22, $0.212, and $0.20.
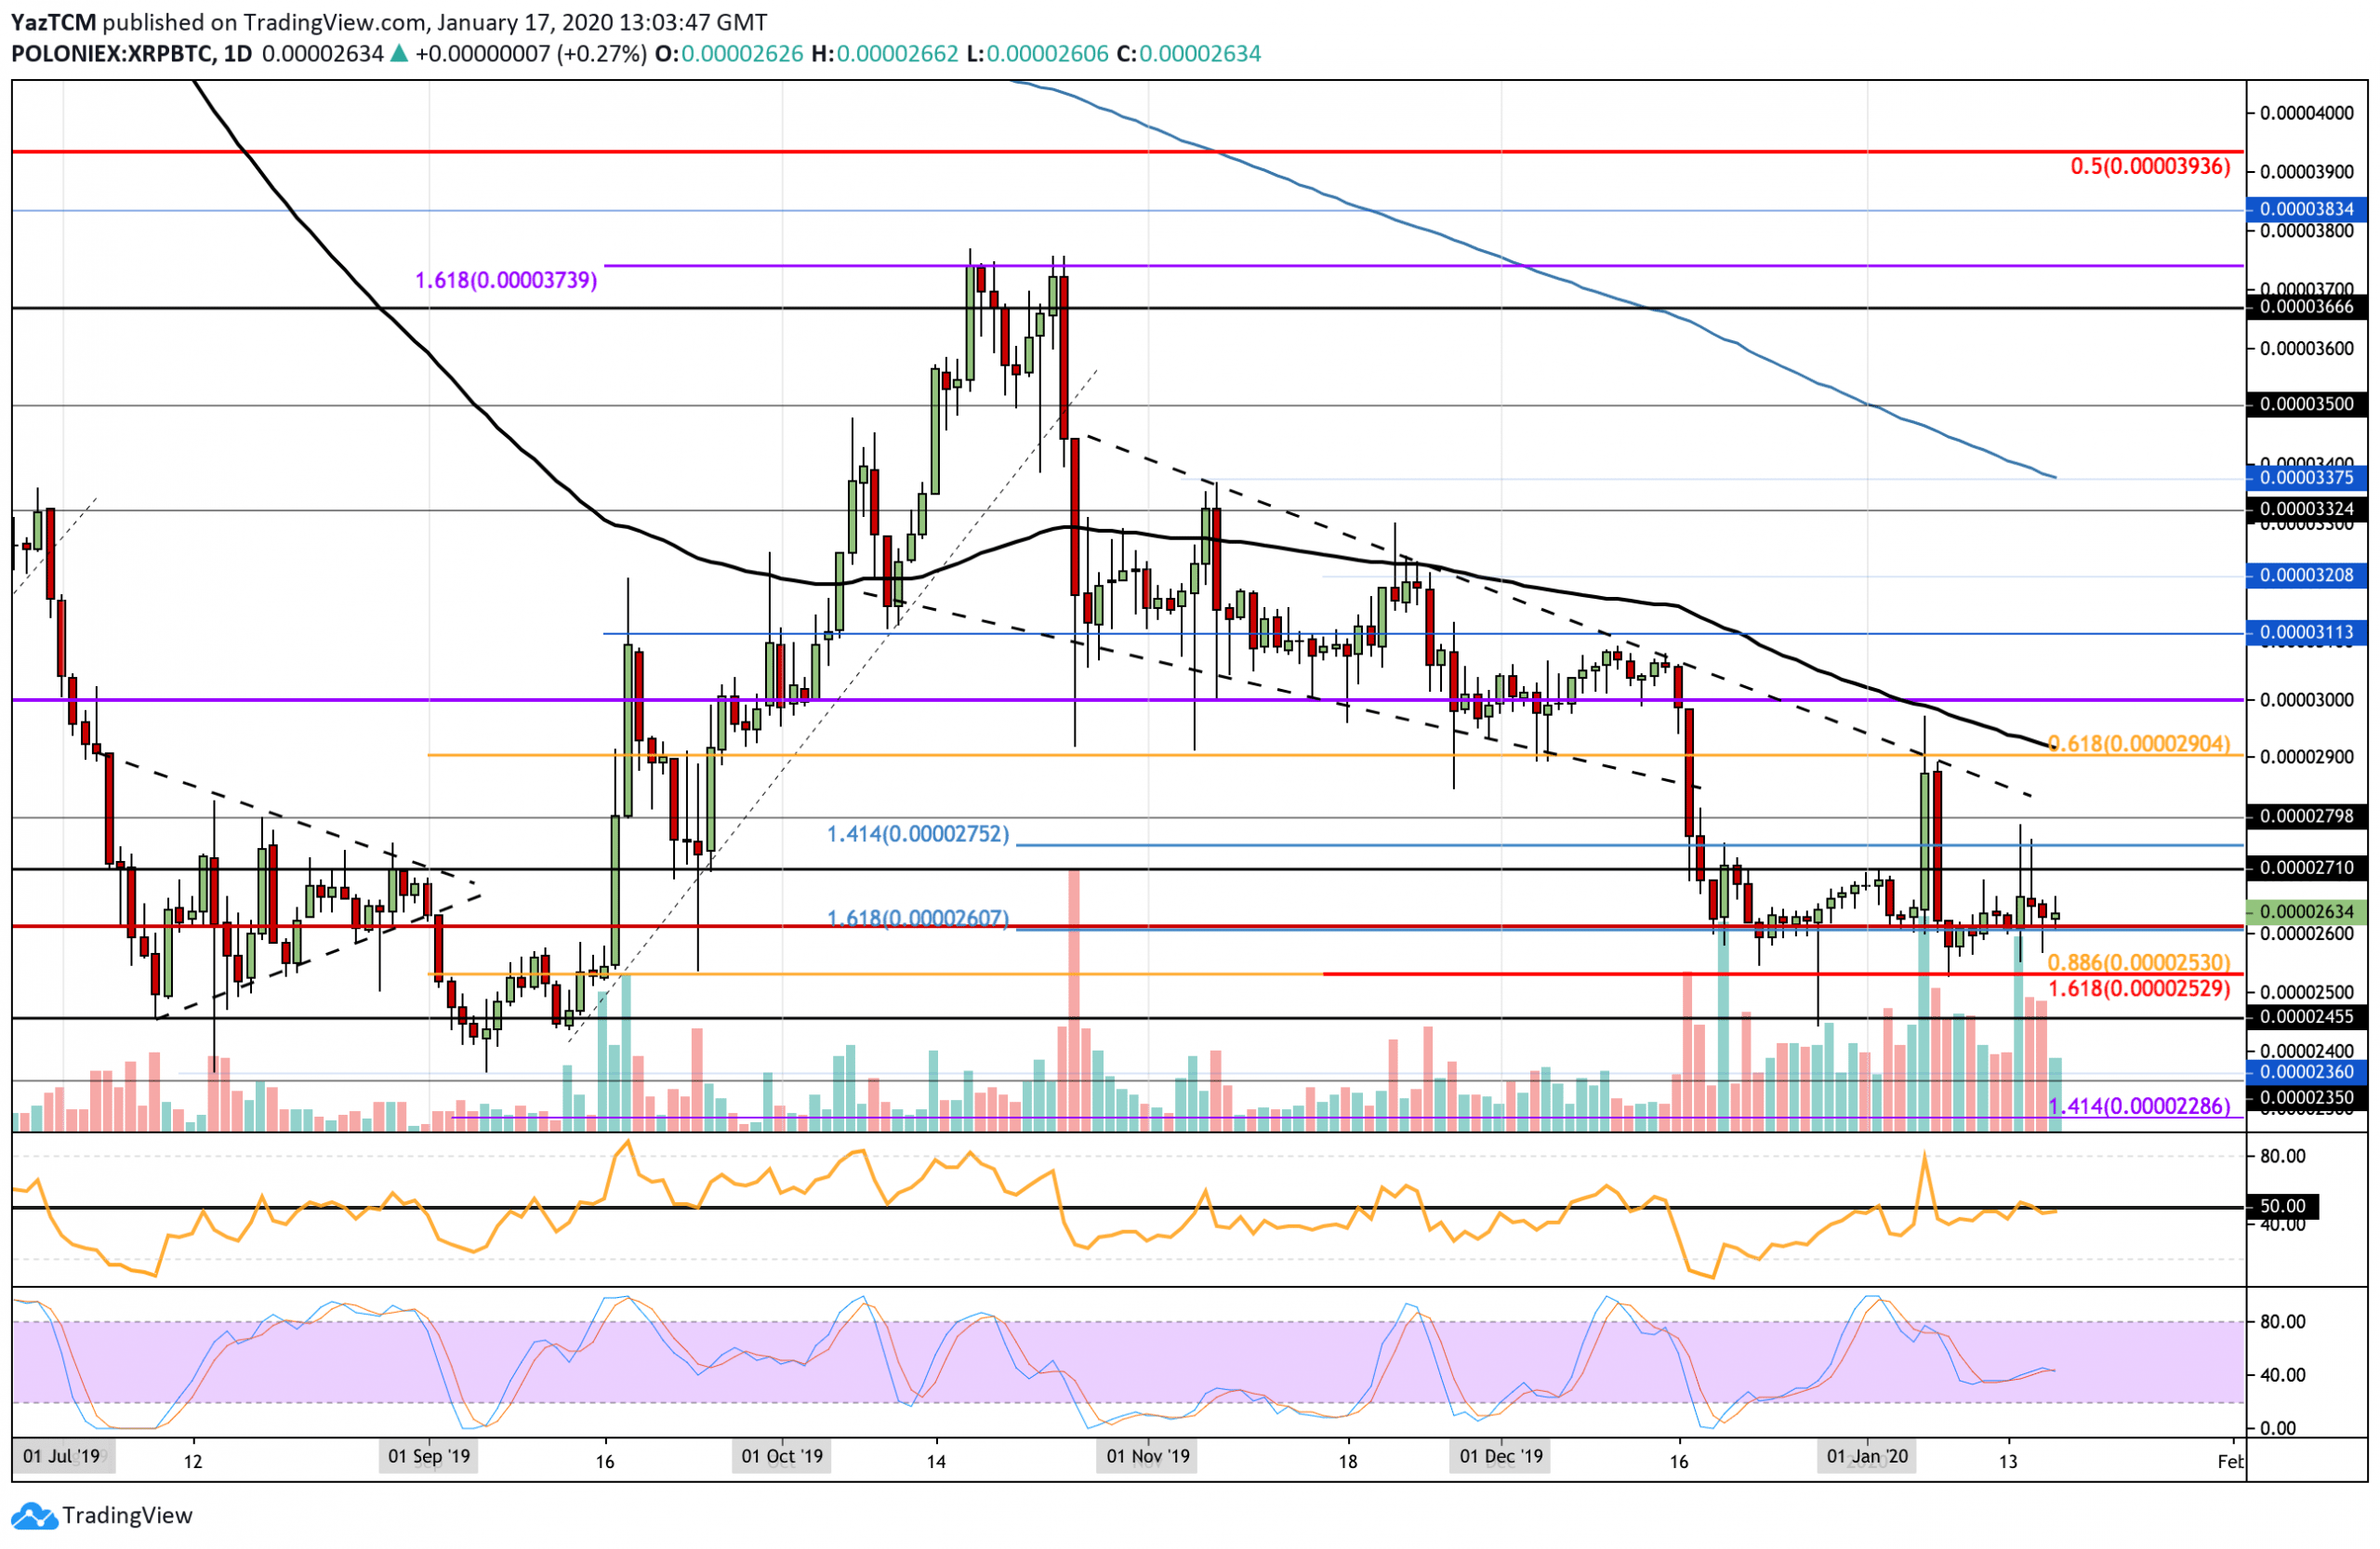
Against BTC, XRP continues to trend sideways between 2600 SAT and 2700 SAT. It has broken briefly beneath 2600 SAT but managed to rise back above each time. The RSI has been trading sideways along with the 50 level, which indicates the indecision within the market. XRP must break this trading range to dictate the next direction. If XRP were to drop beneath the support at 2350 SAT, it would turn bearish.
Looking ahead, if the sellers push XRP beneath 2600 SAT, immediate support beneath is located at 2350 SAT (.886 Fibonacci Retracement level). Beneath this, support lies at 2455 SAT, 2400 SAT, and 2360 SAT. On the other hand, if the bulls regroup and push XRP higher, immediate resistance lies at 2710 SAT. Above this, resistance lies at 2800 SAT, 2900 SAT, and 3000 SAT.
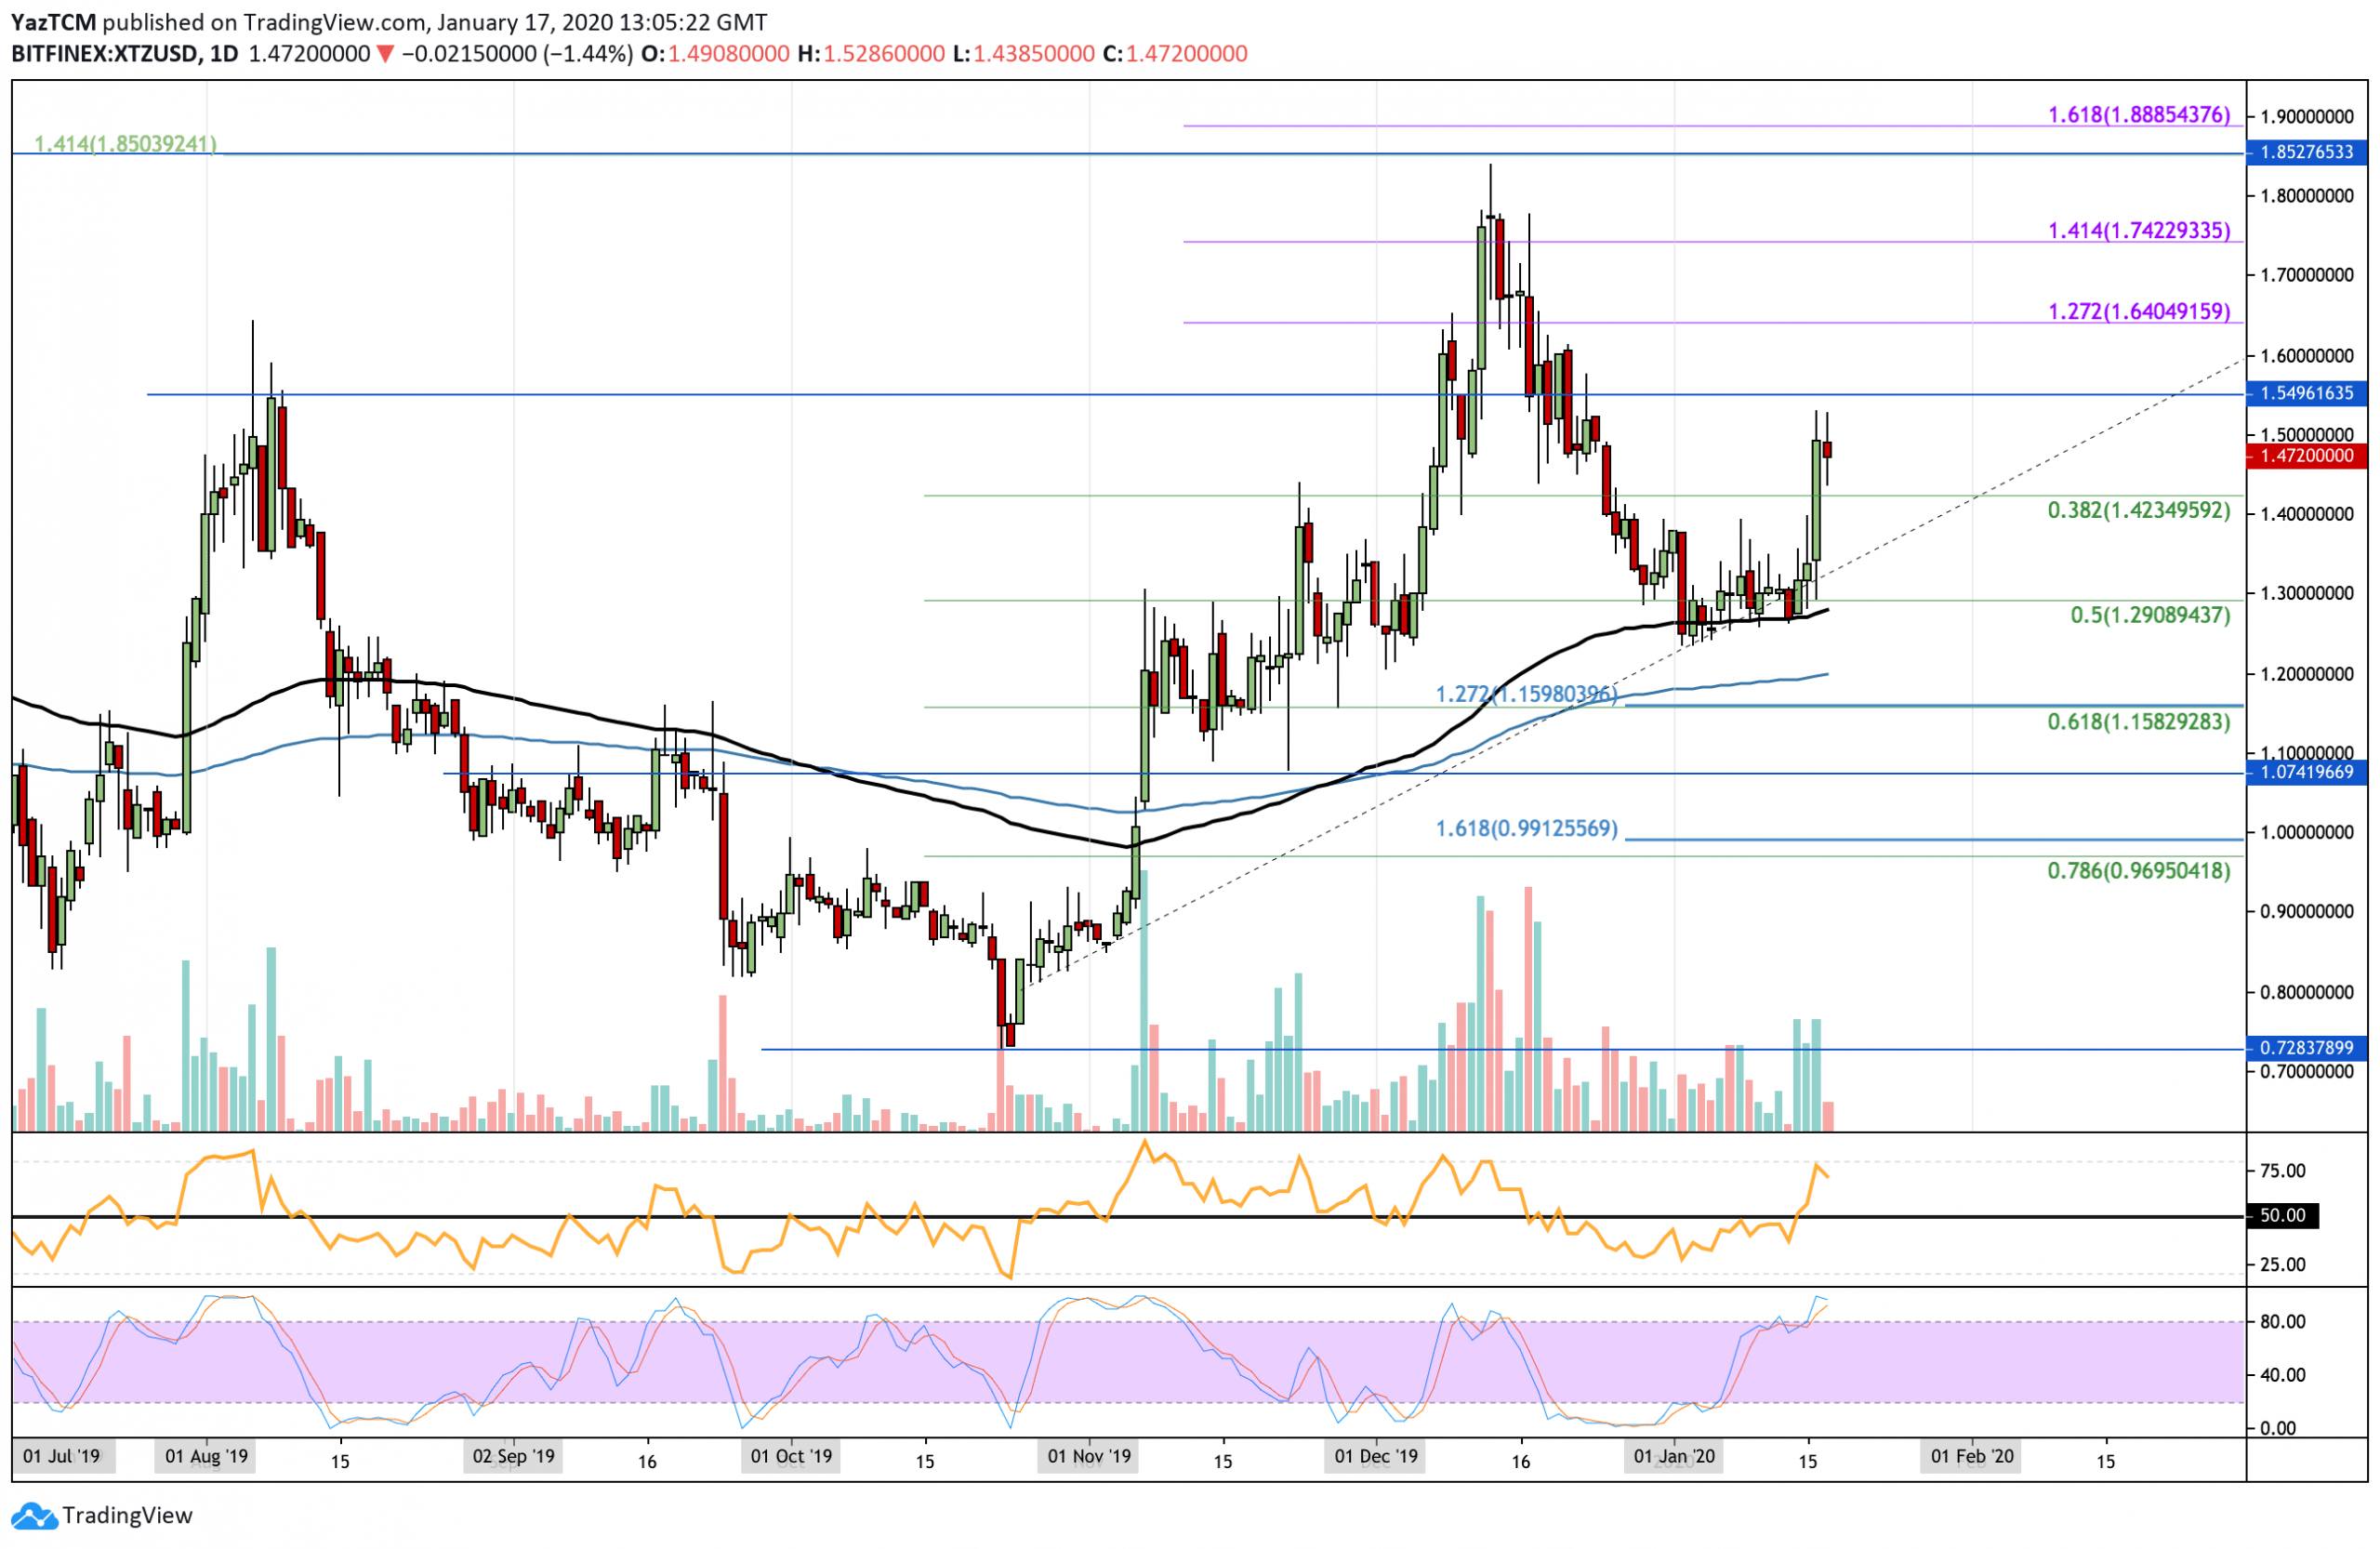
Tezos saw an impressive 12% surge over the past 24 hours alone as it climbs higher to reach the $1.50 level. The cryptocurrency fell during December to find support at the 100-days EMA in January 2020. It traded sideways at this support for the majority of January but witnessed the price surge over the past 24 hours. Tezos remains within a neutral condition until it can break above the December highs at around $1.80. It would need to collapse beneath the support at $1.20 before turning bearish.
Looking ahead, if the bulls continue to push XTZ beyond $1.50, higher resistance lies at $1.64, $1.72, and $1.85. On the other hand, if the sellers step in and push Tezos lower, support can be found at $1.42, $1.30 (100-days EMA), and $1.20 (200-days EMA).
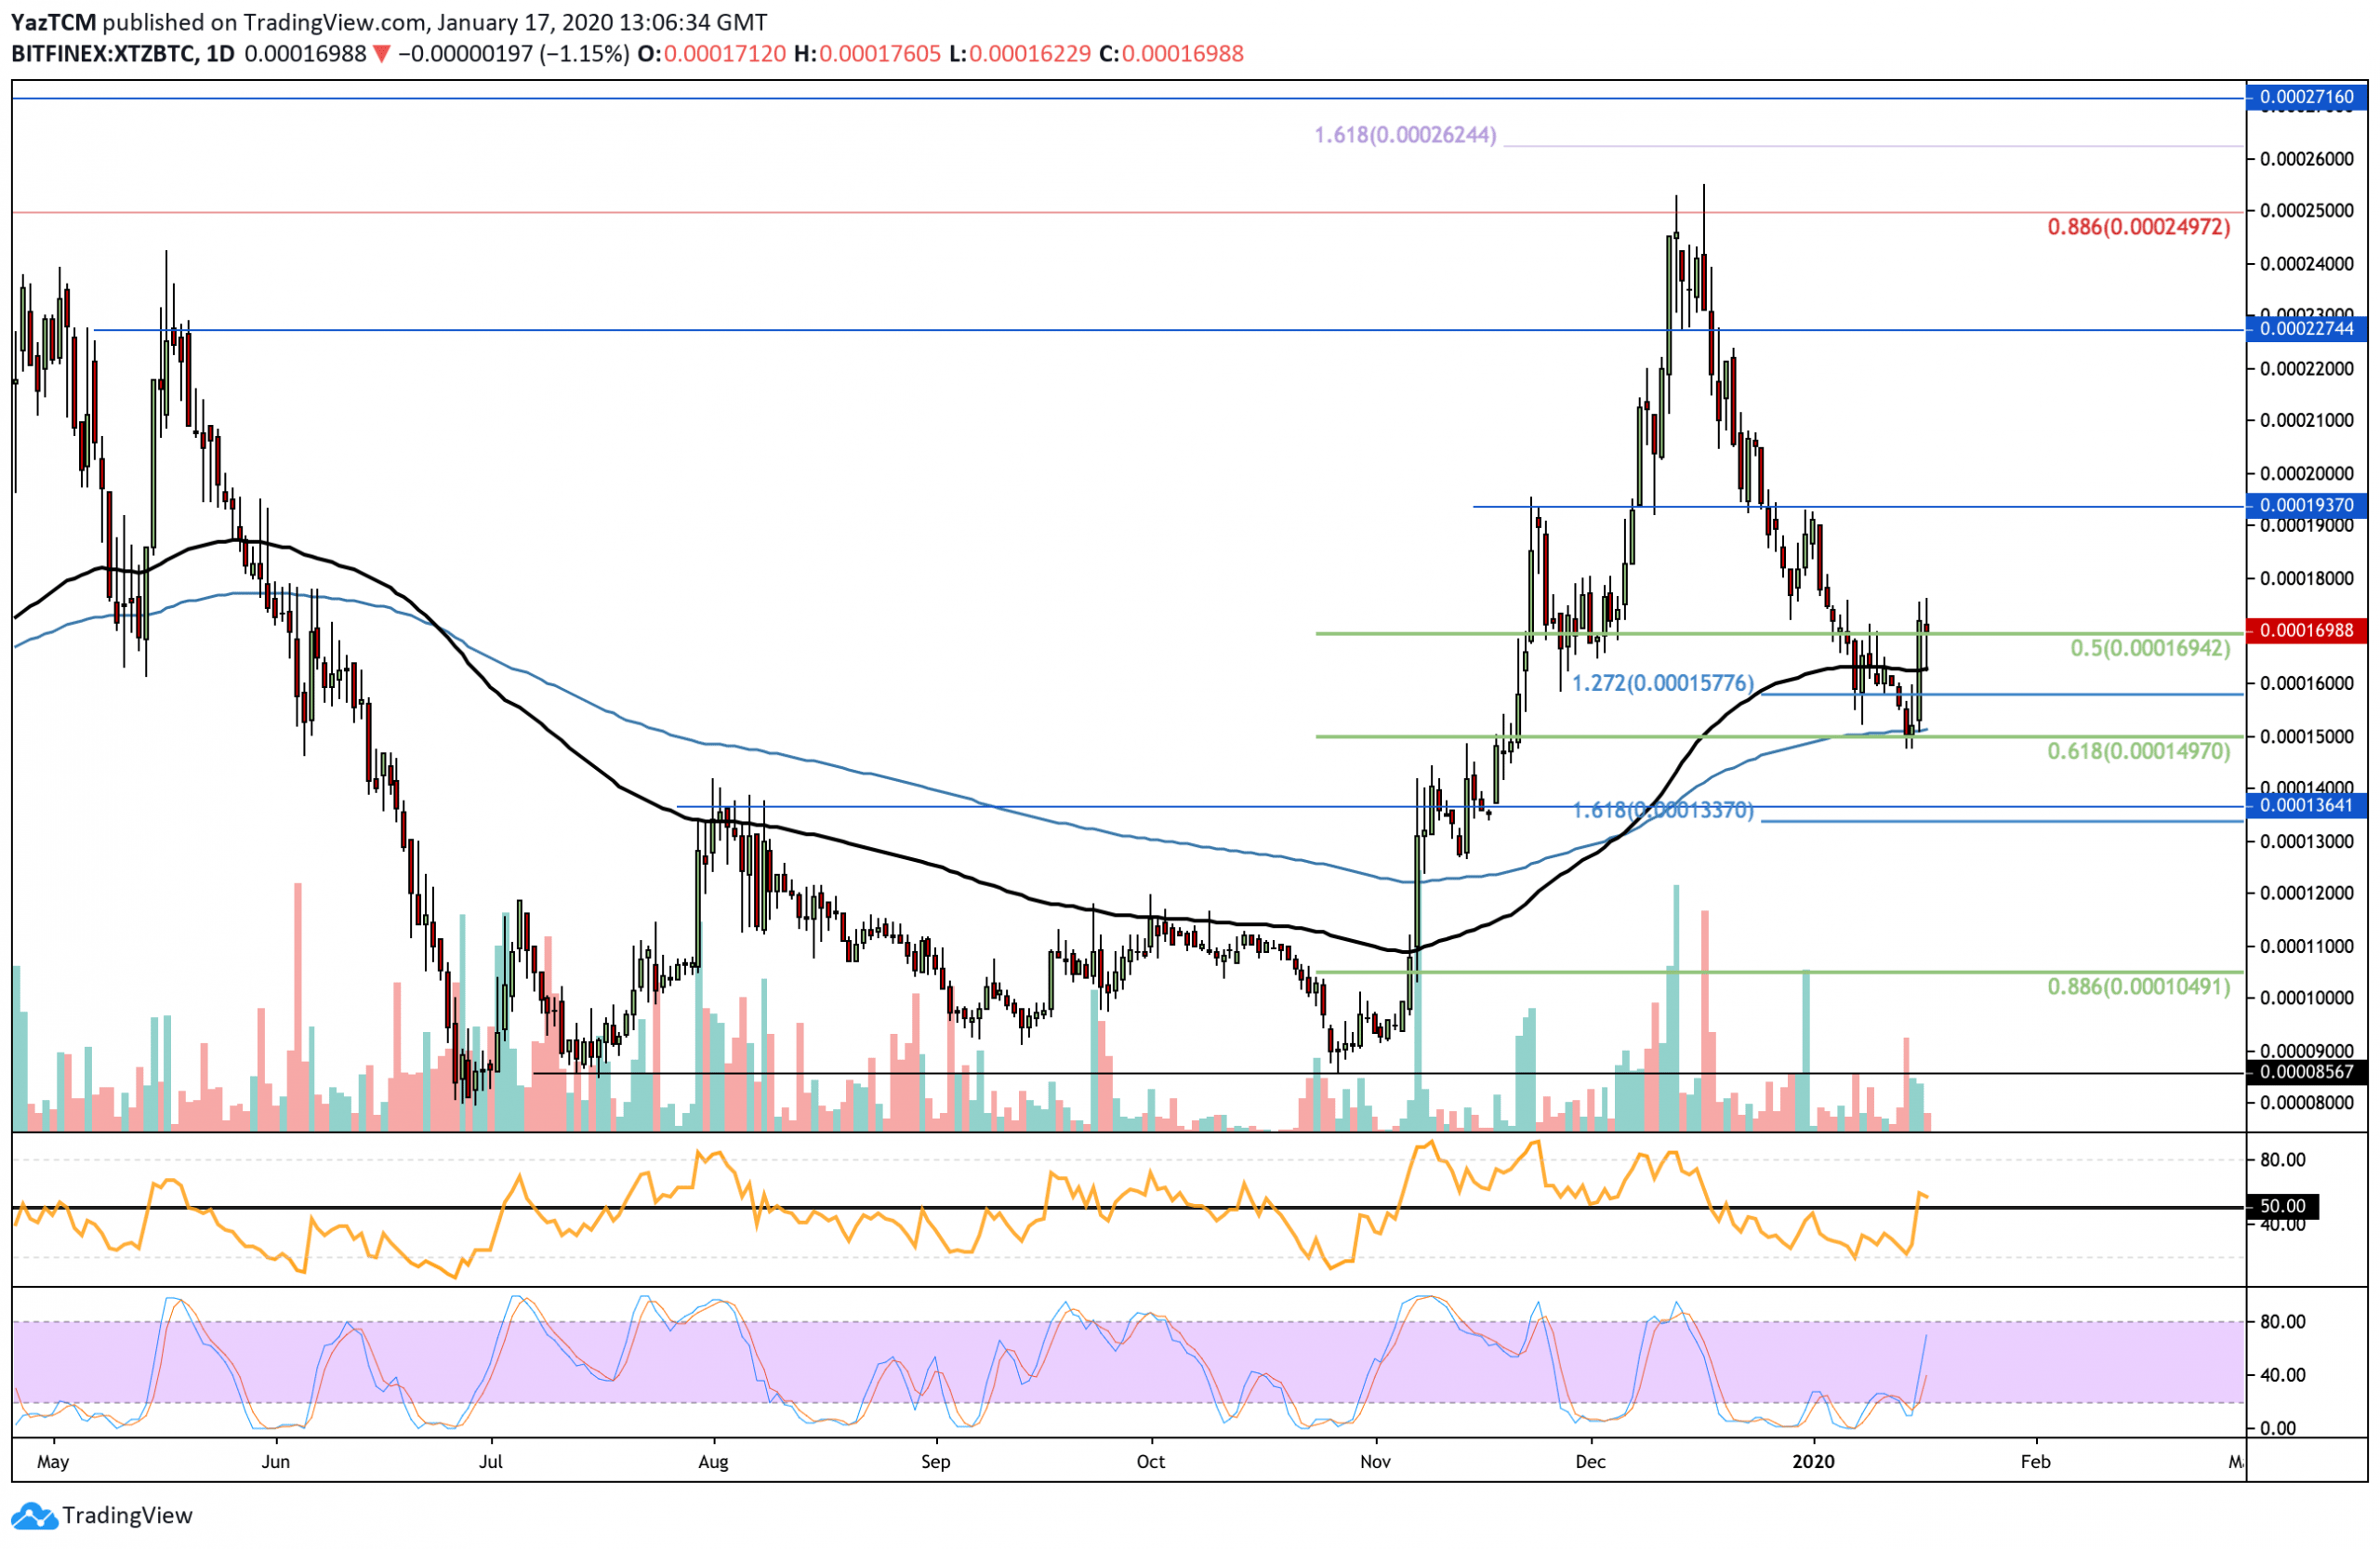
Against BTC, Tezos was also falling during December and January until support was recently found at the 200-days EMA at around 0.00015 BTC. This area of support was further bolstered by the .618 Fibonacci Retracement level. Tezos rebounded from this area of support over the past 24 hours as it climbed toward the 0.00017 BTC level.
If the buyers continue to push Tezos above 0.00017 BTC, higher resistance lies at 0.00018 BTC and 0,0193 BTC. If the bulls continue to drive XTZ above 0.0002 BTC, resistance is expected at 0.00021 BTC and 0.00022 BTC. On the other hand, if the sellers push Tezos lower, support can be expected at 0.000165 BTC (100-days EMA), 0.000157 BTC, and 0.000149 BTC (.618 Fib Retracement & 200-days EMA).
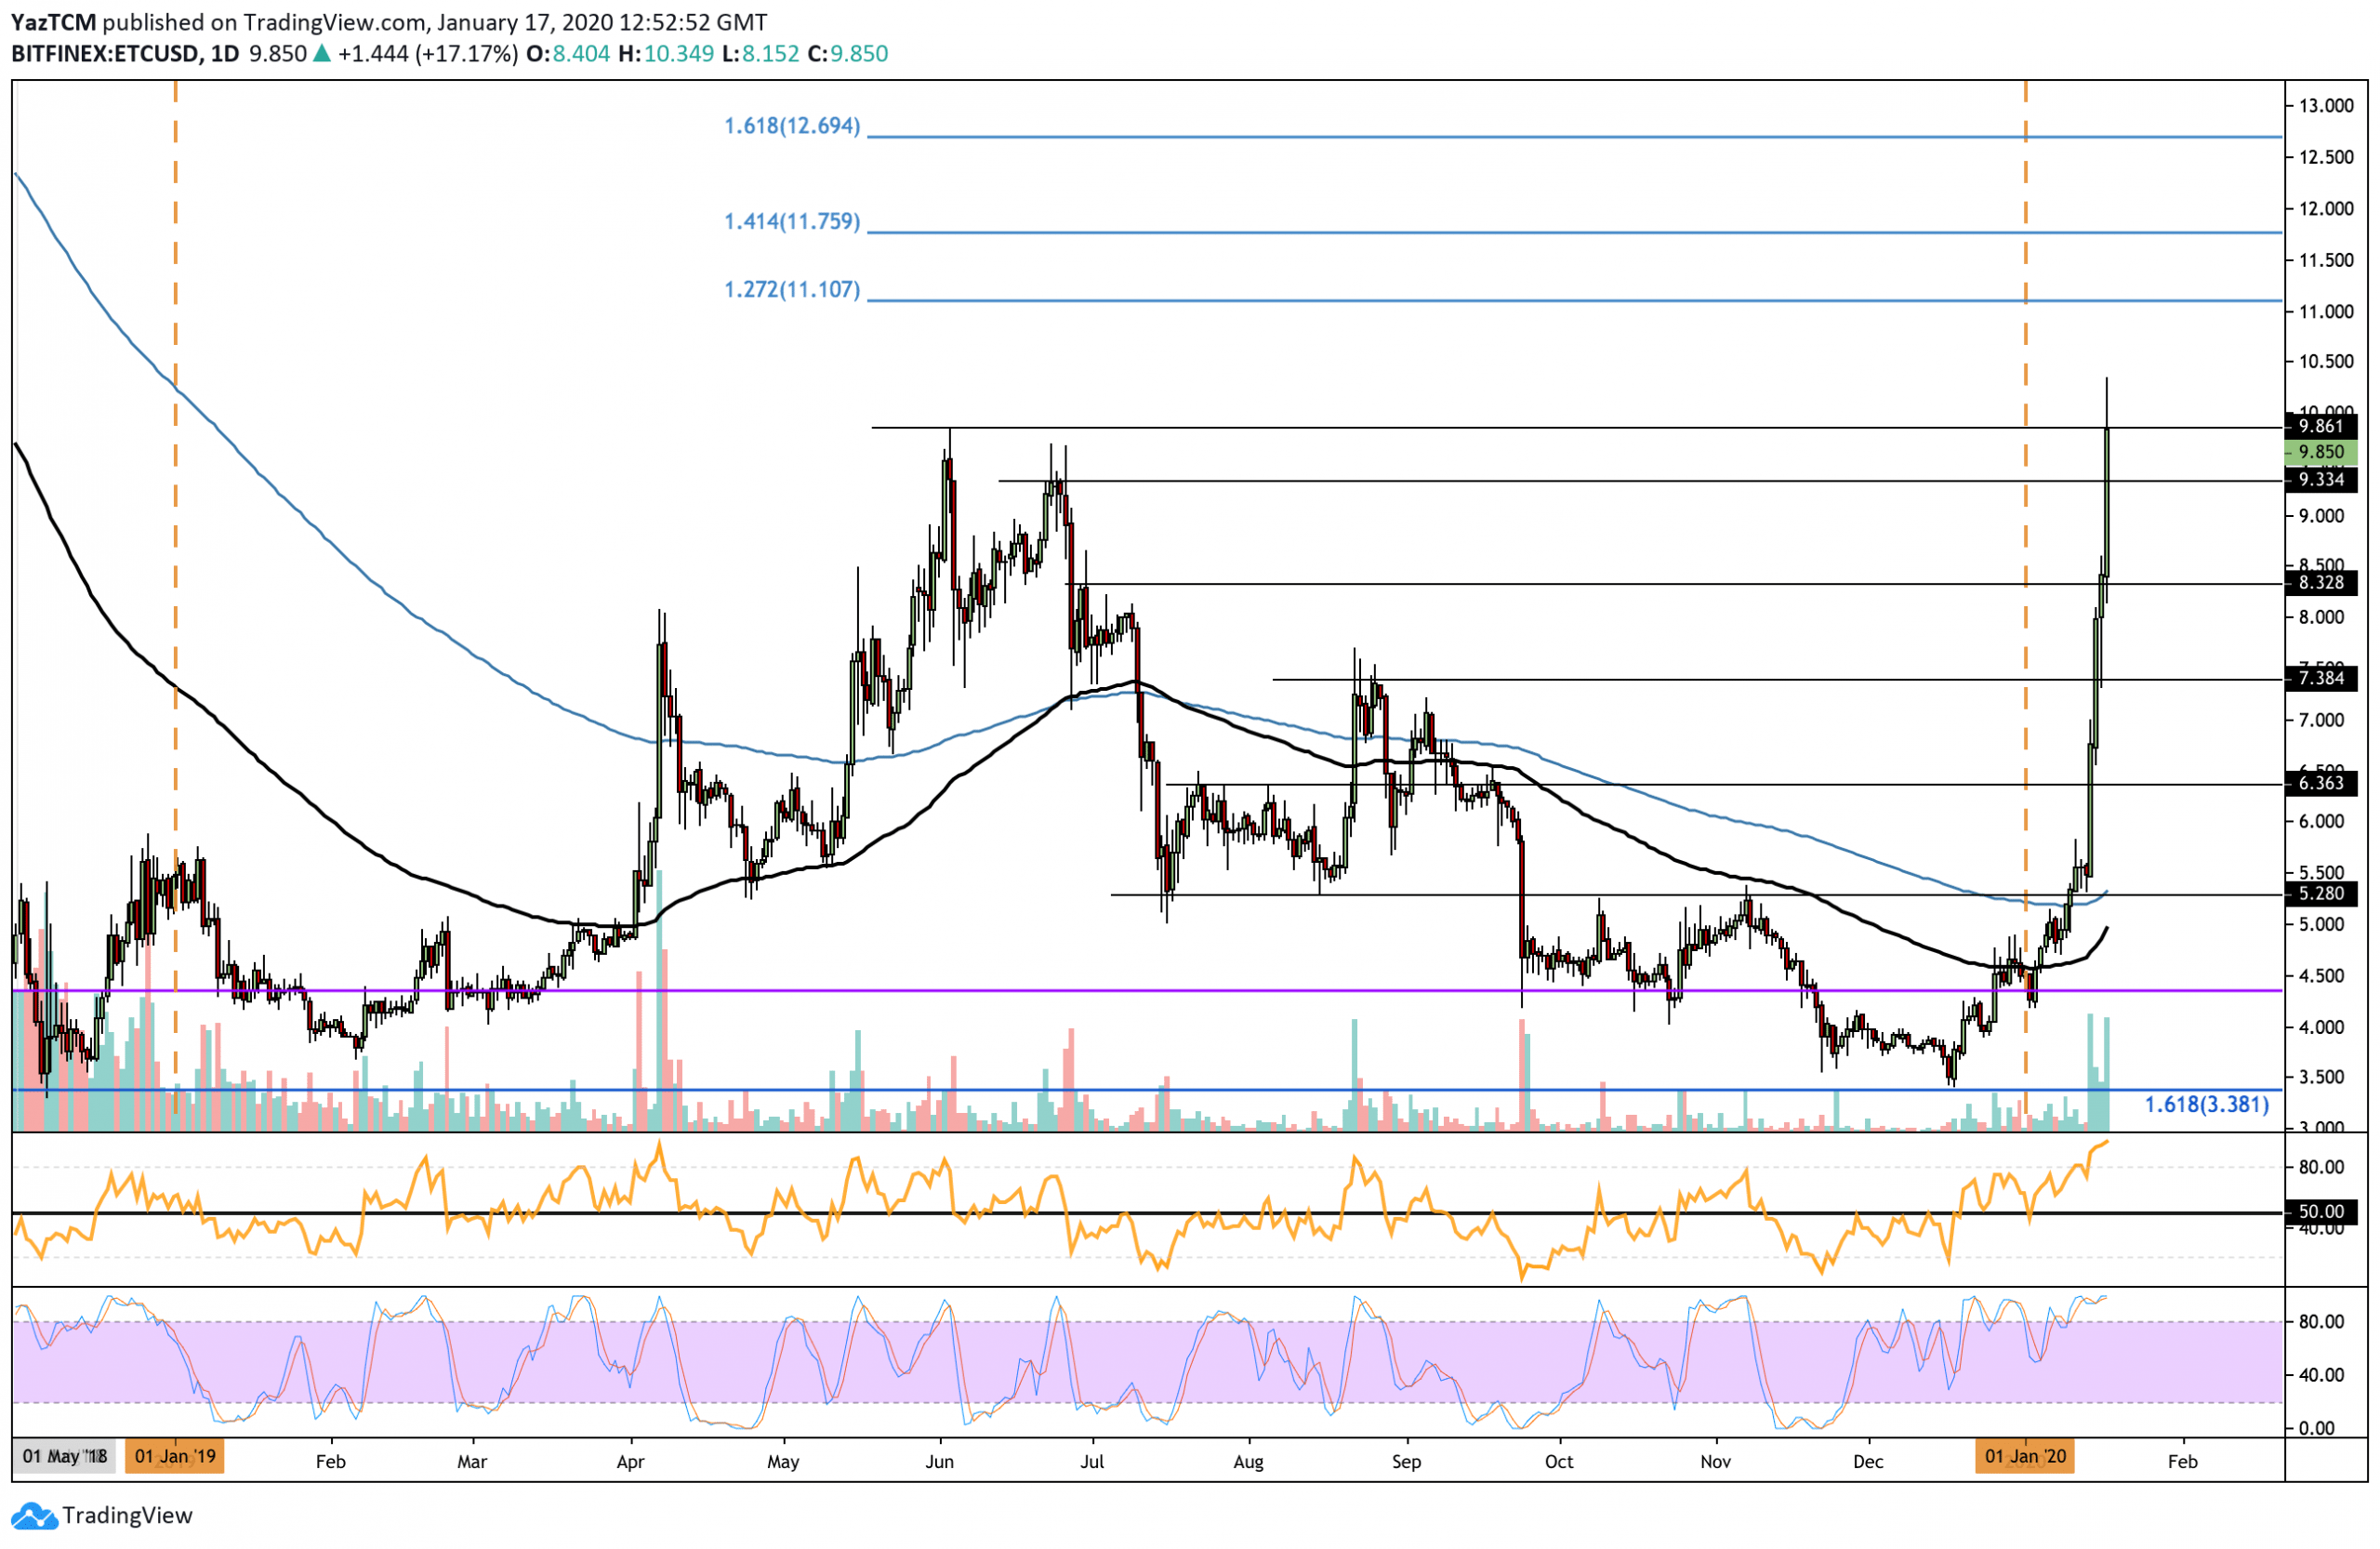
Ethereum Classic saw a 95% price explosion over the past seven days of trading, allowing the cryptocurrency to rise as high as $10. It saw a 30% price surge over the past 24 hours alone, which caused ETC to climb into resistance provided by the 2019 price high. Ethereum Classic has seen a very impressive performance in 2020 that has seen it climb the rankings to reach the top 10 cryptocurrency projects.
Looking ahead, if the buyers push ETC above the resistance at $10.00, immediate higher resistance is located at $11.10 and $11.75, which is provided by the 1.272 and 1.414 Fib Extensions, respectively. Above this, resistance lies at $12 and $12.69 (1.518 Fib Extension). Alternatively, if the sellers push ETC lower, support is located at $9.33, $8.50, $8.00, and $7.38.
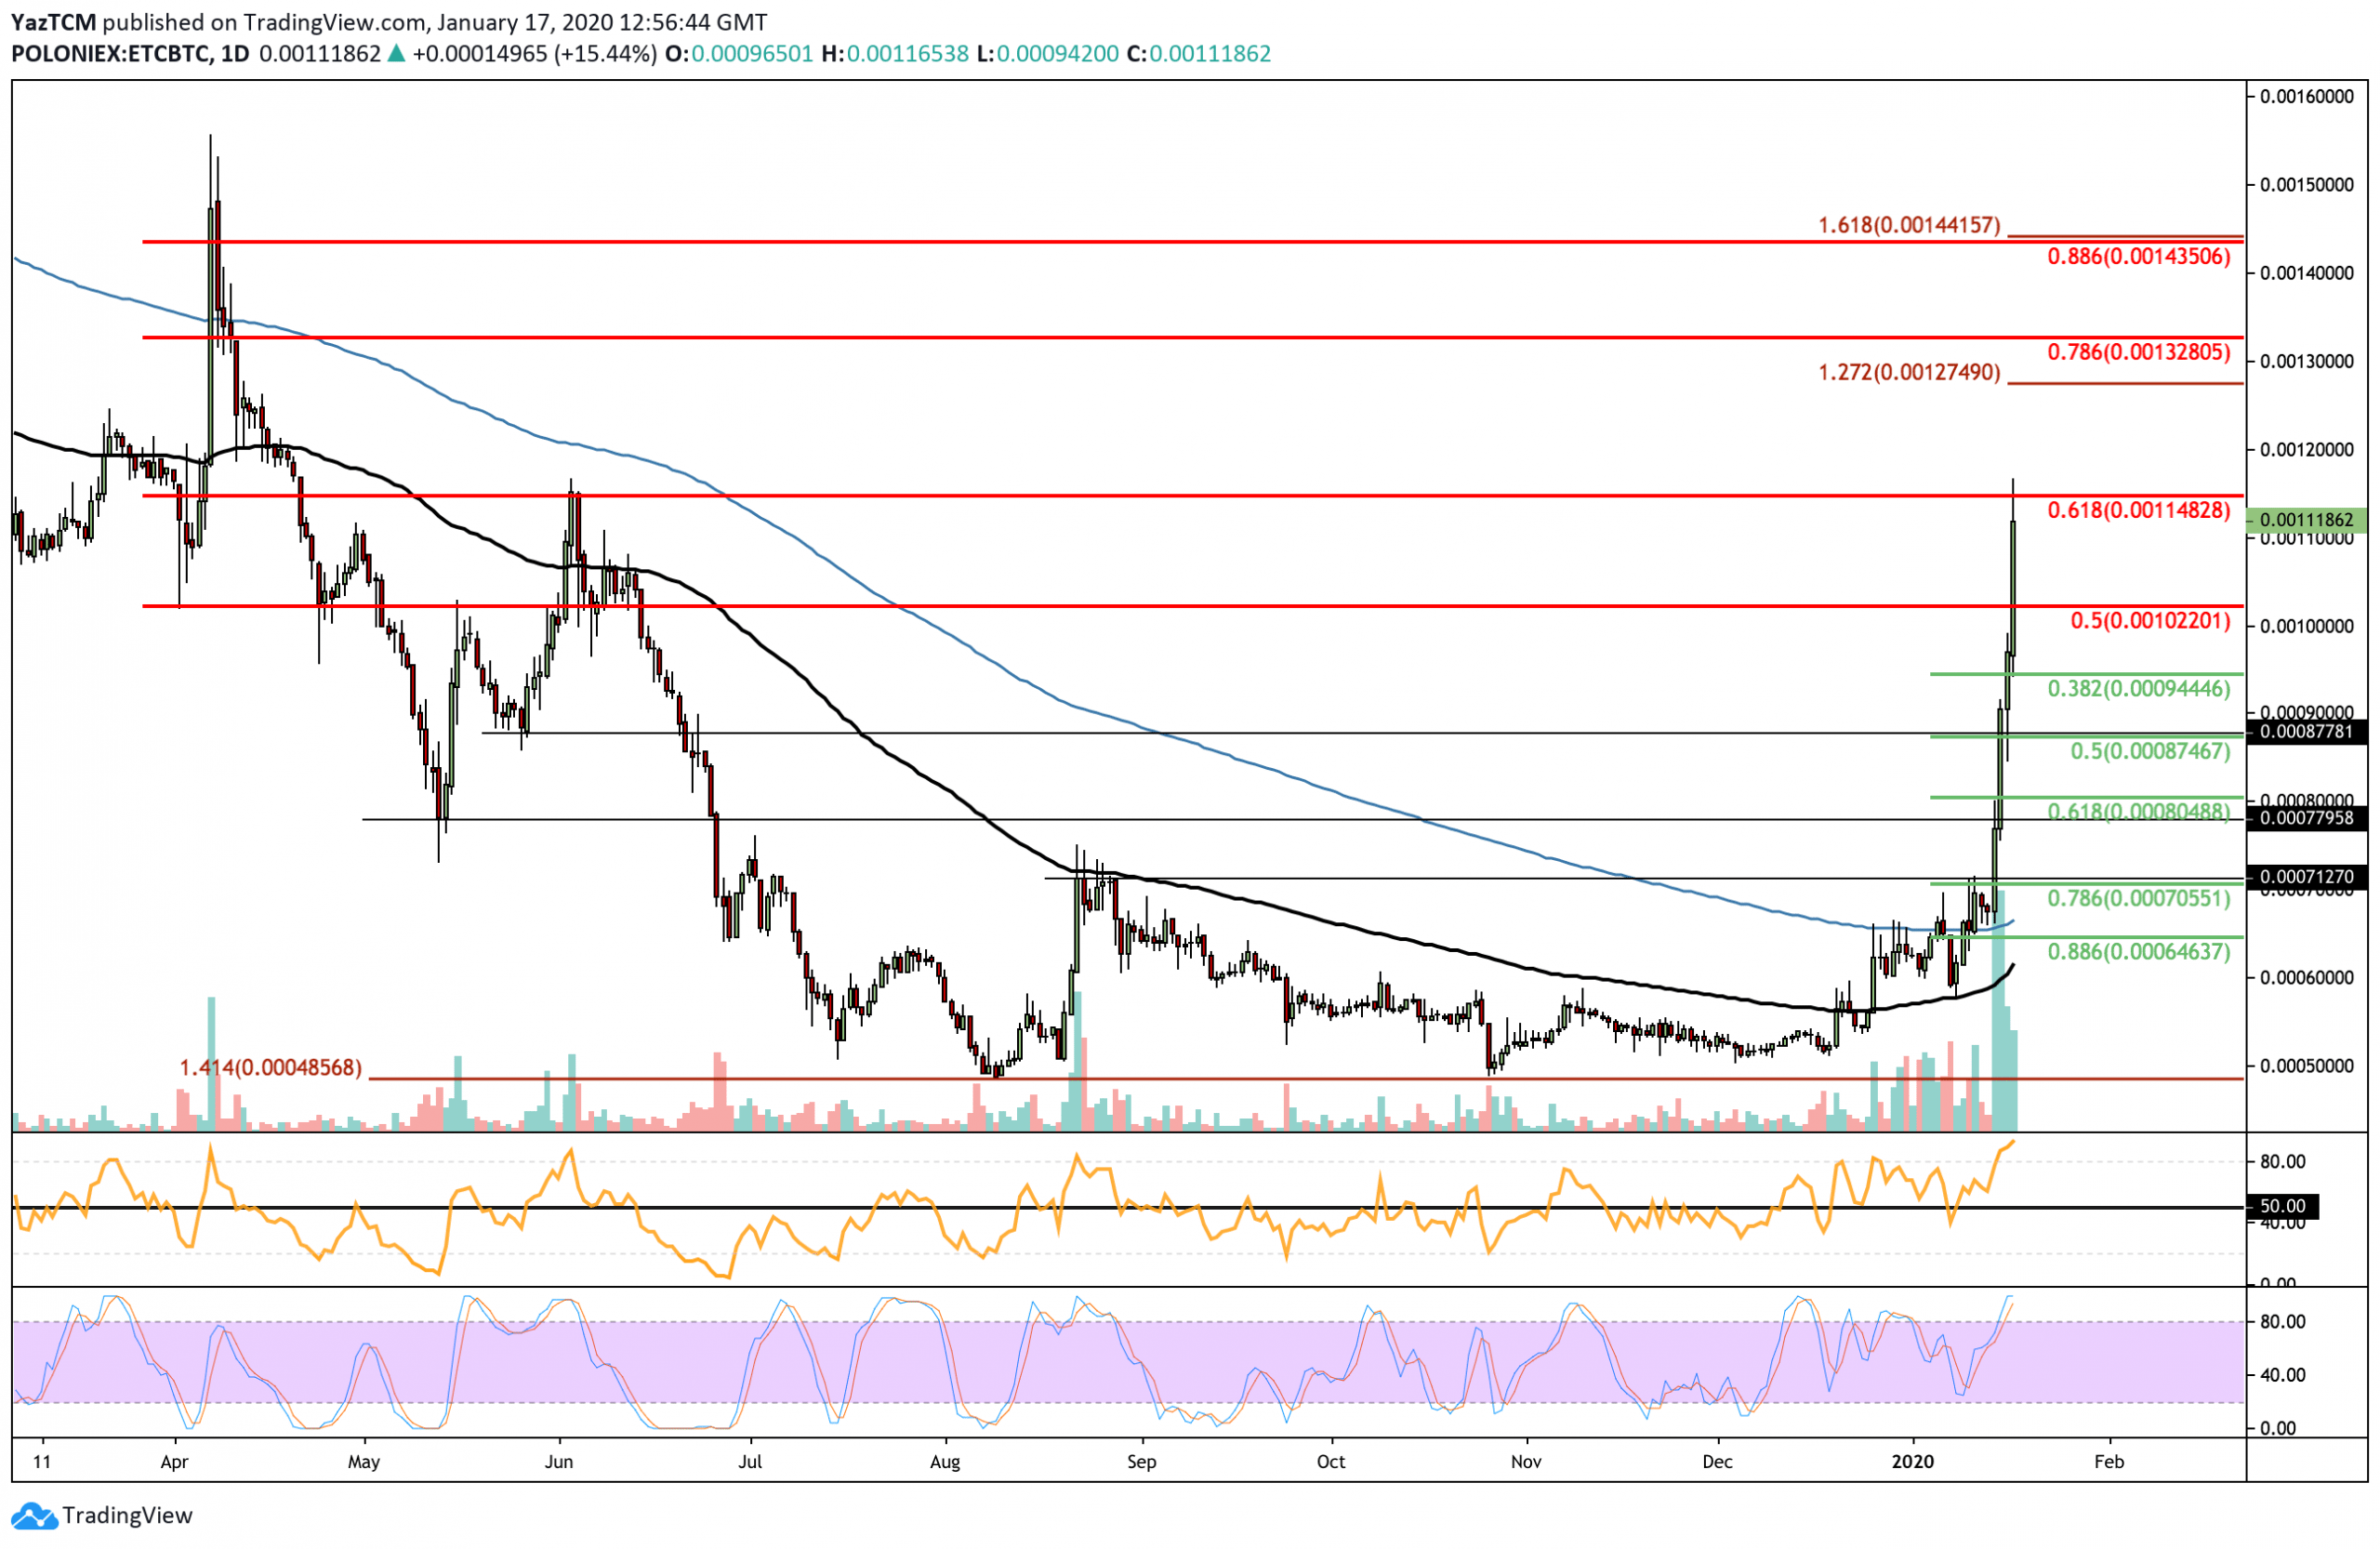
Against BTC, ETC has also seen an epic surge that saw it breaking above the 200-days EMA to climb higher and reach resistance provided by a long term bearish .618 Fibonacci Retracement level at 0.00114 BTC. This bearish Fib Retracement is measured from the April 2019 highs to the August 2019 lows.
Looking ahead, if the buyers manage to push above 0.00114 BTC, higher resistance lies at 0.0012 BTC, 0.00127 BTC (1.272 Fib Extension), and 0.00132 BTC. Beyond this, higher resistance lies at 0.00143 BTC (.886 Fib Retracement). Alternatively, if the sellers push ETC lower, support can be found at 0.0010 BTC, 0.00094 BTC (.382 Fib Retracement), and 0.00087 BTC (.5 FIb Retracement).
Disclaimer: Information found on CryptoPotato is those of writers quoted. It does not represent the opinions of CryptoPotato on whether to buy, sell, or hold any investments. You are advised to conduct your own research before making any investment decisions. Use provided information at your own risk. See Disclaimer for more information.
Cryptocurrency charts by TradingView.
Technical analysis tools by Coinigy.
You might also like:
The post appeared first on CryptoPotato


