Bitcoin
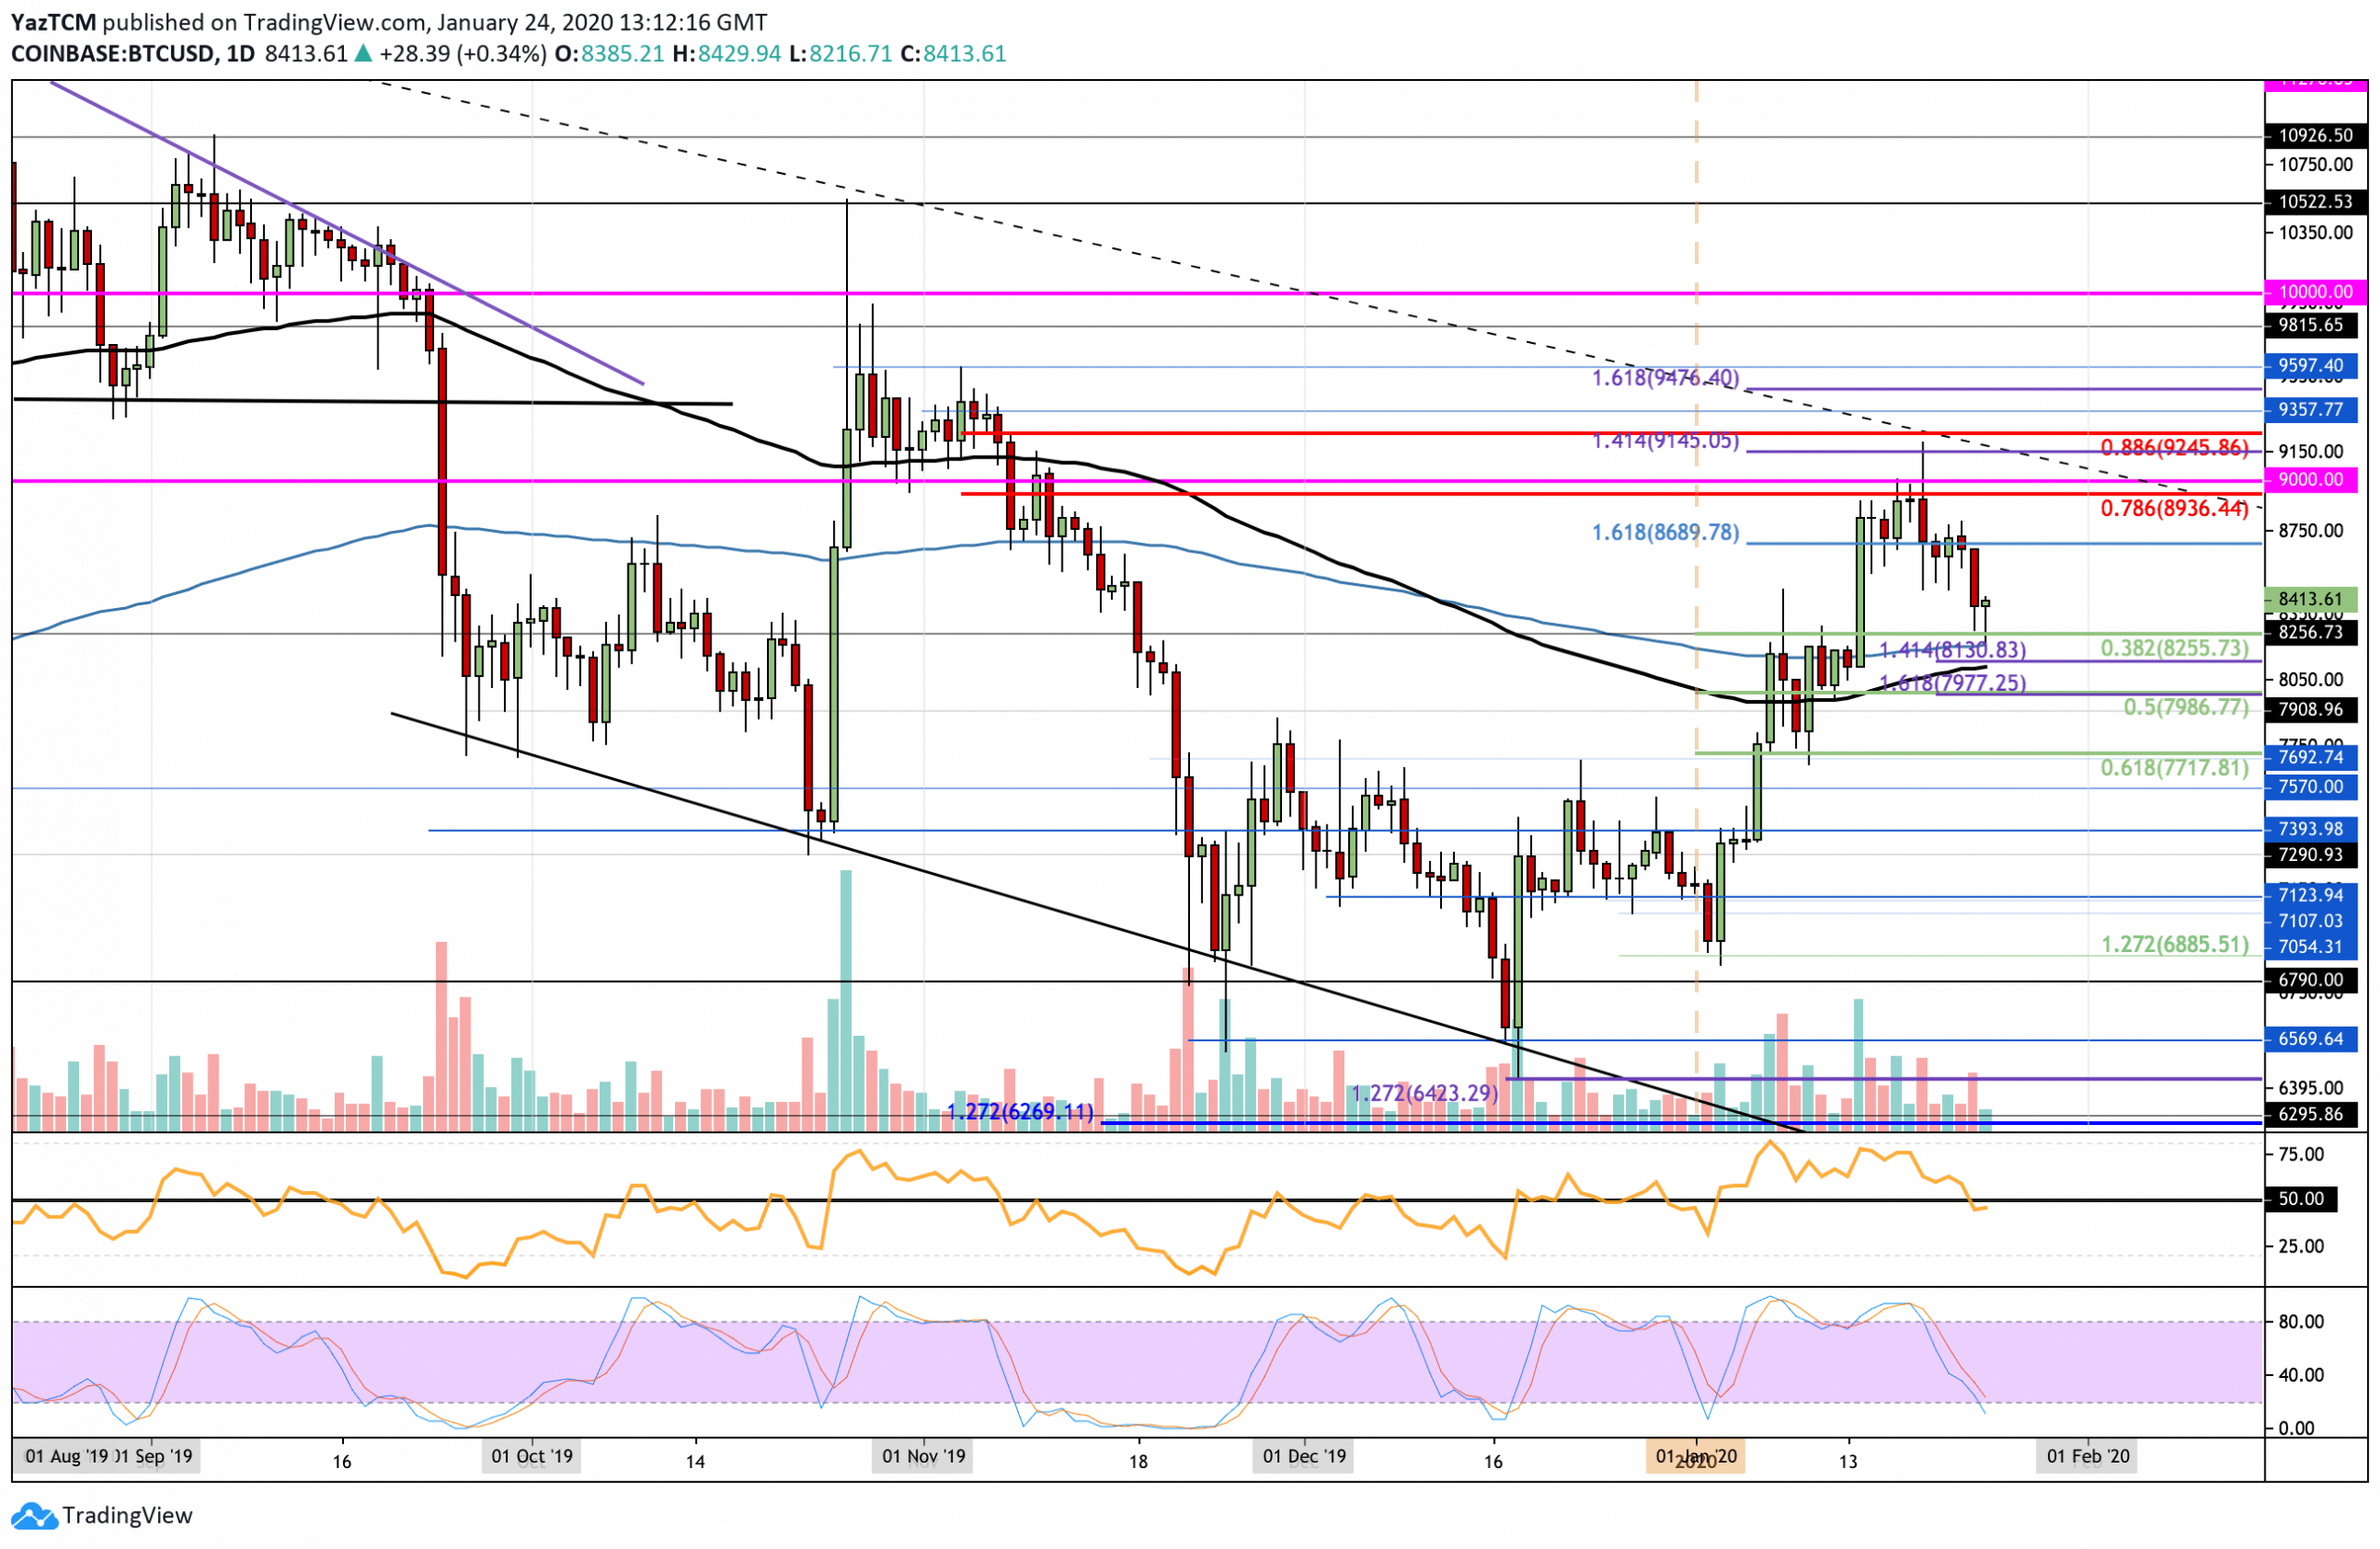
Bitcoin has dropped by a small 5% over the past week as it hovers around the $8,400 level. It found strong resistance at the $8,963 level (bearish .786 Fib Retracement) and was unable to overcome it. The latest retracement was expected, considering that Bitcoin managed to surge by over 30% in January to reach a high of around $9,150. It found support at the 200-days EMA at around $8,200 in today’s trading session, which allowed it to bounce back above $8,400. Unfortunately, the RSI has broken beneath the 50 level, and if it falls further, the selling momentum might send Bitcoin back beneath $8,000.
If the bulls can continue to rebound higher from $8,400, the first level of resistance is located at $8,700. Above this, resistance is expected at $8,900 (bearish .786 Fibonacci Retracement level). Beyond $9,000, resistance lies at $9,245 (bearish .886 Fib Retracement) and $9,476 (1.618 Fib Extension). Alternatively, if the selling pressure increases and Bitcoin drops beneath the 200-days EMA at $8,200, support is found at $8,130 (downside 1.414 Fib Extension) and $8,000. The support at $8,000 is further bolstered by the short term .5 Fibonacci Retracement level. Beneath this, support lies at $7,717 (.618 Fibonacci Retracement level).
Ethereum
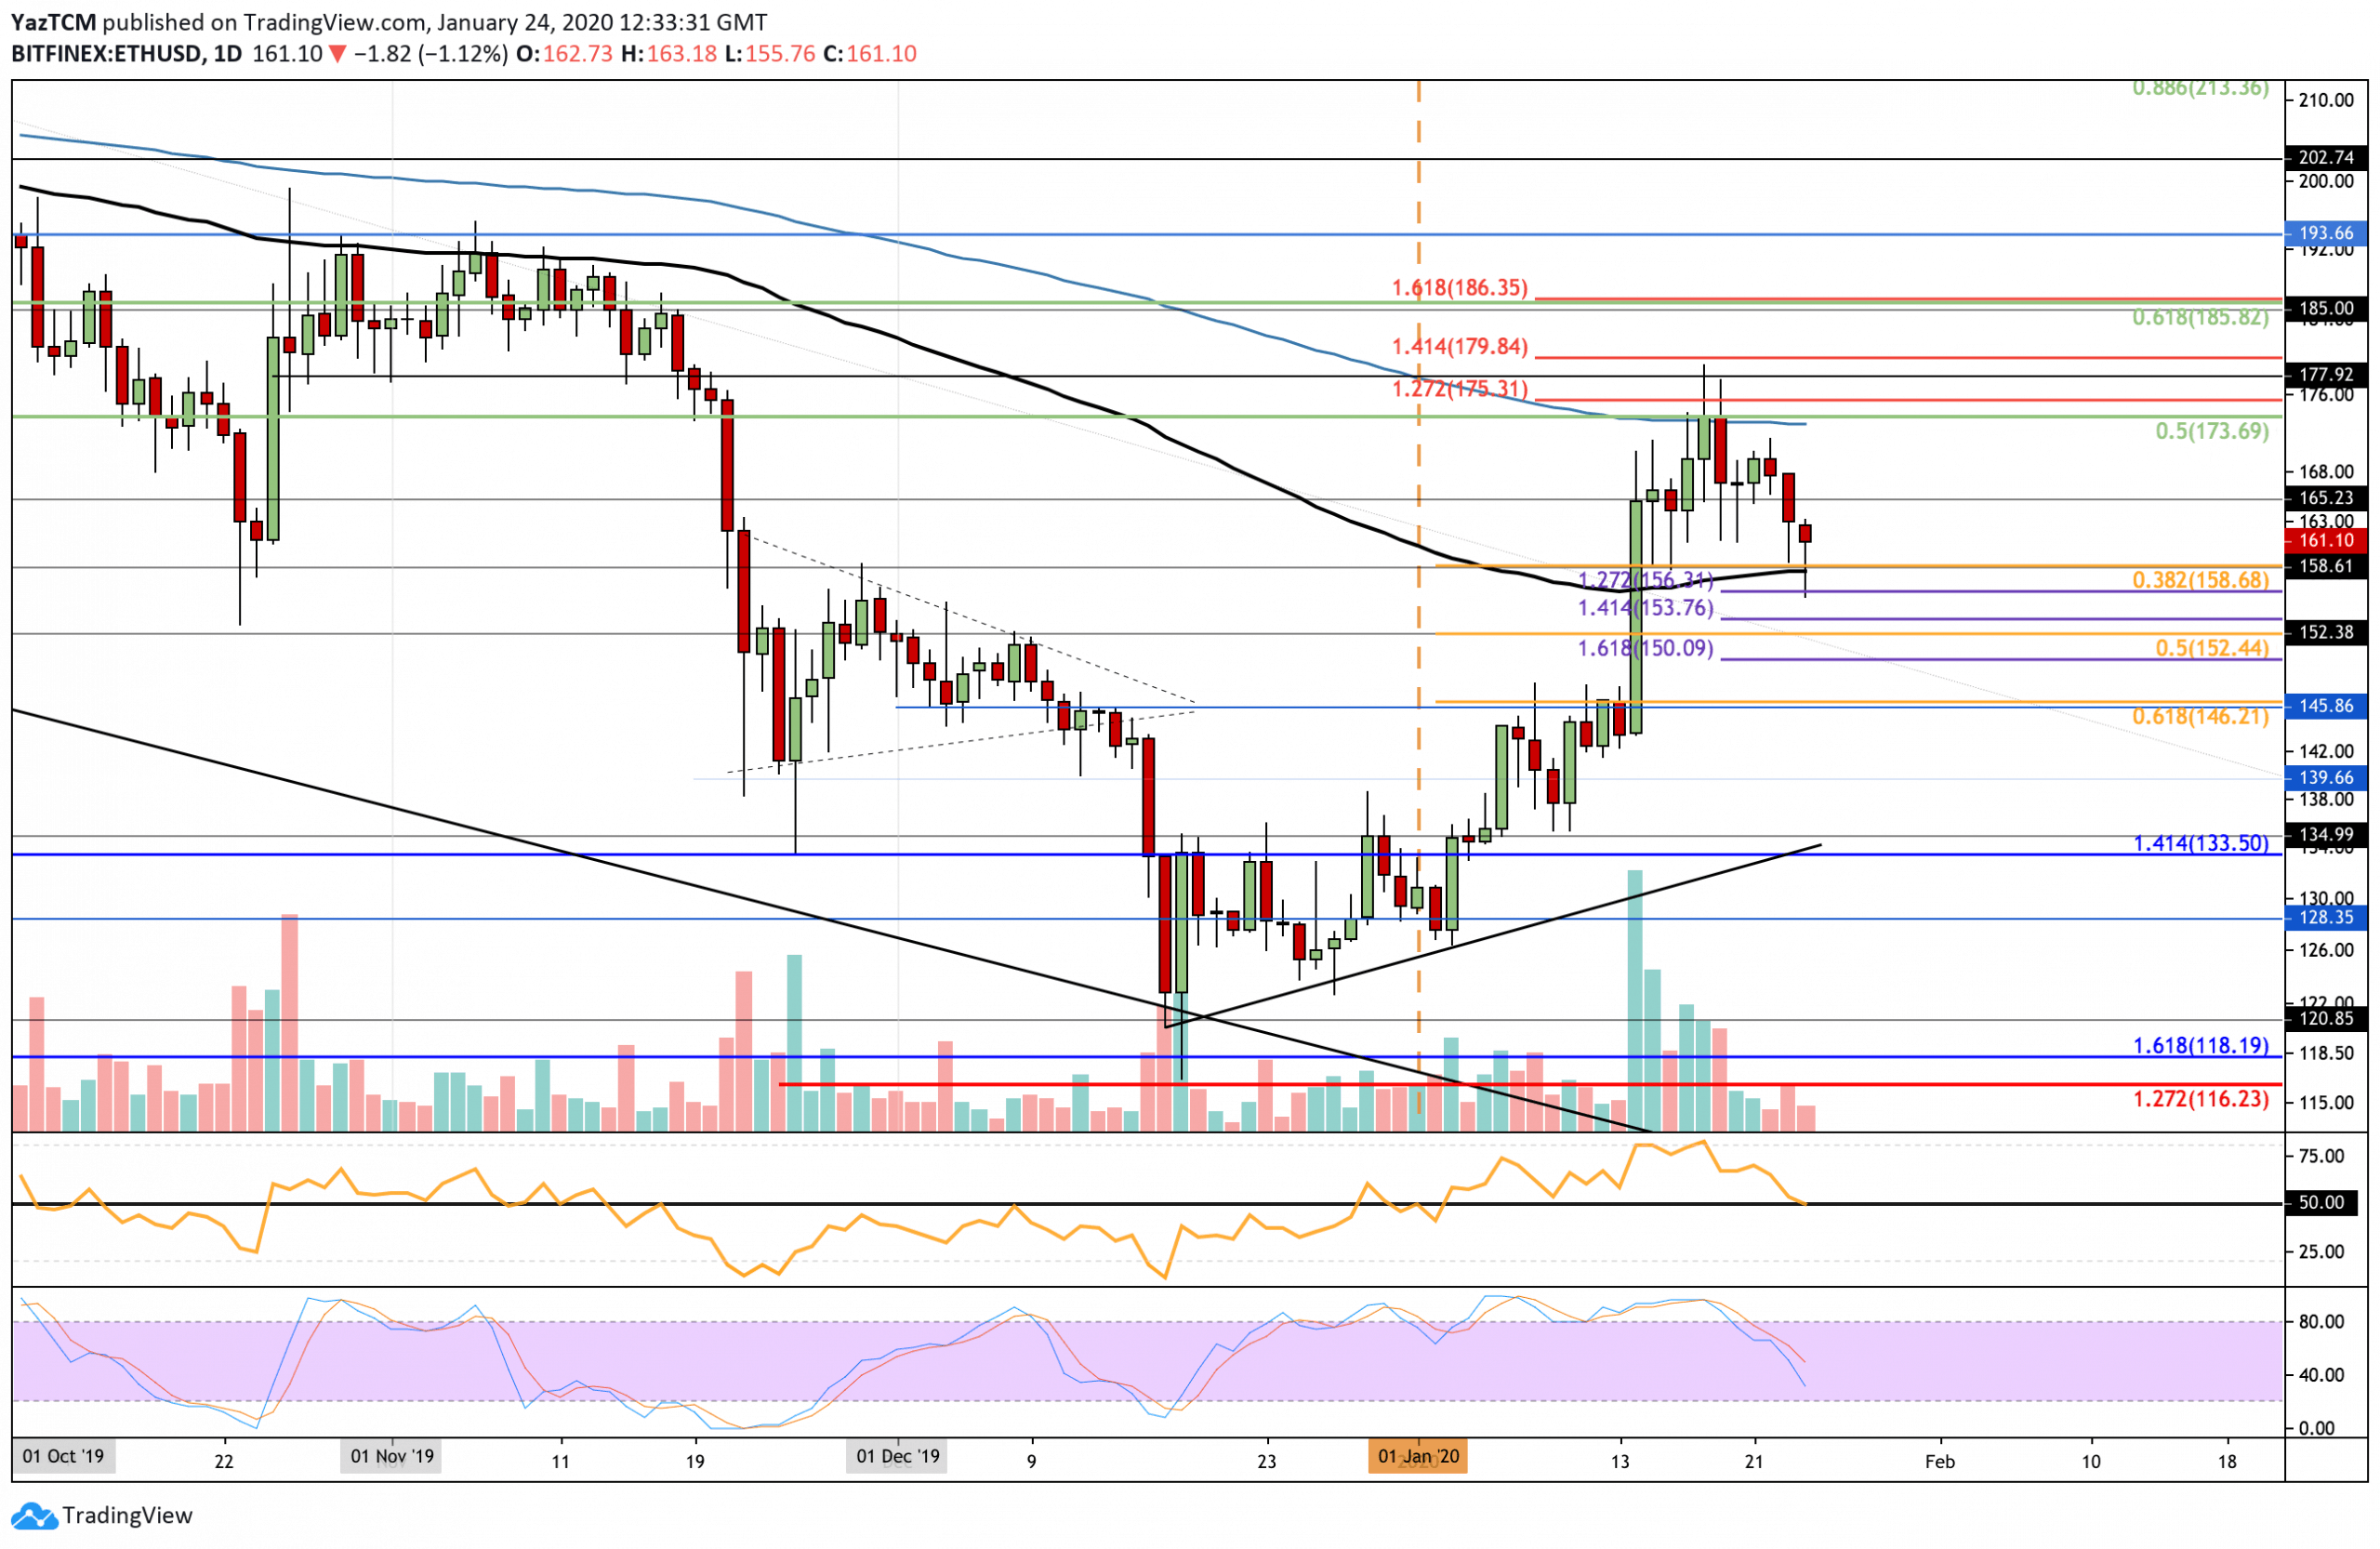
Ethereum also dropped by a total of 5% this week, which has seen it fall into support at the 100-days EMA at around $158. The cryptocurrency struggled with the resistance at about $174 (provided by the 200-days EMA) and rolled over to fall. The bulls are battling to remain above $158. However, if the RSI drops beneath 50, then the market is most likely going to head beneath this.
Looking ahead, if the sellers push ETH beneath $158, initial support lies at $156 (downside 1.272 Fib Extension and $152 (short term .5 Fib Retracement). Beneath this, additional support lies at $150 and $146 (short term .618 Fibonacci Retracement level). On the other hand, if the bulls defend the support at $158 and bounce higher, resistance lies at $165 and $174 (200-days EMA). Beyond this, resistance lies at $180 (1.414 Fib Extension) and $185 (bearish .618 Fib Retracement).
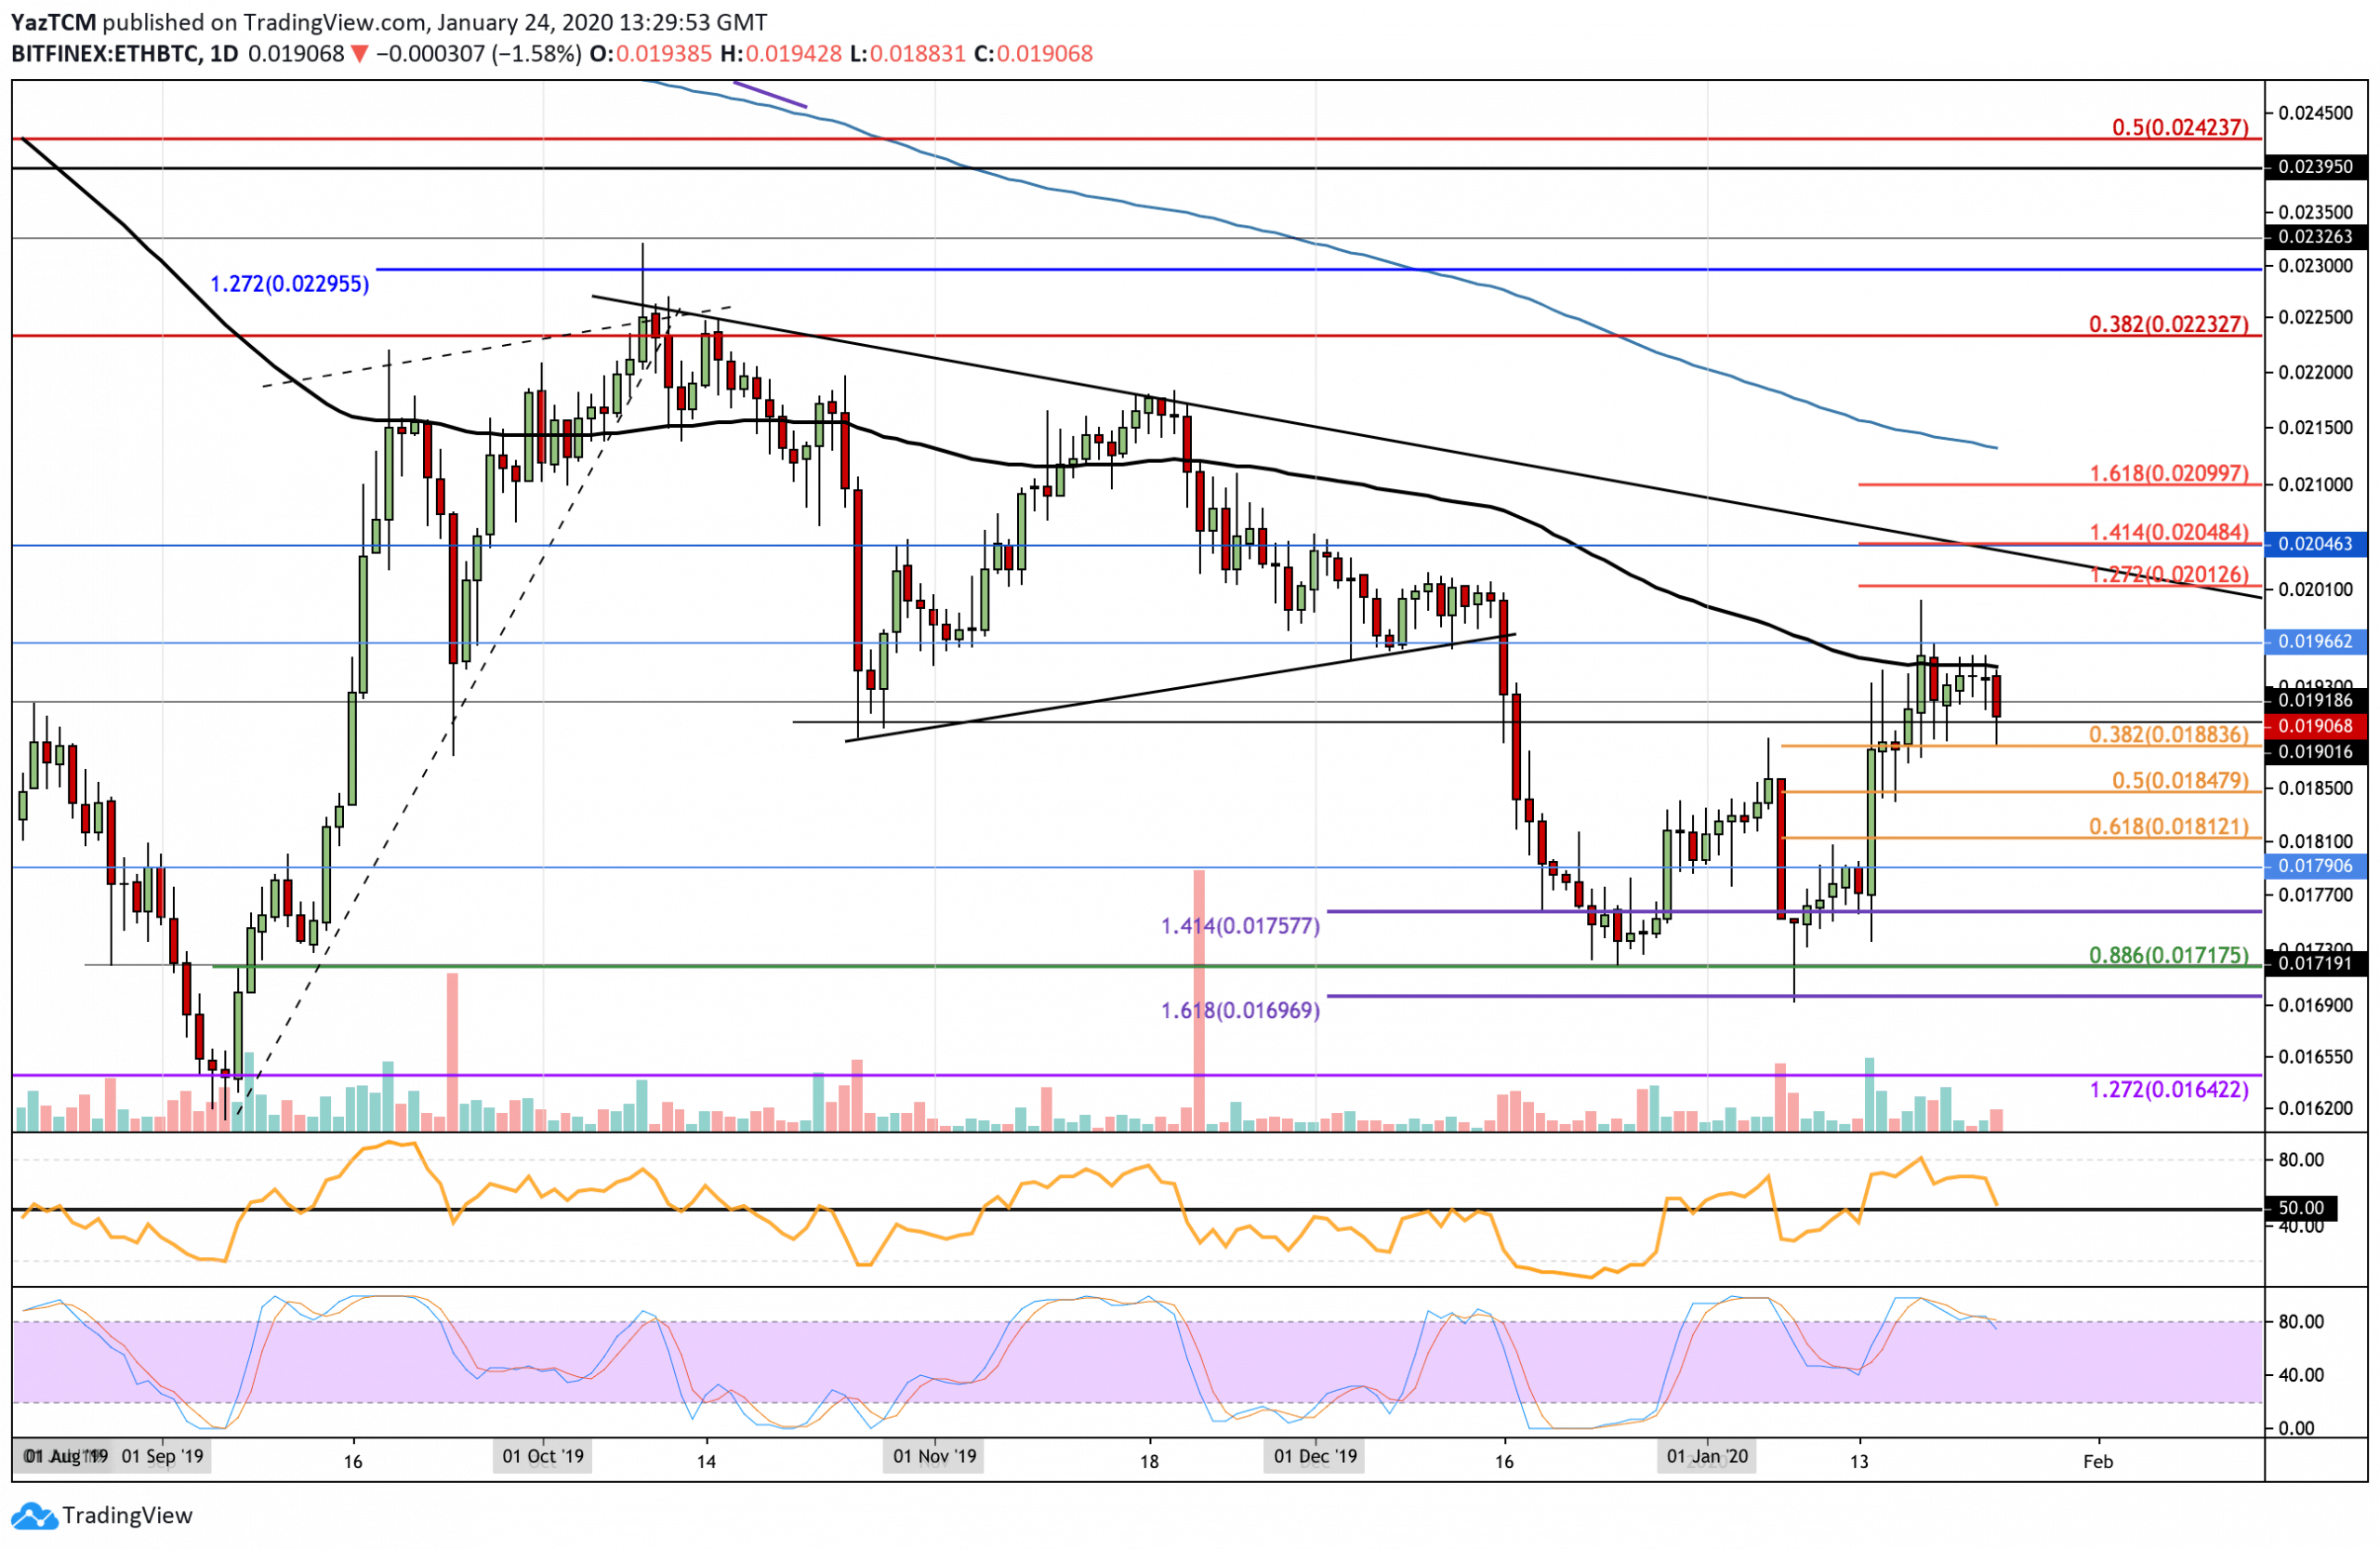
Against Bitcoin, ETH failed to overcome the resistance at the 100-days EMA and rolled over in today’s trading session. It found support at the short term .382 Fibonacci Retracement level at 0.0188 BTC and has bounced back above 0.019 BTC. However, it seems that the sellers may be in charge here, and we might see ETH/BTC heading back toward 0.0185 BTC if the RSI breaks beneath the 50 level.
If the sellers push ETH beneath 0.0188 BTC, support can be found at 00185 BTC (short term .5 Fibonacci Retracement level). Beneath this, support lies at 0.0181 BTC (.618 Fib Retracement level), 0.0179 BTC, and 0.0171 BTC. Alternatively, if the bulls hold above 0.019 BTC and push higher, resistance is expected at 0.0195 BTC (100-days EMA). Above this, resistance lies at 0.02 BTC and 0.0204 BTC (1.414 Fib Extension).
Ripple
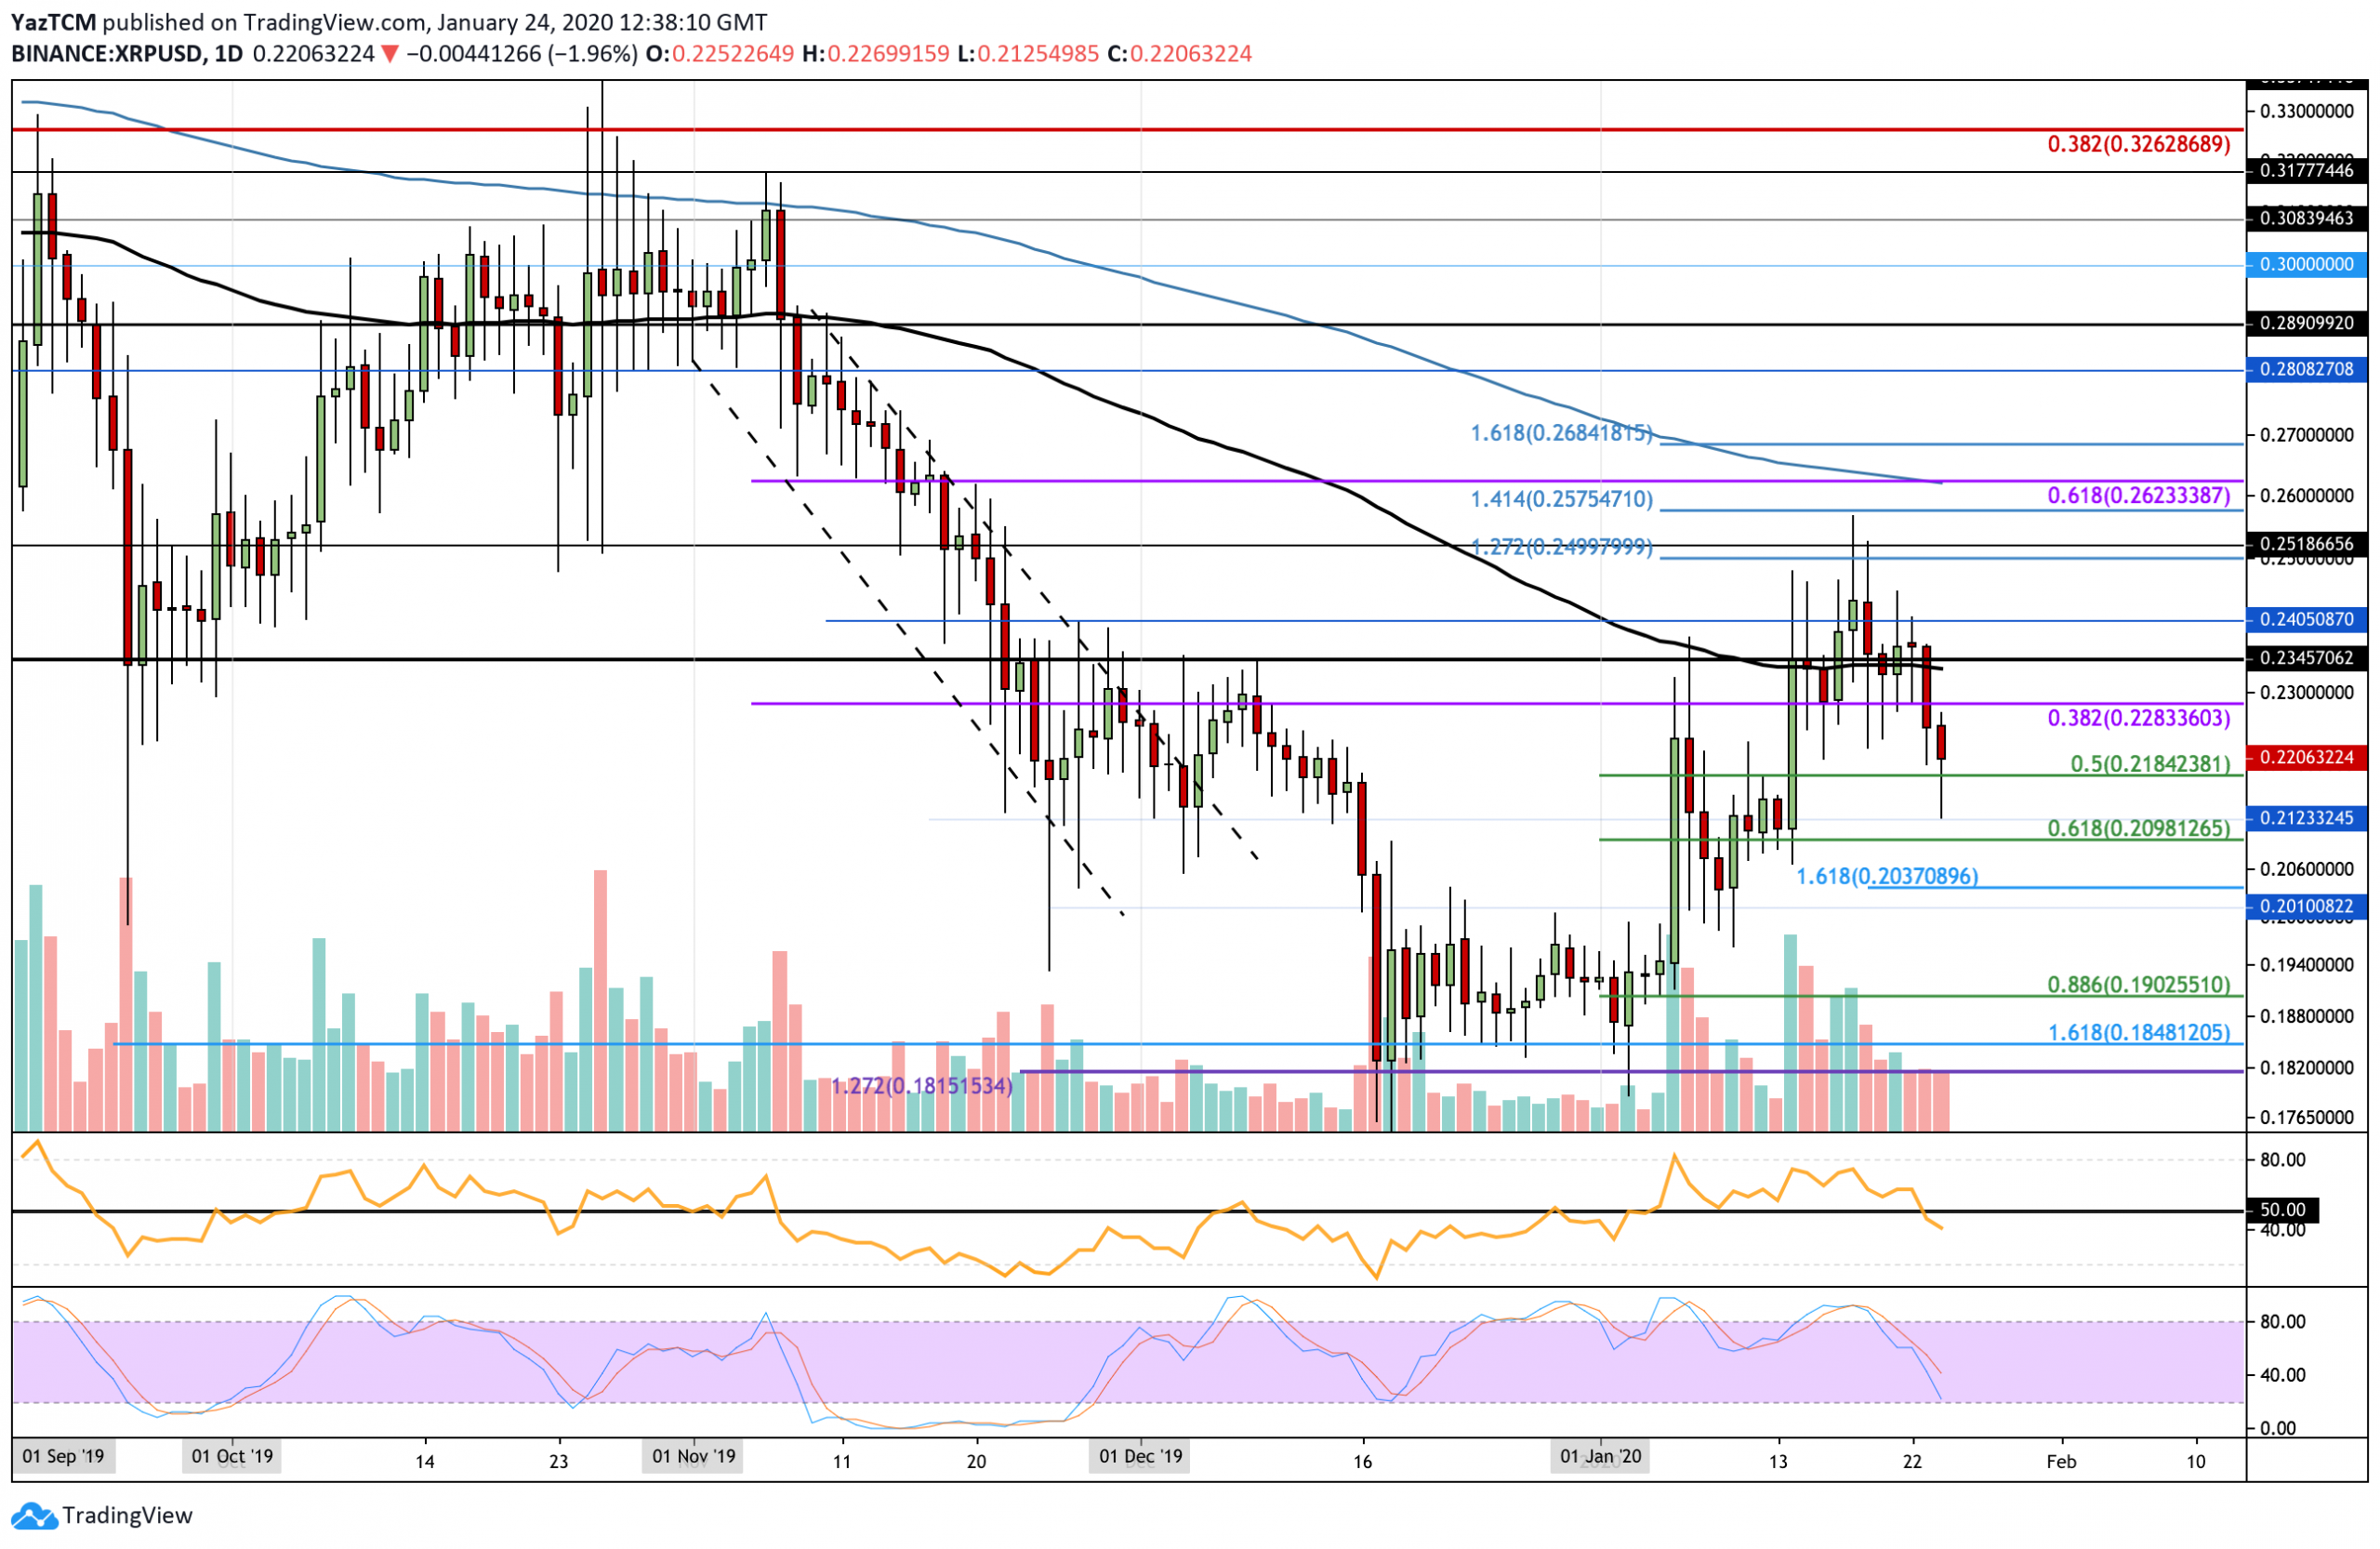
XRP is another cryptocurrency that dropped by a total of 5% this week, bringing the price for the coin down to $0.22. The market has found support here. However, the RSI has dropped beneath the 50 level to indicate the selling pressure is growing. XRP did climb above $0.25 but was unable to make any movement above this, causing it to roll over and fall.
If the buyers continue to climb higher from $0.22, resistance is expected at $0.228 (bearish .382 Fib Retracement) and $0.234 (100-days EMA). Above this, resistance lies at $0.25 and $0.262 (bearish .618 Fib Retracement). Alternatively, if the sellers push beneath $0.22, support lies at $0.218 (short term .5 Fib Retracement) and $0.213. Beneath this, additional support lies at $0.21 (short term .618 Fib Retracement) and $0.203.
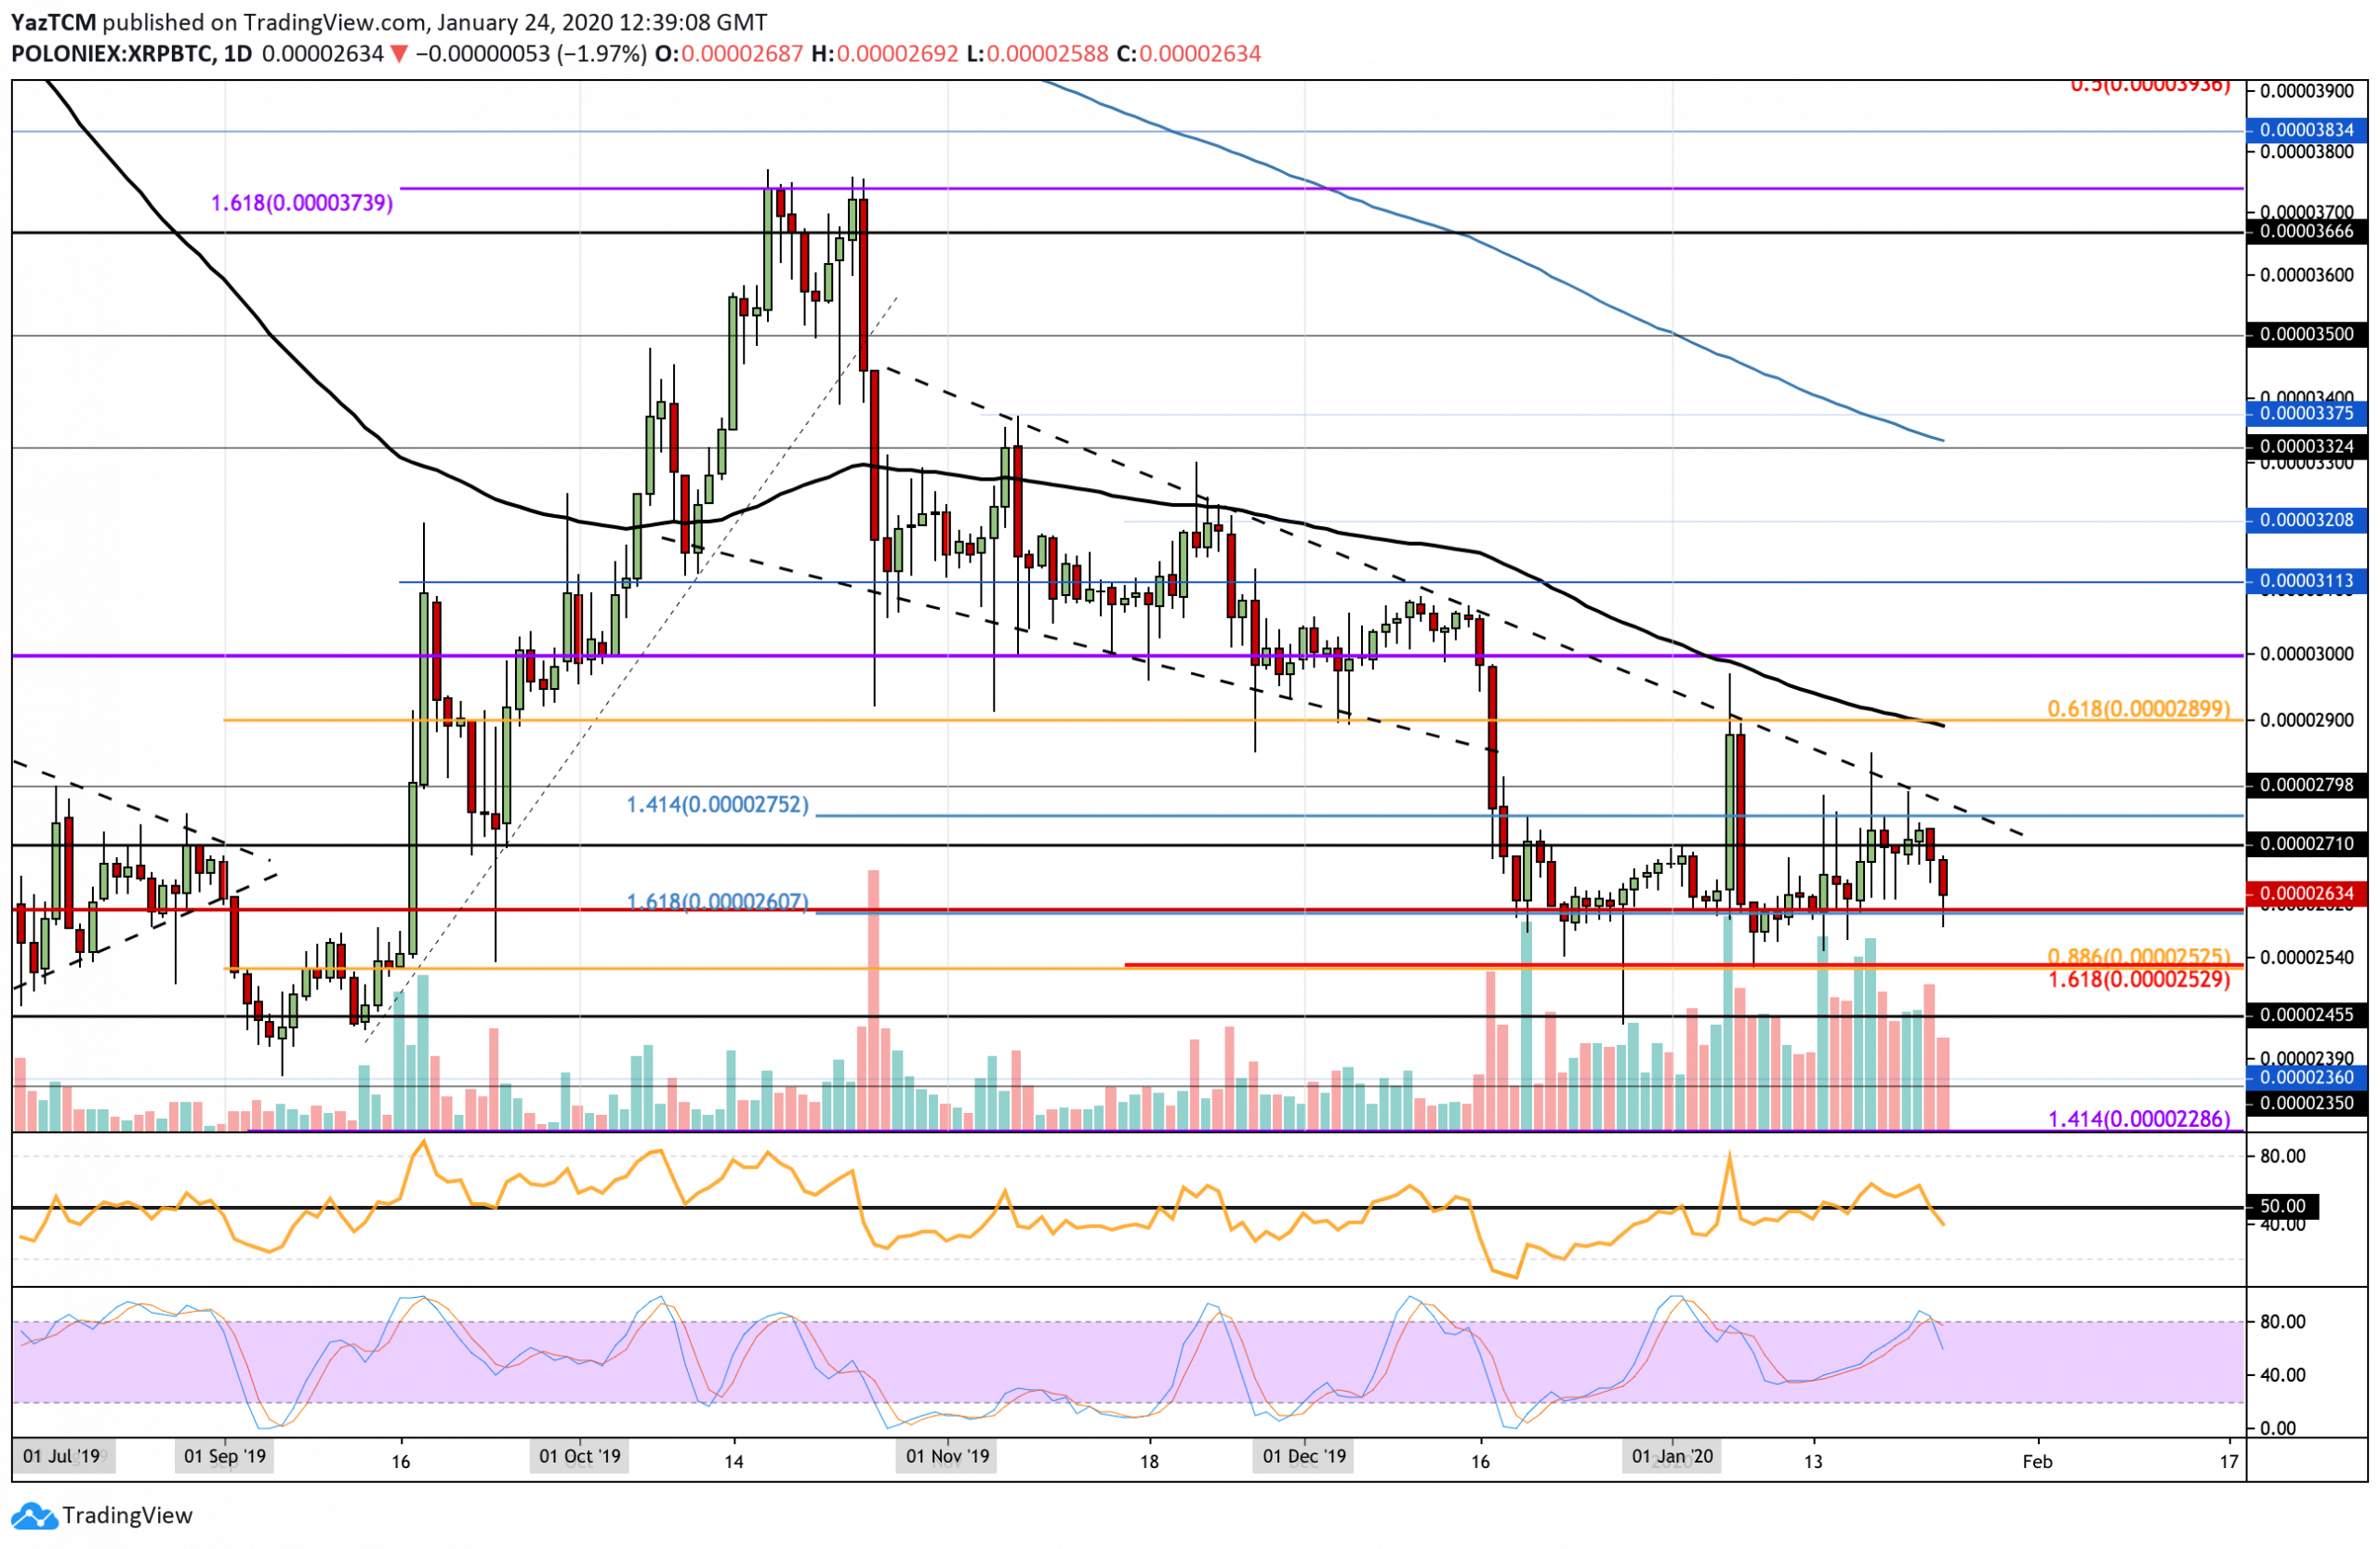
Against BTC, XRP remains range-bound as it is trapped between 2600 SAT and 2750 SAT. The cryptocurrency failed to break above the downward sloping trend line as it attempted to move higher. The sellers have now gained control over the market momentum, which could see XRP dropping beneath the range and heading toward 2500 SAT.
Moving forward, if the selling pushes XRP beneath 2600 SAT, support can be expected at 2530 SAT (.886 Fib Retracement level). Beneath this, additional support lies at 2455 SAT, 2400 SAT, and 2360 SAT. On the other hand, if the bulls hold the 2600 SAT level and push higher, resistance lies at 2710 SAT, 2750 SAT, and 2800 SAT. Above this, higher resistance lies at 2900 SAT and 3000 SAT.
Bitcoin Cash
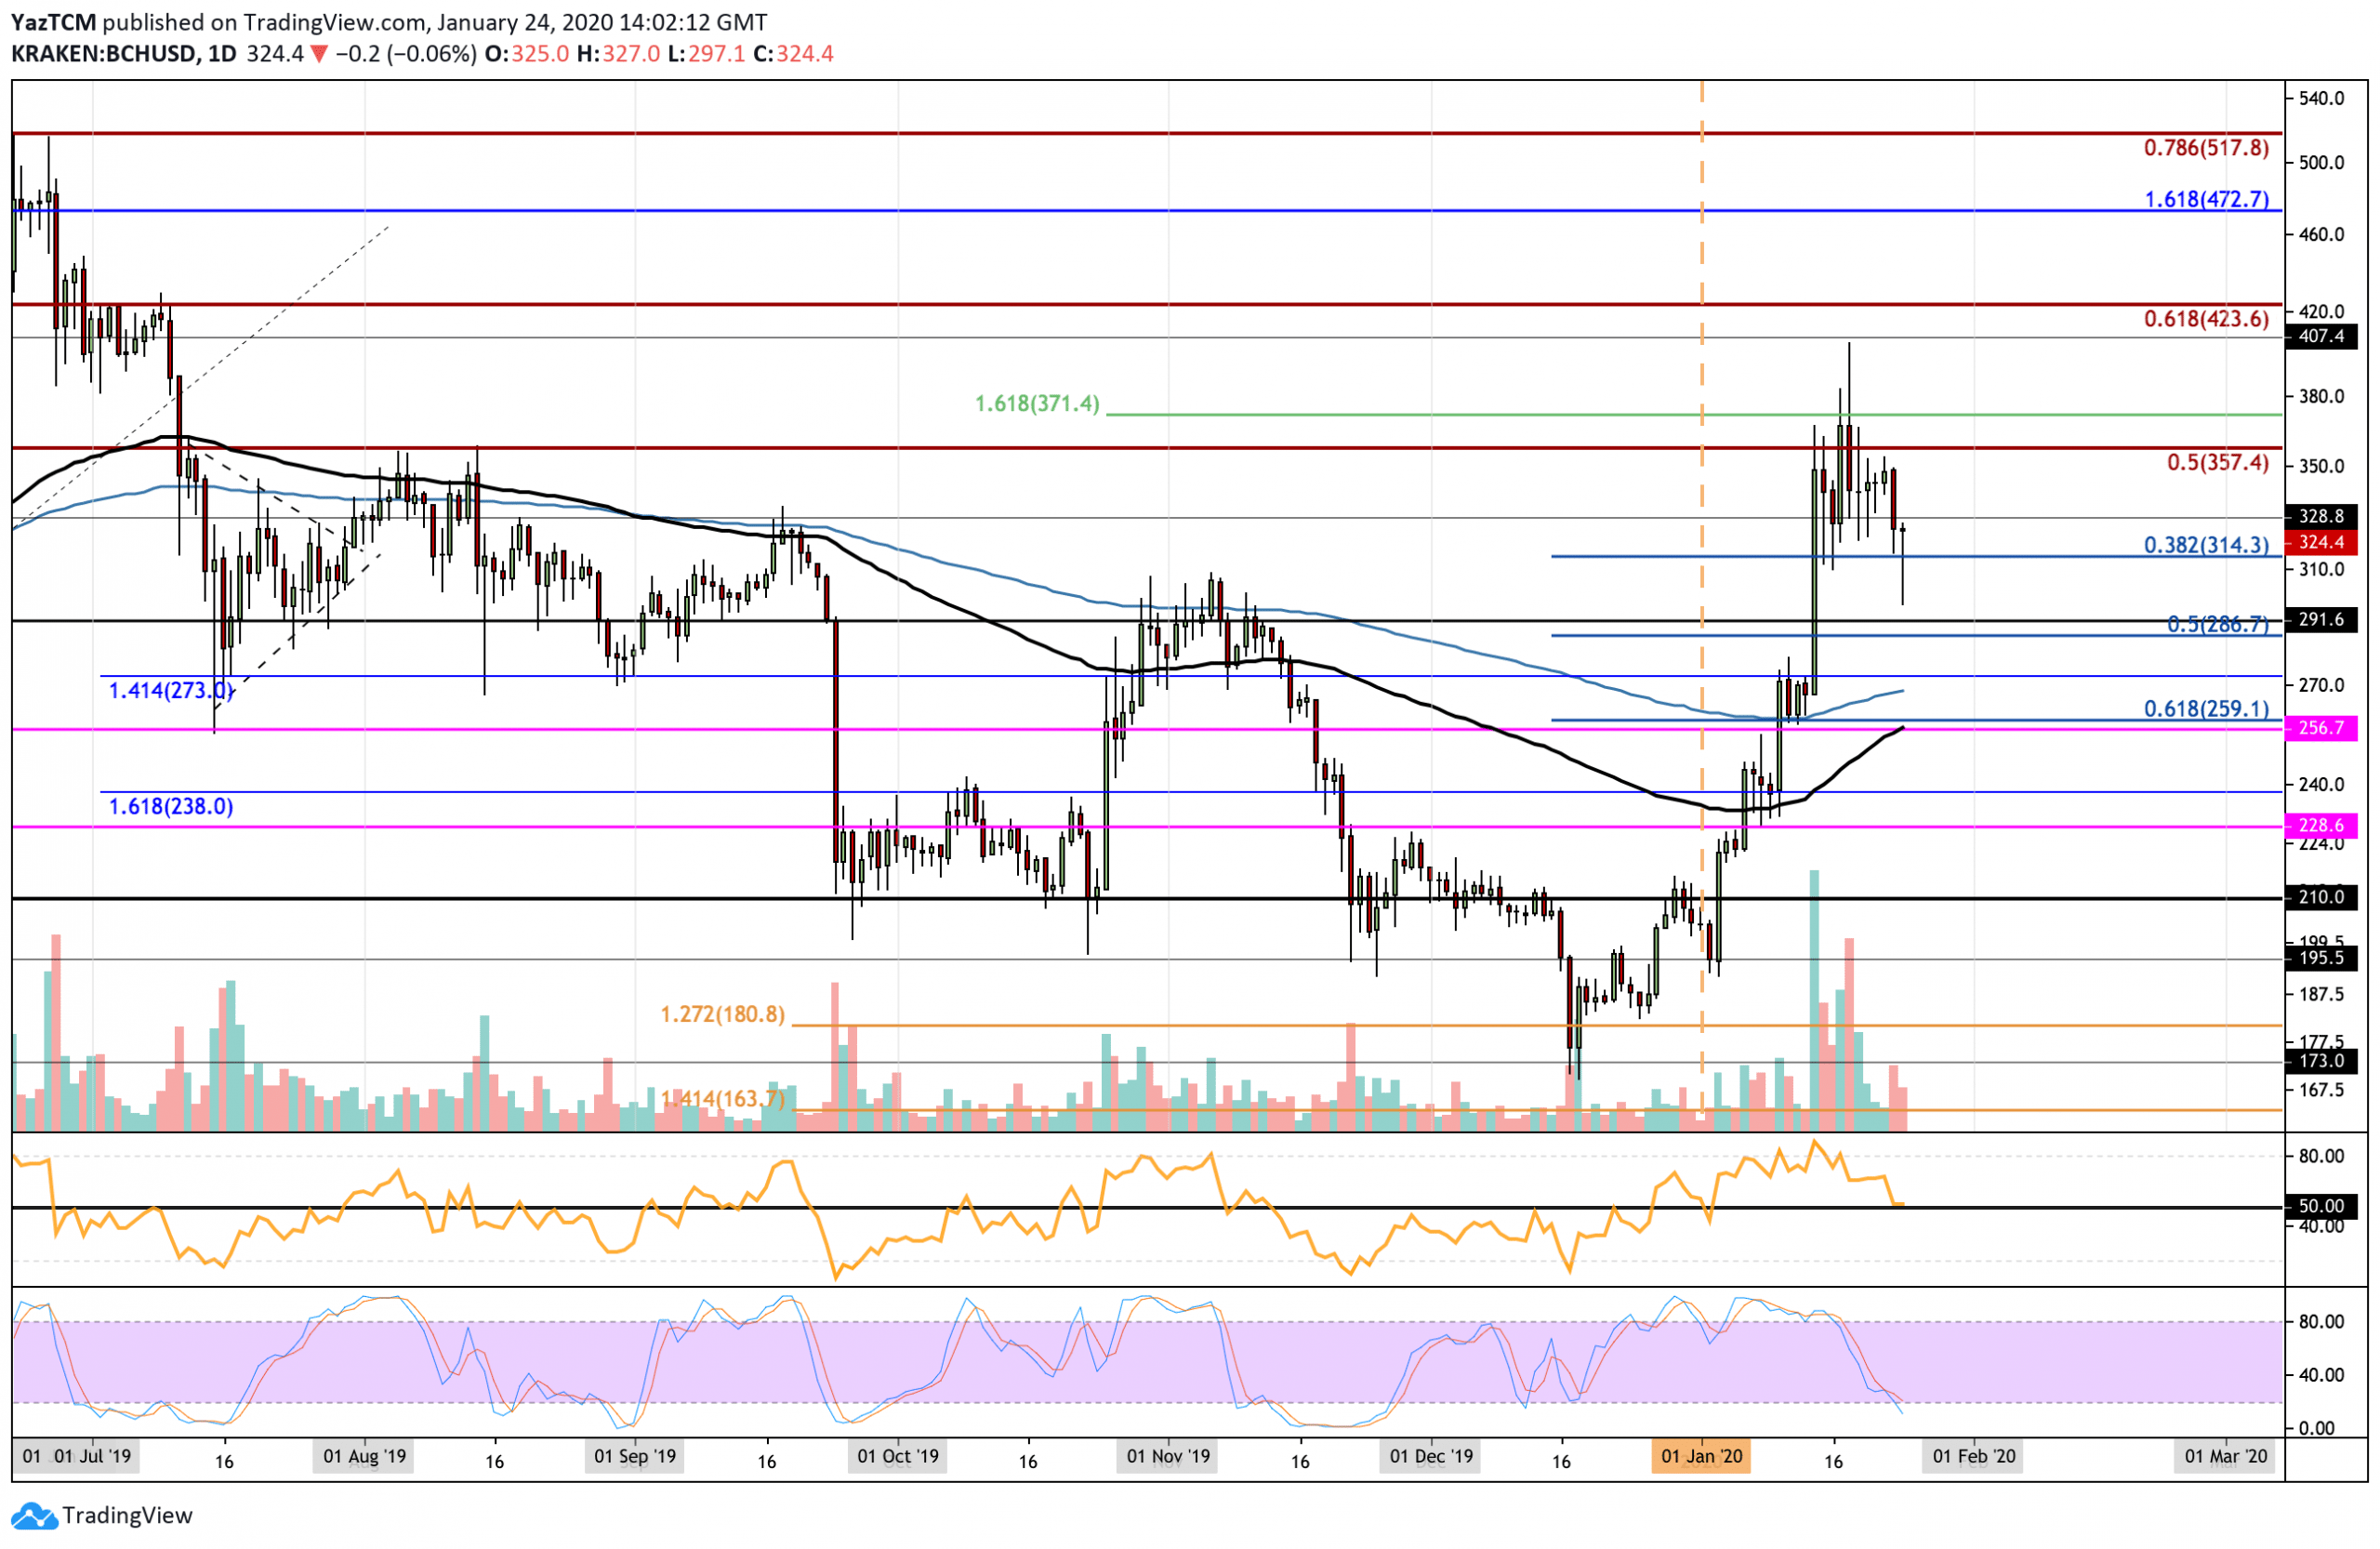
Bitcoin Cash witnessed a 7% price decline over the past week after a massive price surge that totaled 110% in January alone. The cryptocurrency trades at around $324 after rebounding from beneath $300 today. The RSI has returned to the 50 level, which shows that the market has pulled back from overextended conditions. If the RSI can remain above 50, BCH should continue further higher toward $400.
Looking ahead, if the buyers defend the support at $314 (.382 Fib Retracement), the first level of resistance lies at $357. Above this, resistance lies at $371 (1.618 Fib Extension), $400, and $423 (bearish .618 Fib Retracement). Alternatively, if the sellers push beneath $314, additional support is found at $300, $286 (.5 Fibonacci Retracement level), $270 (200-days EMA), and $259 (.618 Fib Retracement).
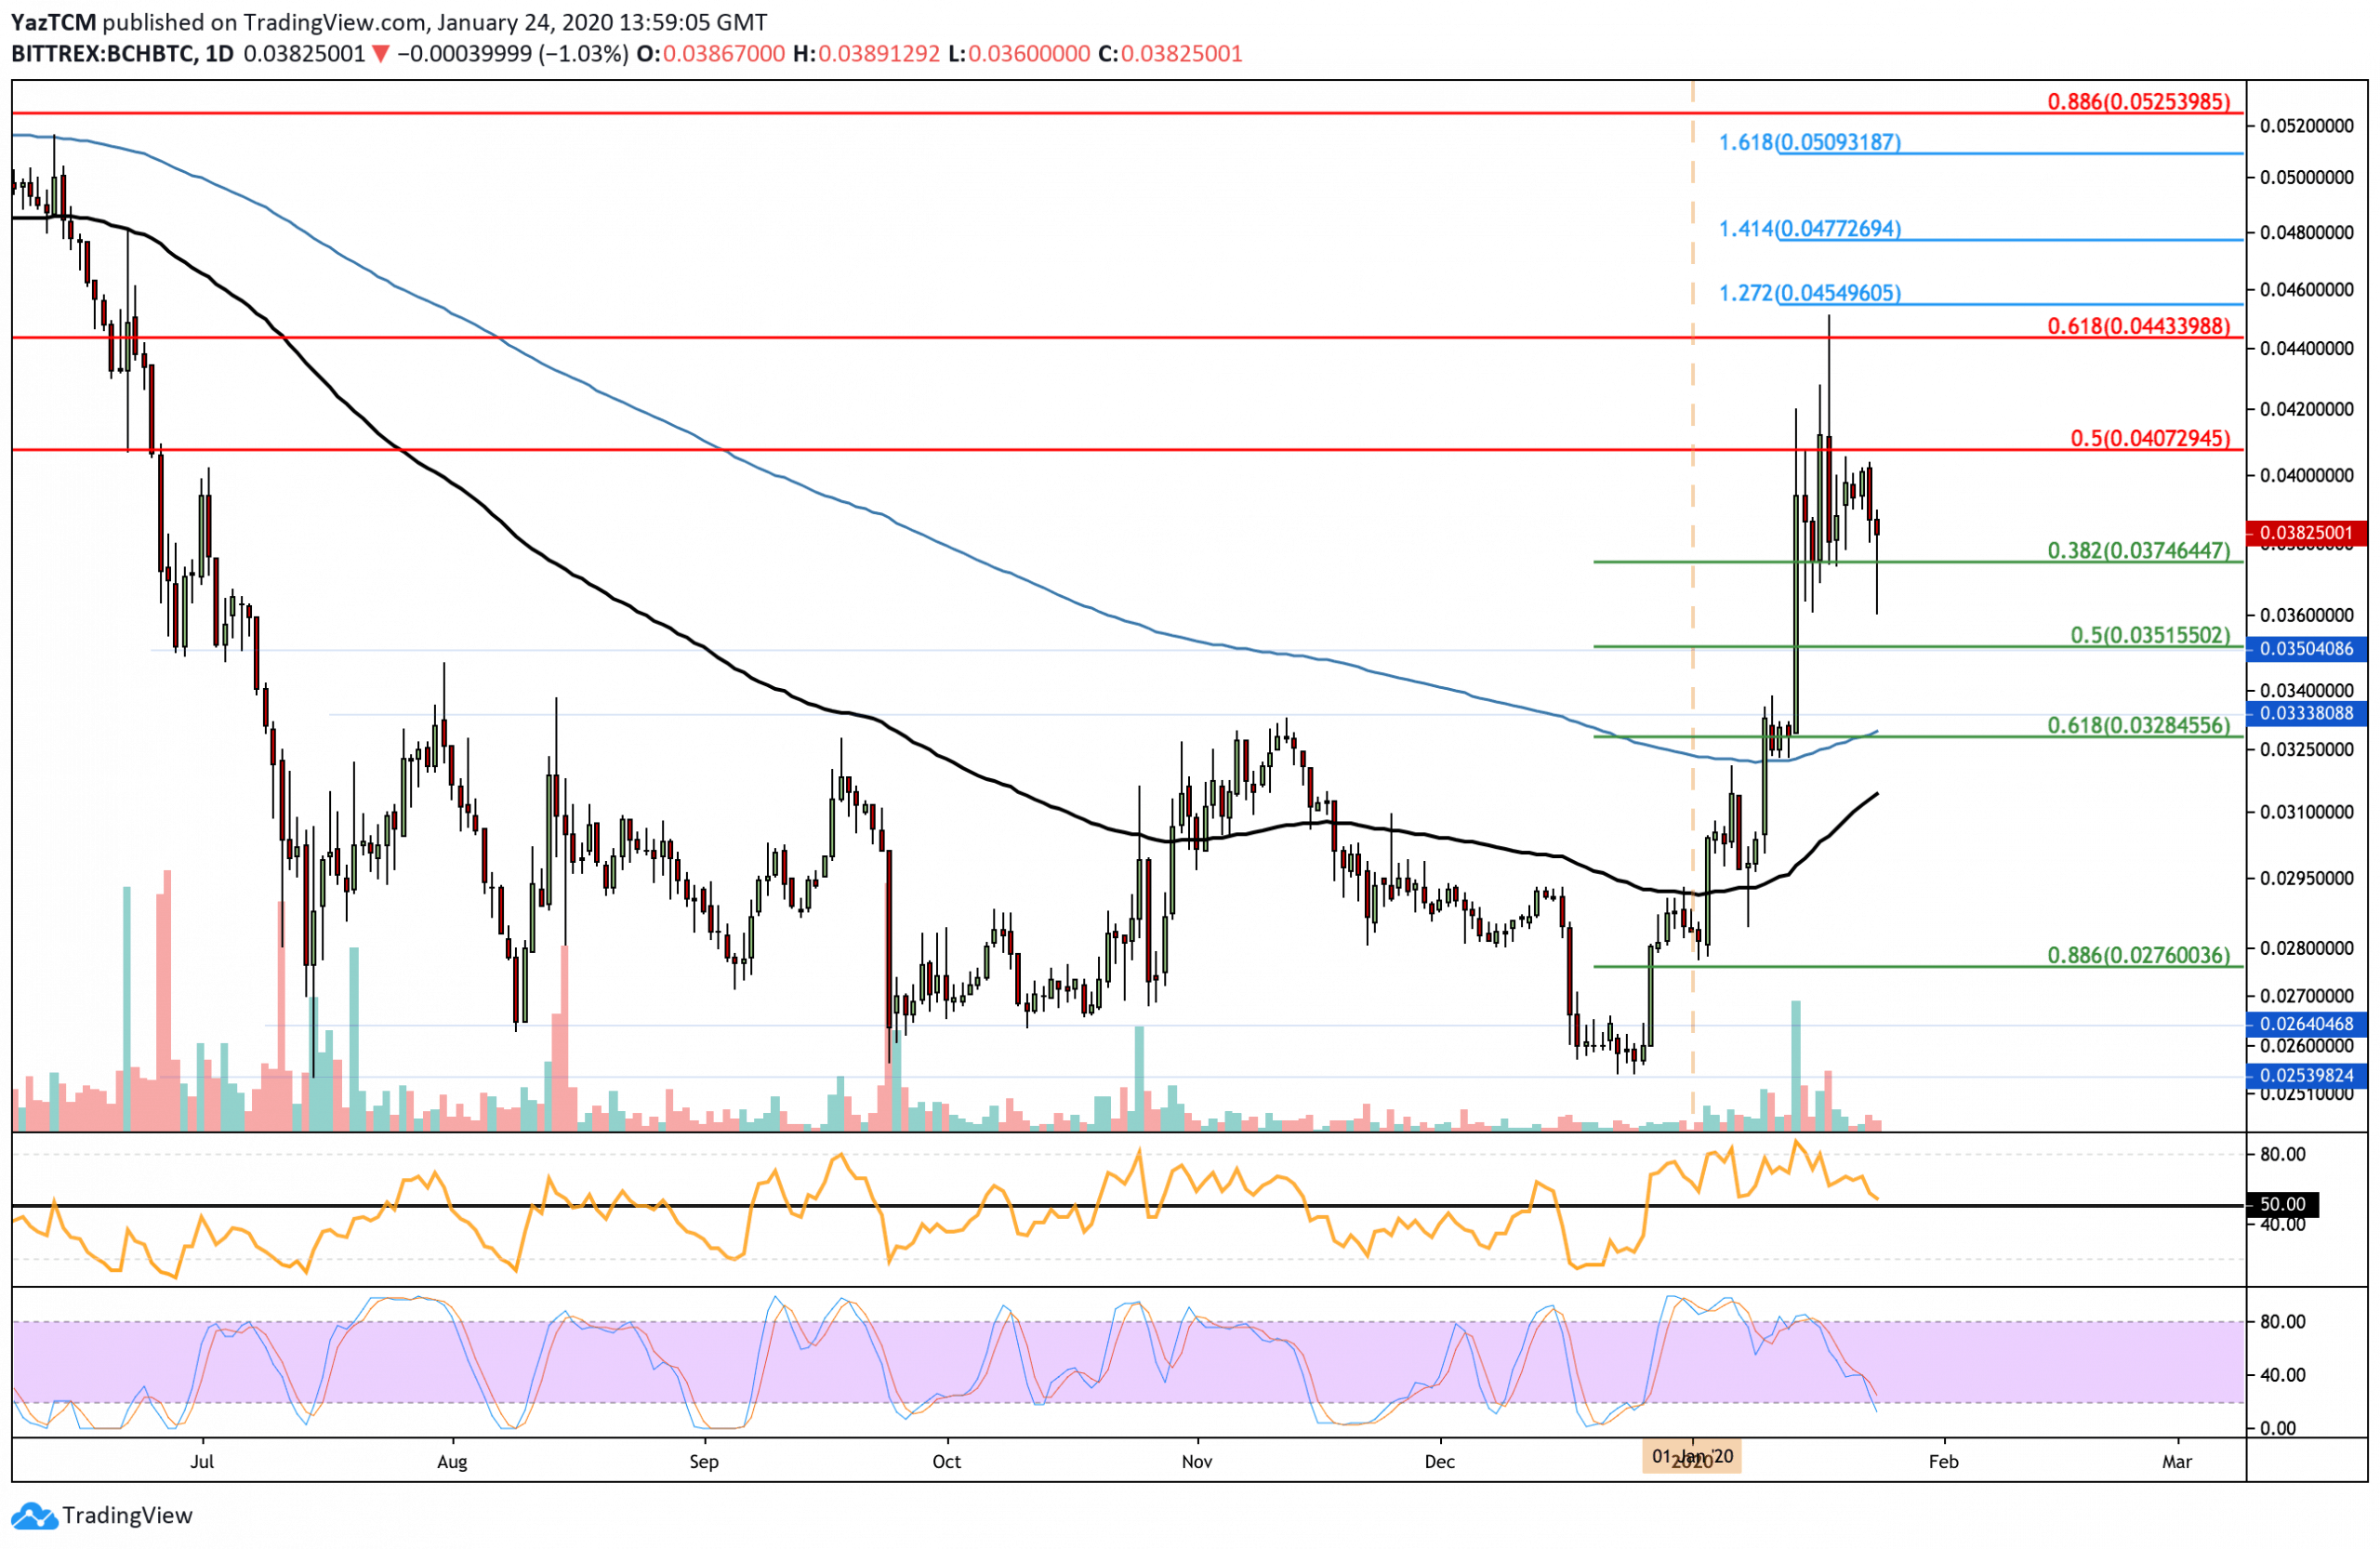
Against BTC, Bitcoin Cash managed to reach a high above 0.044 BTC this week. After meeting this resistance, it rolled over and started to fall into the current support at 0.037 BTC (short term .382 Fibonacci Retracement). The Stochastic RSI has reached extreme oversold conditions and is primed for a bullish crossover signal, which suggests that this round of selling may be reaching completion.
If the buyers rebound from 0.038 BTC, higher resistance lies at 0.0407 BTC (bearish .5 Fib Retracement) and 0.044 BTC (bearish .618 Fib Retracement). Above this, resistance lies at 0.045 BTC and 0.0477 BTC. On the other hand, if the sellers push beneath 0.037 BTC, support is found at 0.026 BTC, 0.035 BTC (.5 Fib Retracement), 0.034 BTC, and 0.0328 BTC (.618 Fib Retracement and 200-days EMA).
Dash
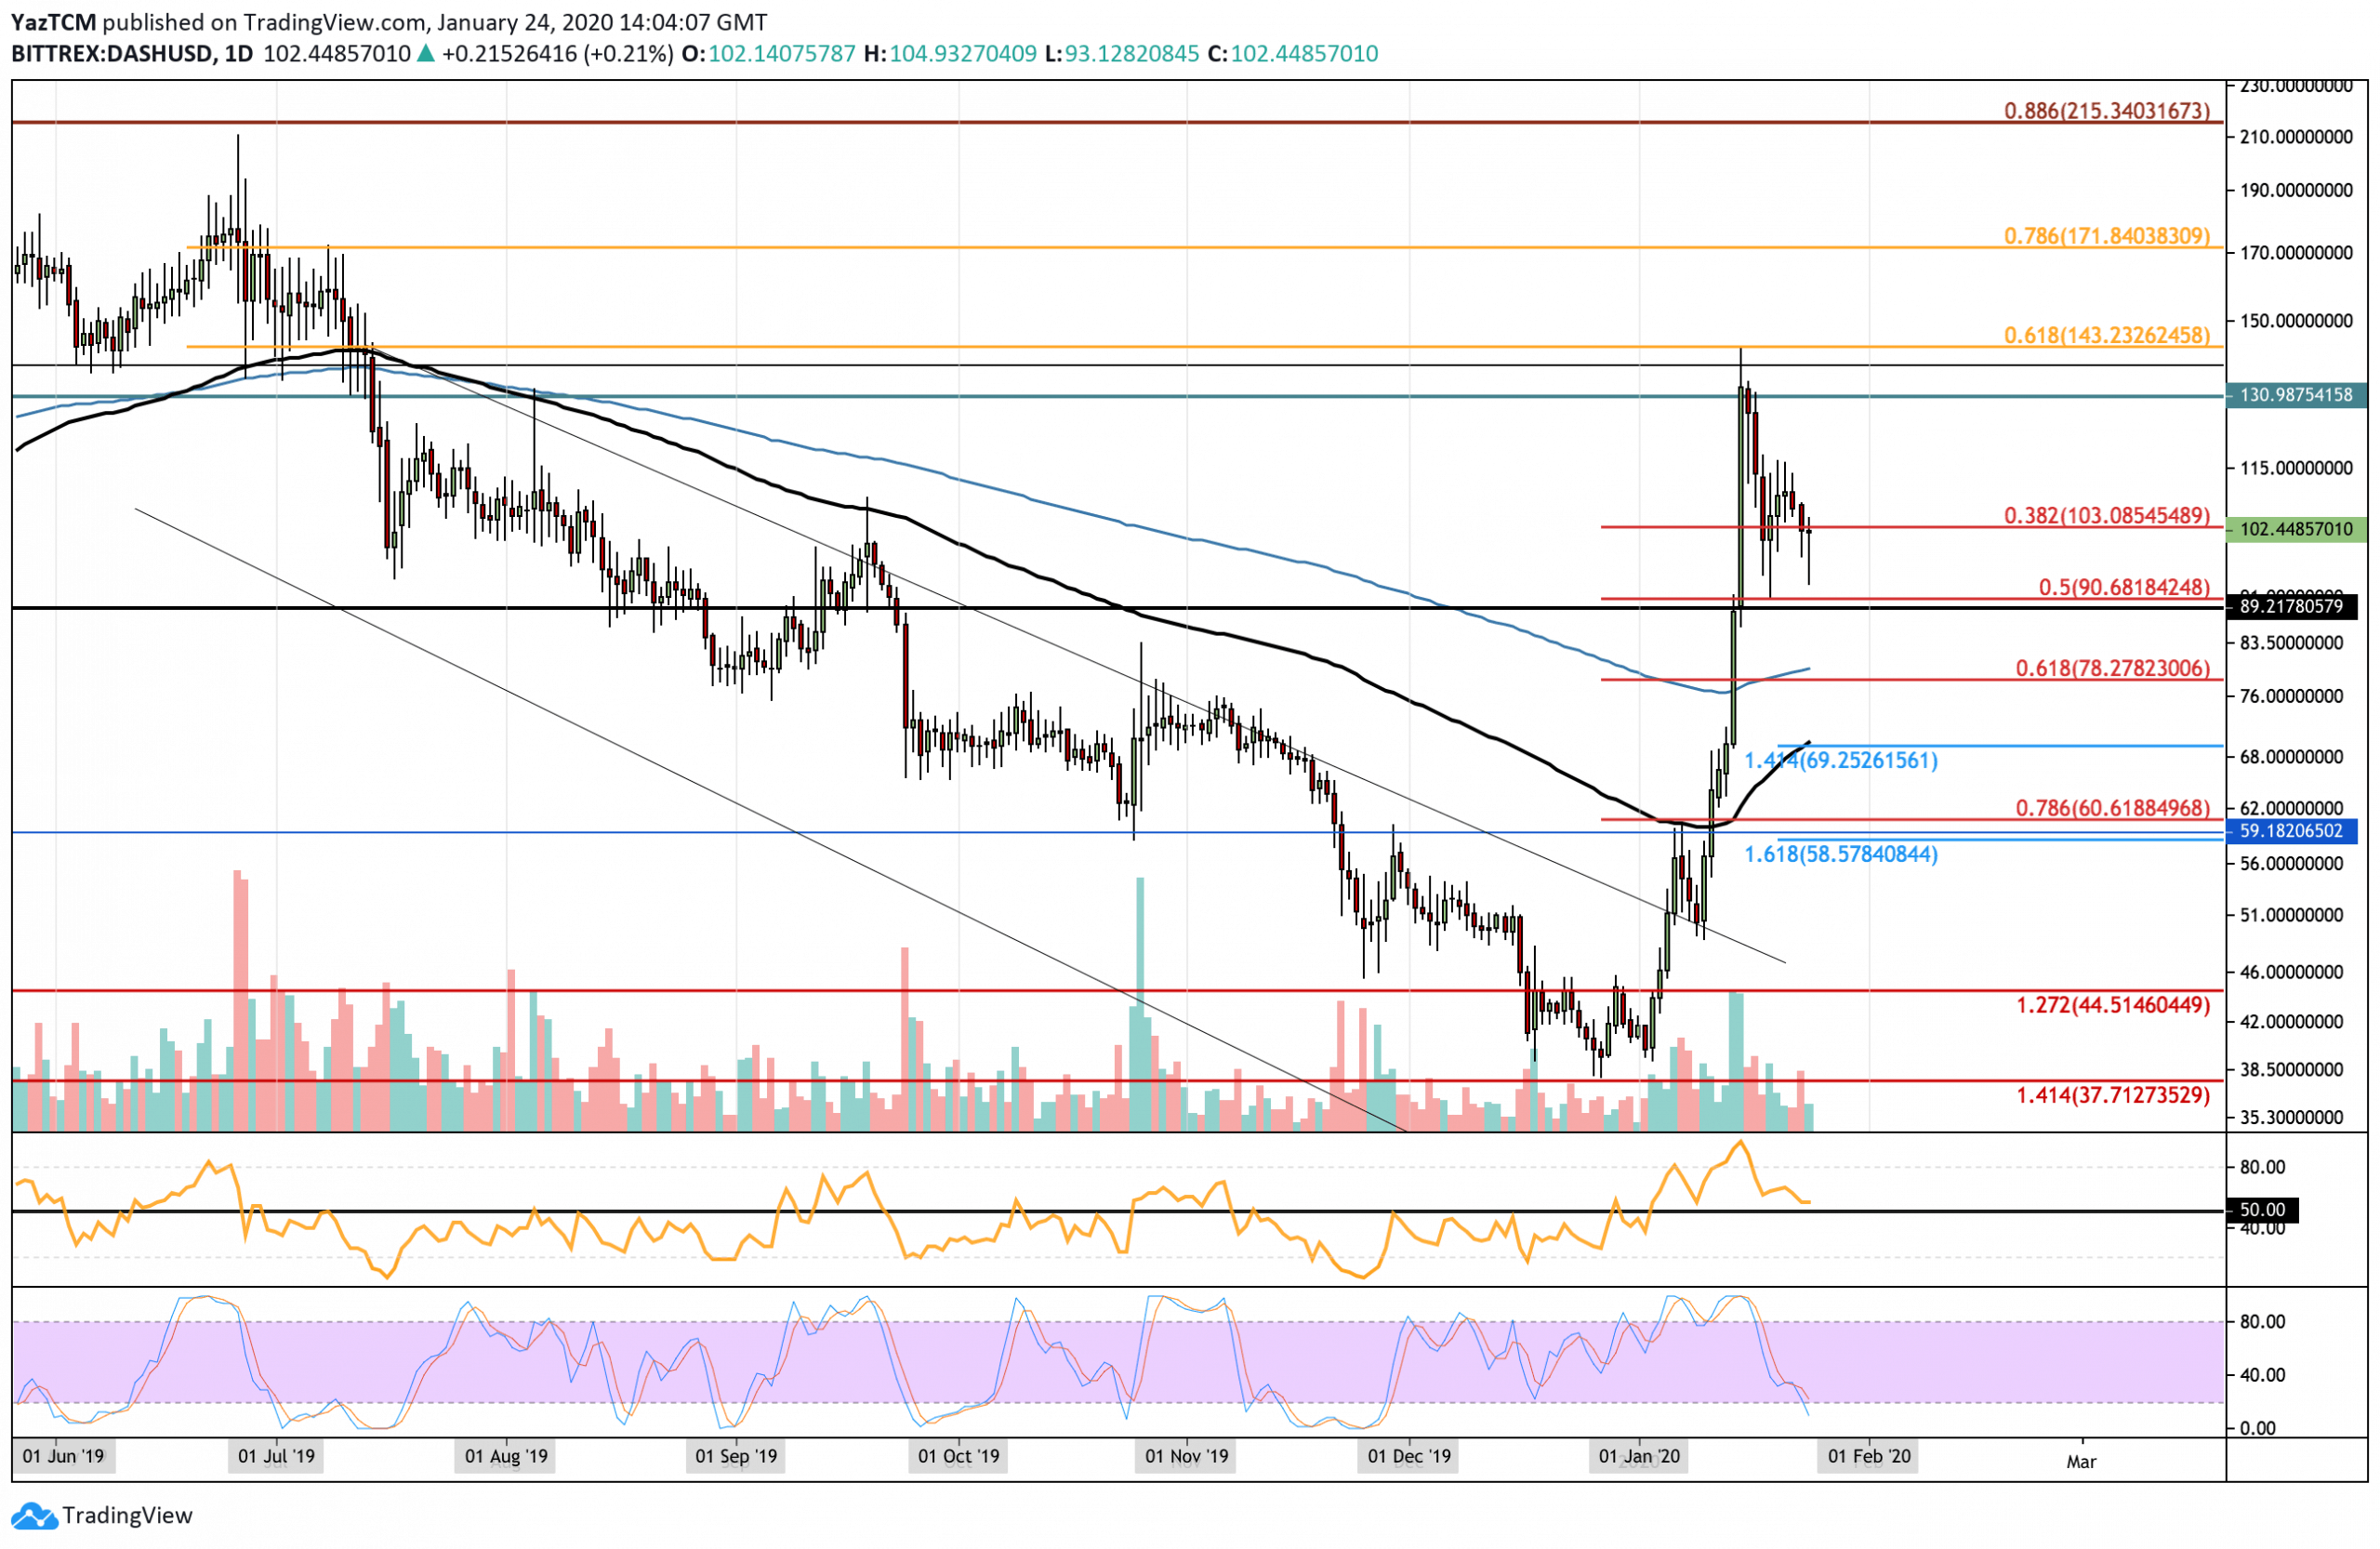
Dash dropped by a steep 14.5% this week, bringing the price for the coin down to $102. The cryptocurrency started the year off at around $40 and went on to explode by a total of 265% to reach a high of $143. Dash rolled over after meeting this resistance to trade at the current $102 level.
Looking ahead, if the buyers hold above $100 and push higher, resistance lies at $130 and $143 (bearish .618 Fibonacci Retracement level). Above this, additional resistance lies at $171 (bearish .786 Fib Retracement) and $200. Alternatively, if the sellers push beneath $100, support can be found at $90 (short term .5 Fib Retracement), $79 (short term .618 Fib Retracement & 200-days EMA), and $70 (downside 1.414 Fib Extension and 100-days EMA).
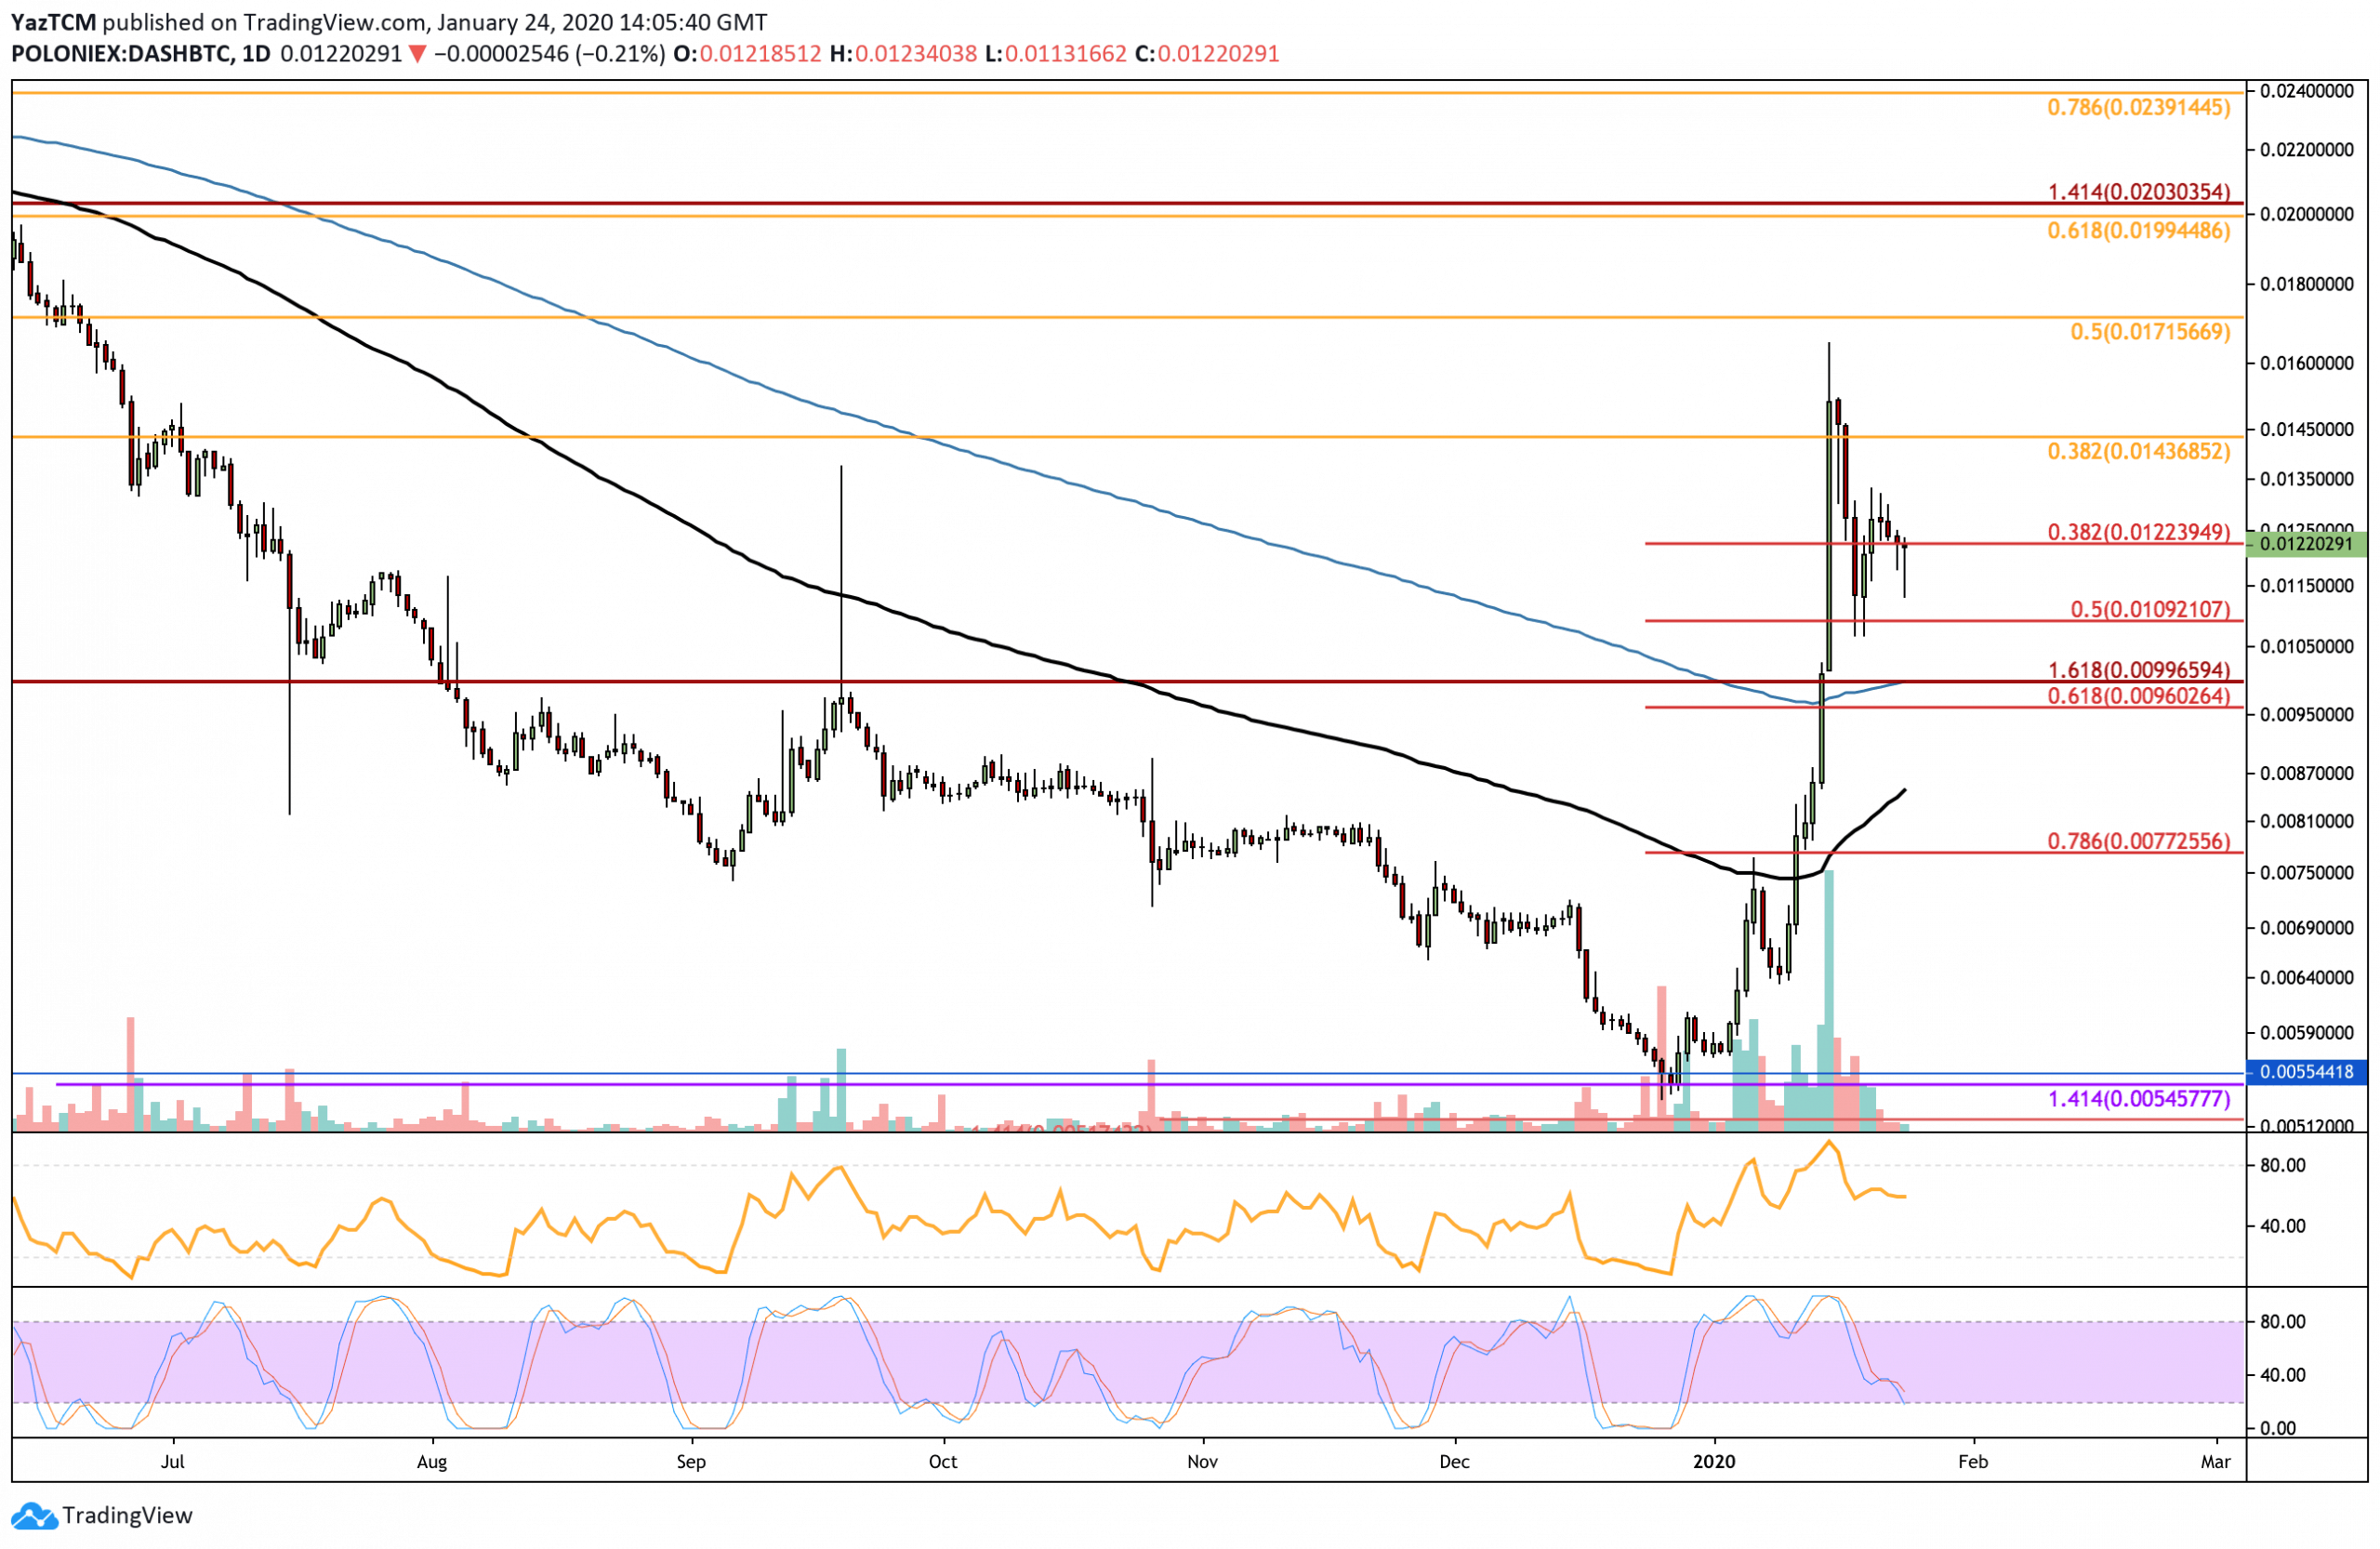
Against BTC, Dash surged above the 0.016 BTC level this week before reversing and rolling over. It found support at the 0.01 BTC level, which let it rebound to the current 0.0122 BTC trading level. The bulls remain in control of the momentum while the Stochastic RSI approaches oversold conditions that suggest a bullish push higher could be imminent.
Looking ahead, if Dash drops beneath 0.0122 BTC, support can be found at 0.0109 BTC (short term .5 Fib Retracement). Beneath this, additional support lies at 0.01 BTC (200-days EMA), 0.0087 BTC (100-days EMA), and 0.0077 BTC. On the other hand, if the bulls push higher from 0.012 BTC, the first levels of resistance lie at 0.0143 BTC and 0.016 BTC. Above this, resistance lies at 0.0171 BTC (bearish .5 Fib Retracement) and 0.020 BTC (bearish .618 Fib Retracement).
Disclaimer: Information found on CryptoPotato is those of writers quoted. It does not represent the opinions of CryptoPotato on whether to buy, sell, or hold any investments. You are advised to conduct your own research before making any investment decisions. Use provided information at your own risk. See Disclaimer for more information.
Cryptocurrency charts by TradingView.
Technical analysis tools by Coinigy.
The post appeared first on CryptoPotato


