Bitcoin
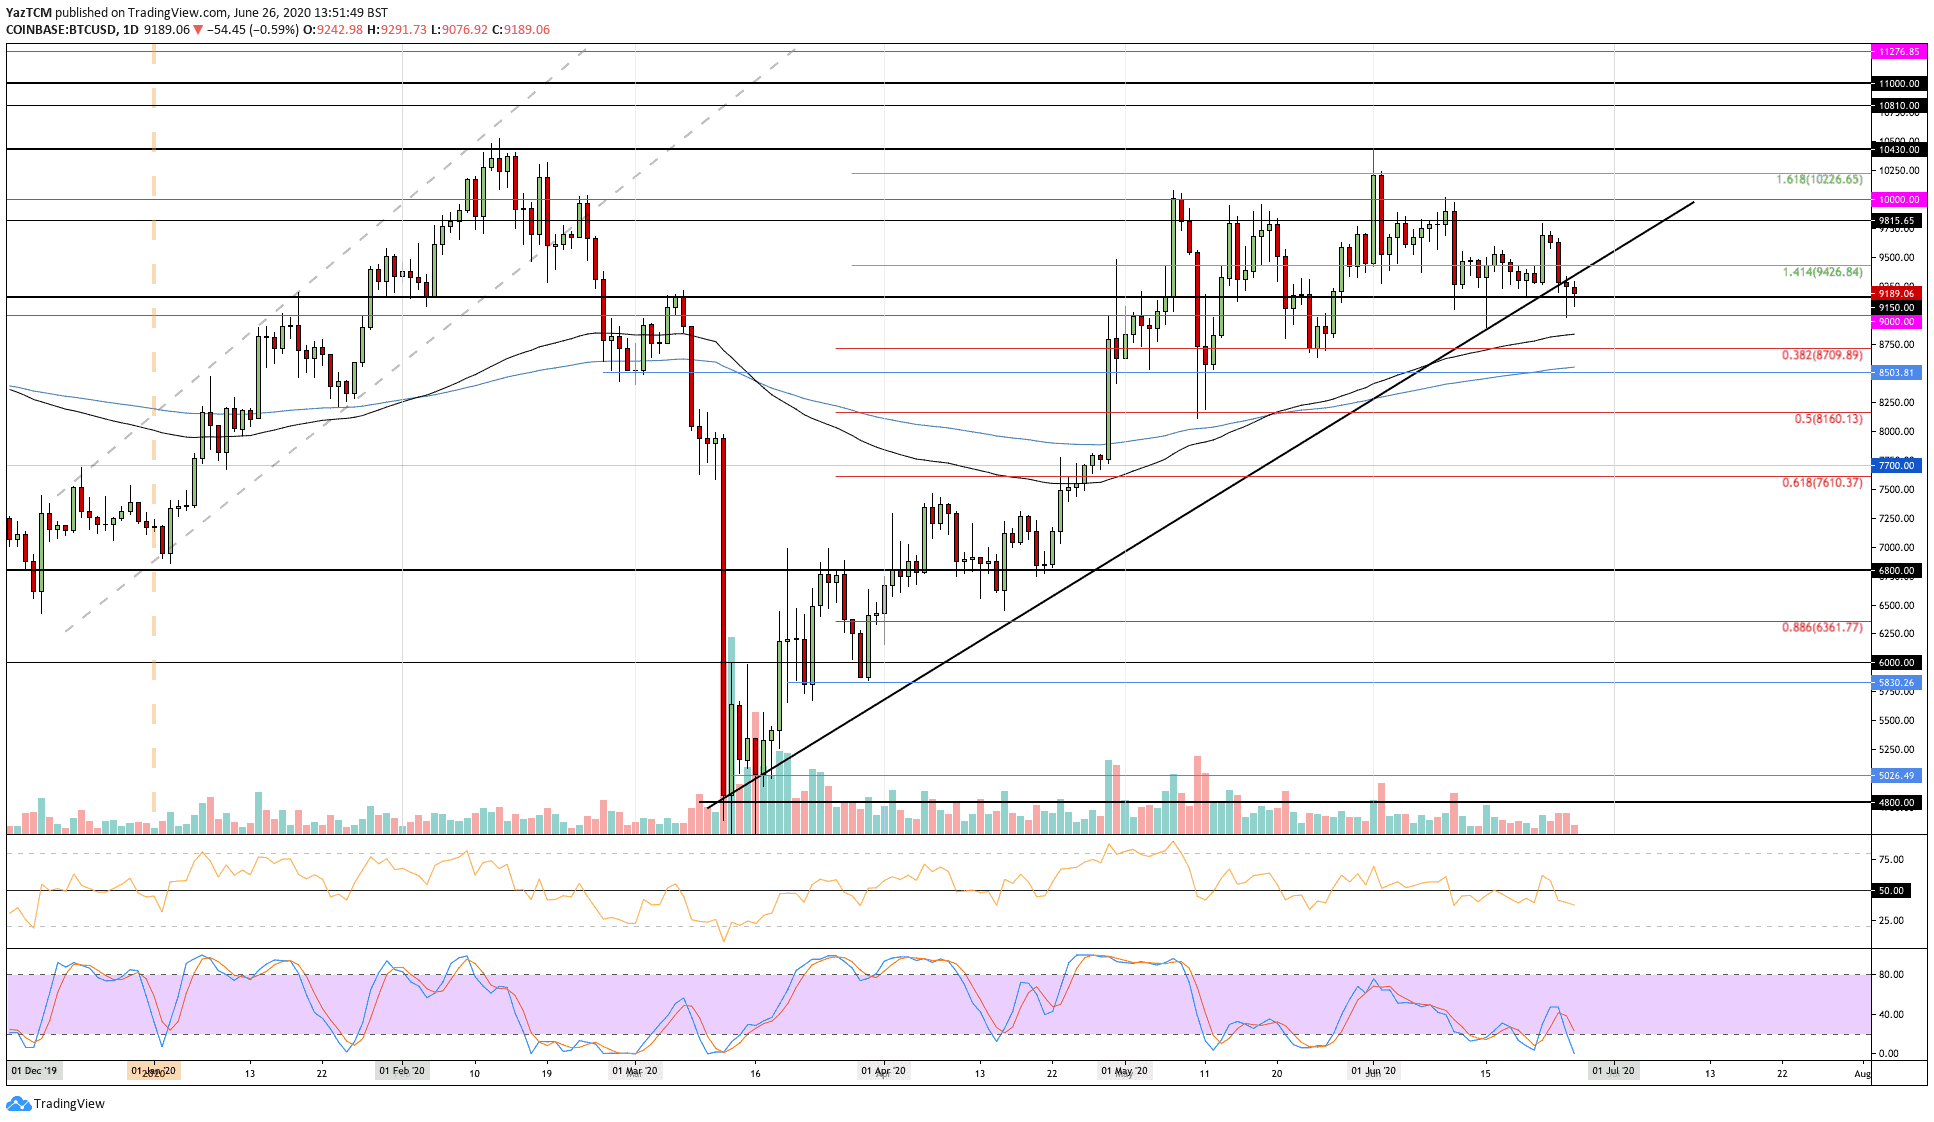
Bitcoin witnessed a 1.5% price decline over the past week as the cryptocurrency drops into the $9,190 level. The coin was trading at this price at the start of the week as it managed to push higher into the $9,815 level. BTC was unable to overcome this resistance, which caused it to fall back into $9,190.
The crucial thing about this week’s price drop is the fact that BTC looks like it broke beneath a rising trend line that has been in play since mid-March 2020. If BTC continues beneath $9,150, it could result in it unwinding back beneath $8,500.
Looking ahead, if the bulls rebound from $9,150, the first level of resistance lies at $9,500. Above this, added resistance is found at $9,815, $10,000, and $10,226.
On the other side, if the sellers push beneath $9,150, support lies at $9,000, $8,700 (.382 Fib Retracement), and $8,500 (200-days EMA).
Ethereum
Ethereum saw a small 1% price increase this week as the coin trades at $231. ETH started the week by rebounding from the $225 level as it pushed higher to re-test the $250 resistance. The buyers could not capitalize above $250, which caused it to fall back into the $230 level.
Interestingly, ETH is still finding support at a rising trend line, which keeps the bullish run intact. It can be expected to push toward $250 again, so long as ETH can remind above this trend line.
Moving forward, if the buyers rebound from the trend line, the first level of resistance lies at $245 (bearish .786 Fib Retracement). Above this, resistance is located at $250 and $265 (bearish .886 Fib Retracement).
Alternatively, if the sellers push beneath the trend line, the first level of support lies at $225. Beneath this, support is located at $215 (.236 Fib Retracement), $210 (100-days EMA), and $200 (200-days EMA).

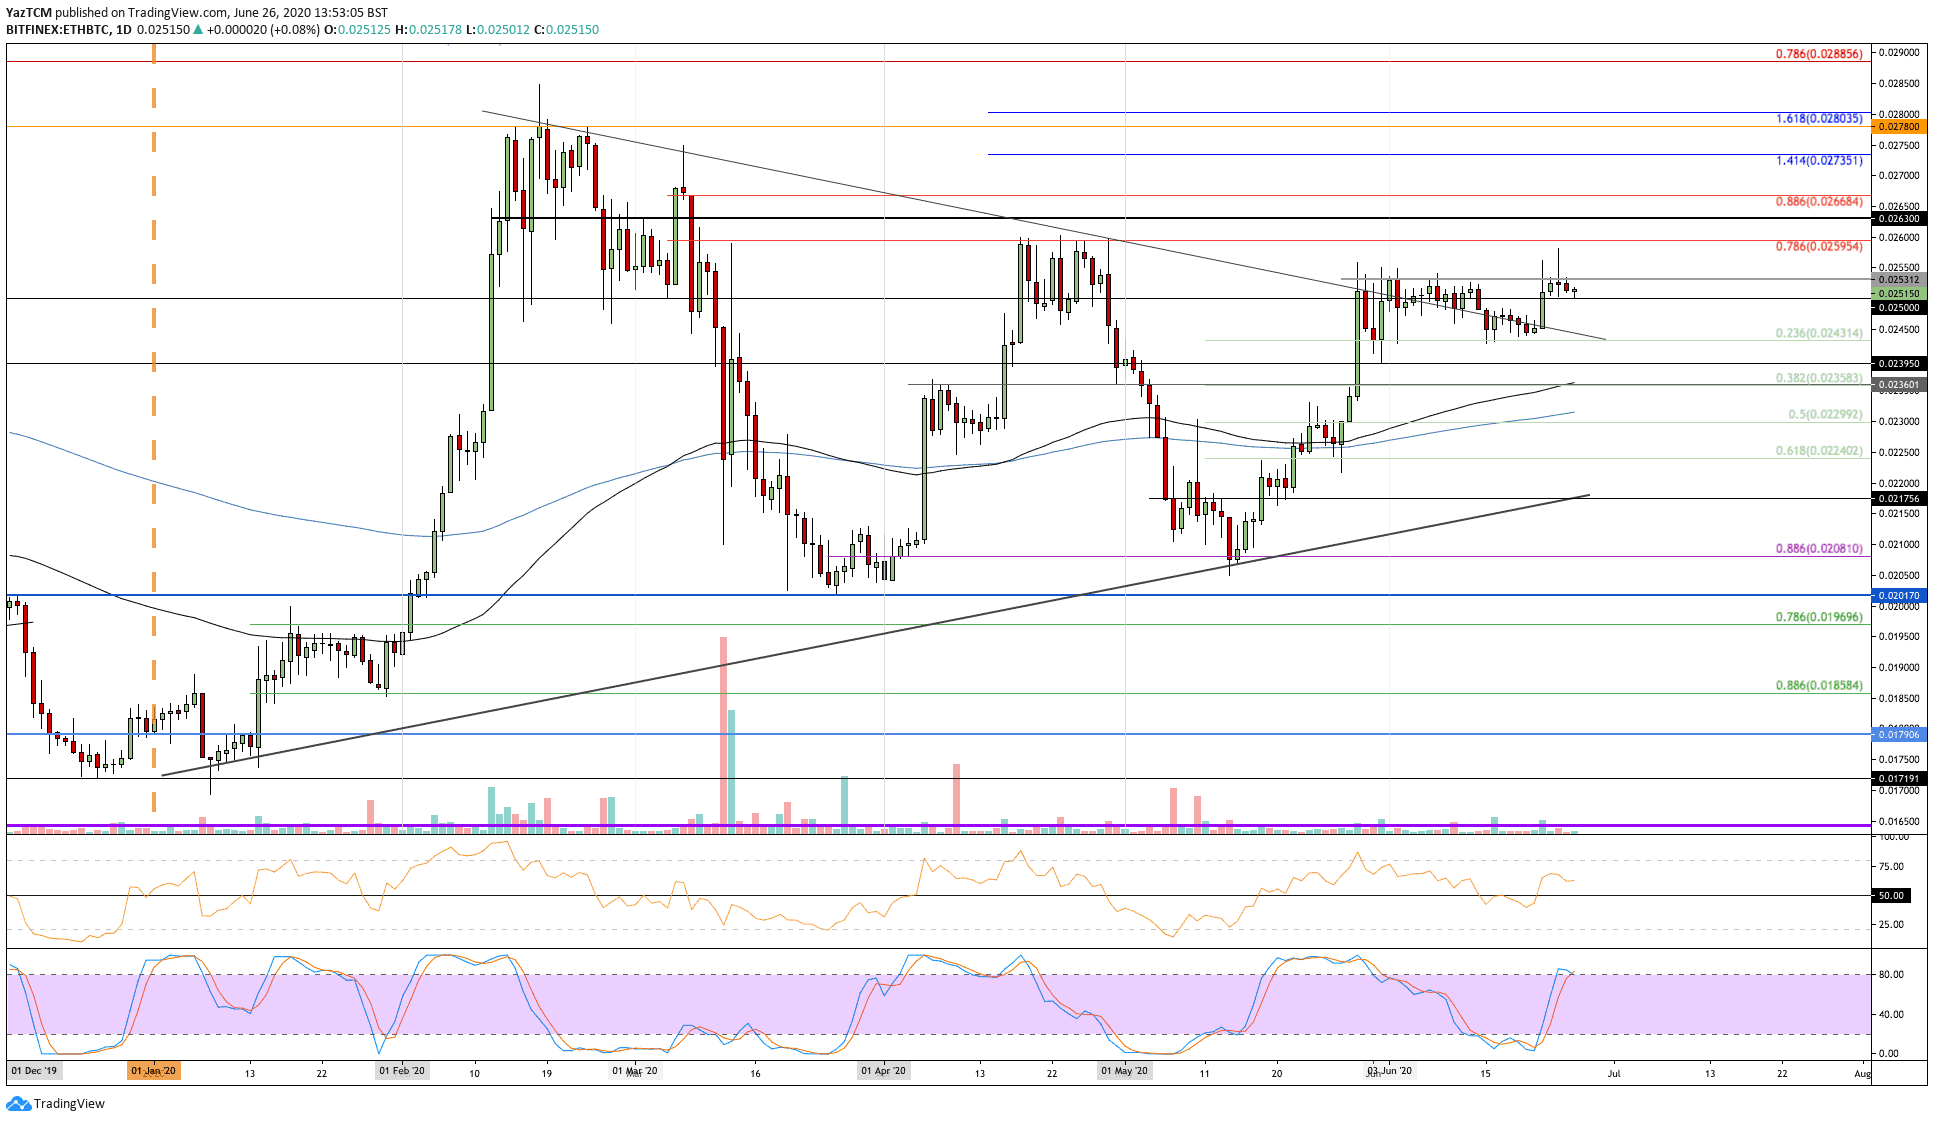
Against Bitcoin, ETH climbed from 0.0245 BTC to reach the current 0.0251 BTC level. During the week, ETH attempted to push higher above the June 0.0253 BTC resistance but was unable to break above the level.
0.0253 BTC has provided ample resistance for the market during both May and June and must be overcome for ETH to continue higher.
Looking ahead, once the 0.0253 BTC resistance is broken, higher resistance lies at 0.026 BTC (bearish .786 Fib Retracement), 0.0263 BTC, and 0.0266 BTC (bearish .886 Fib Retracement).
On the other side, if the sellers push beneath 0.025 BTC, support can be found at 0.0243 BTC (.236 Fib Retracement), 0.0239 BTC, and 0.0235 BTC (.382 Fib Retracement & 100-day EMA).
Ripple
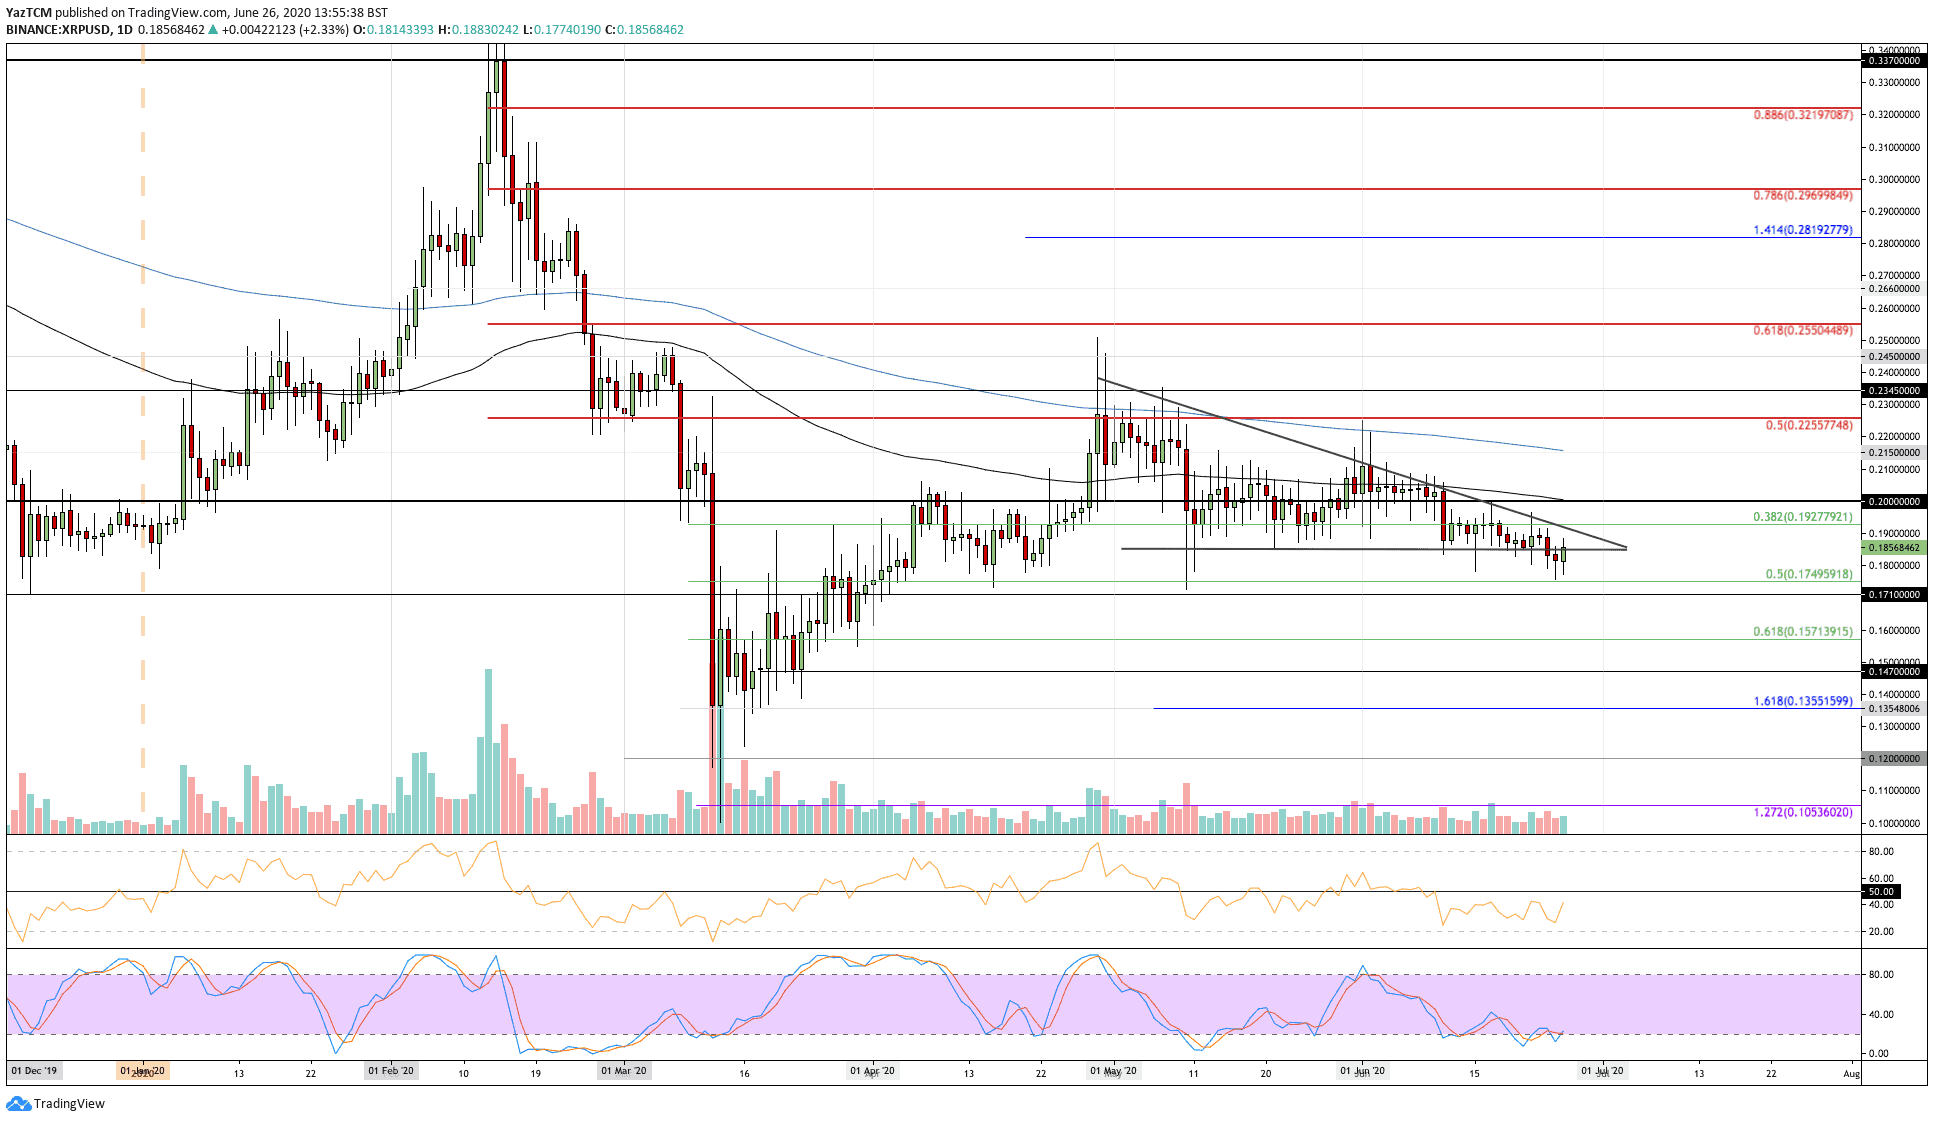
XRP witnessed a 2% price drop this week as it fell from $0.19 to reach the current $0.185 level. XRP dropped beneath a descending triangle pattern this week, which puts it into a very bearish trajectory.
The coin broke beneath the lower boundary of the consolidation pattern yesterday as it fell below $0.185. This could result in XRP heading lower over the following couple of weeks.
If the sellers continue to drive XRP lower, support can be expected at $0.175 (.5 Fib Retracement), $0.171, and $0.157 (.618 Fib Retracement).
On the other side, if the buyers push higher, the first level of resistance lies at $0.192. Above this, resistance is found at $0.20 (100-days EMA), and $0.215 (200-day EMA).
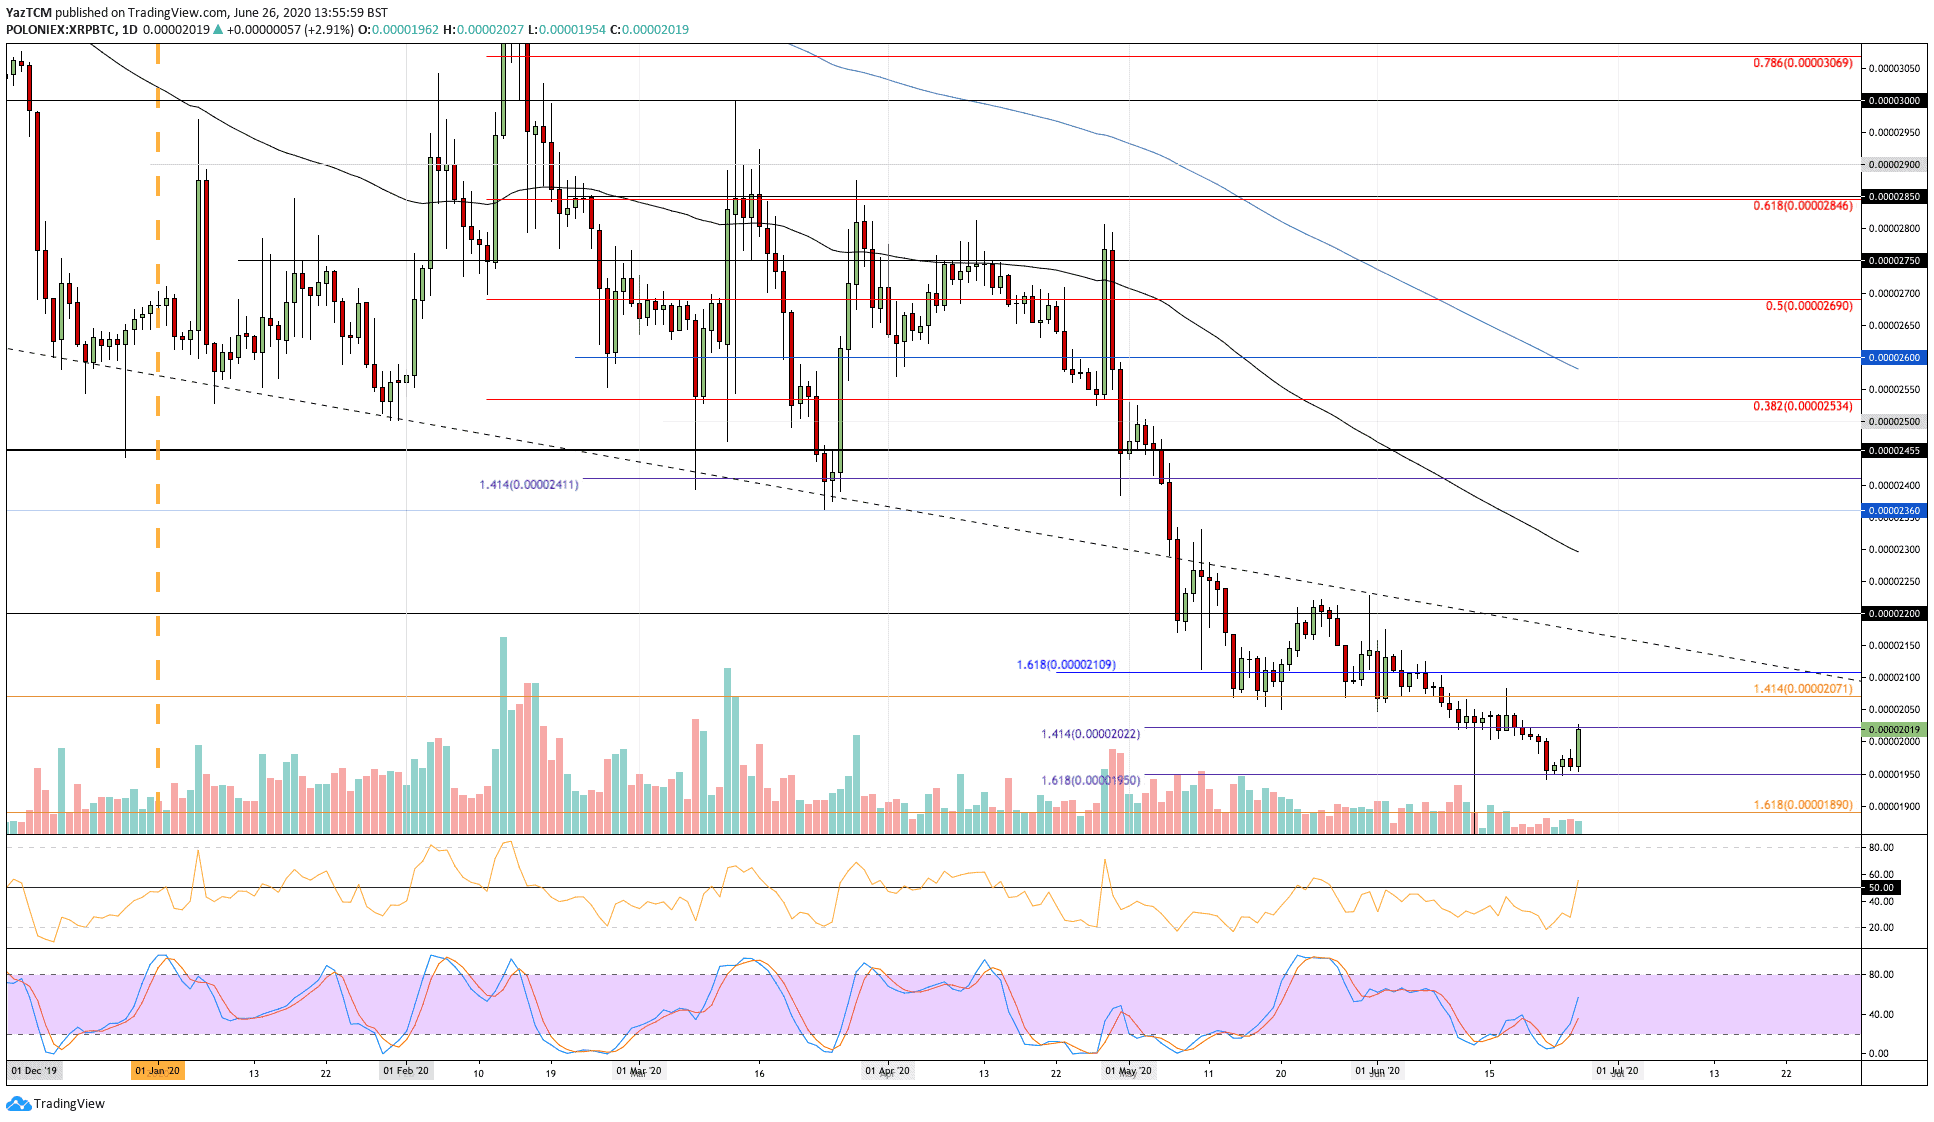
Against Bitcoin, XRP managed to rebound from the 1950 SAT support today to climb back into 2020 SAT. The coin had dropped beneath 2000 SAT during the week as the coin headed lower into the 1950 SAT support, where it rebounded.
Moving forward, if the buyers can continue above 2022 SAT, resistance is found at 2070 SAT, 2100 SAT, and 2150 SAT.
Alternatively, if the sellers push lower, the first level of support lies at 2000 SAT. Beneath this, support is expected at 1950 SAT and 1890 SAT.
Aave
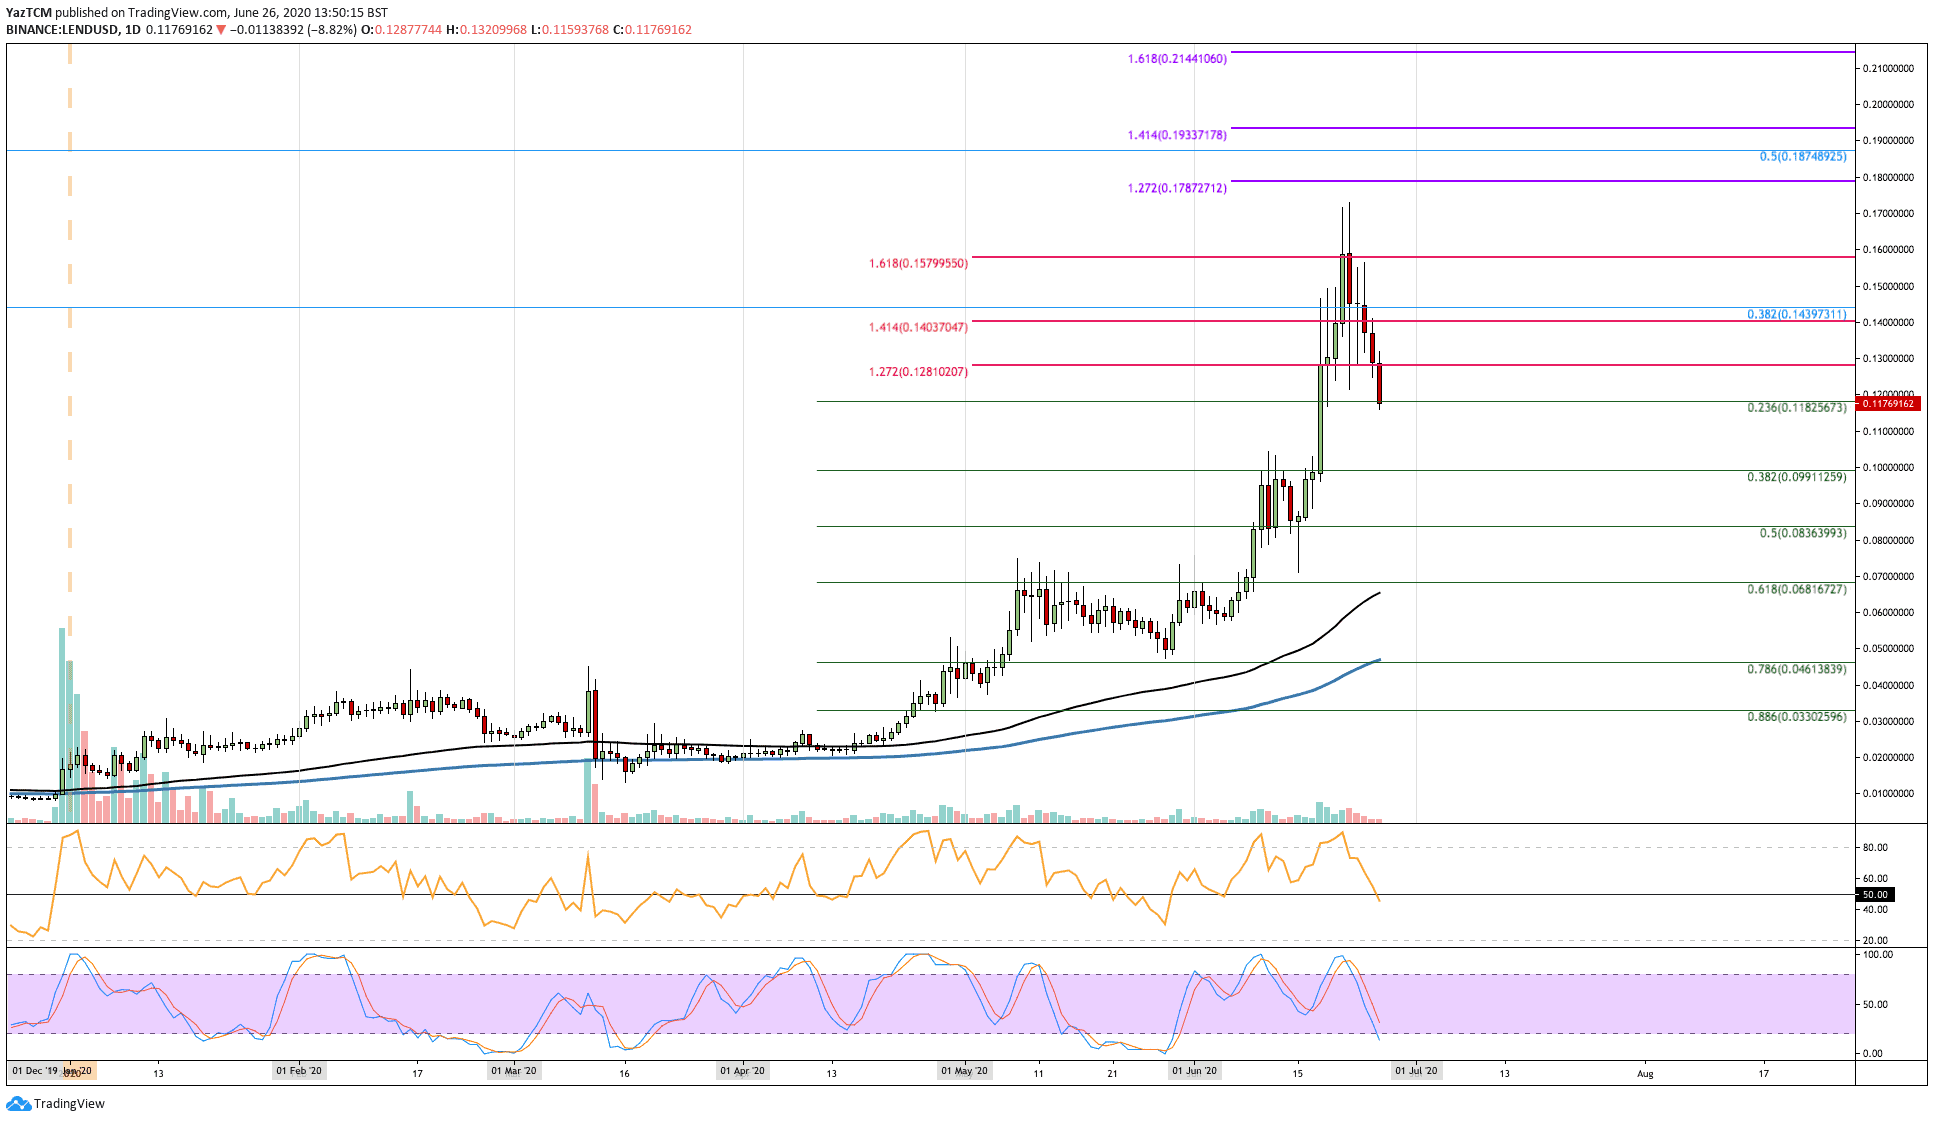
LEND might have seen a sharp 12% price drop this week, but the coin is still up by a total of 472% over the past three months. LEND had surged as high as $0.17 in June and started to fall from here at the start of this week.
During the week, LEND fell from $0.157 as it headed lower to find the current support at $0.118 (.236 Fib Retracement level). Before this, LEND was surging as it pumped from as low as $0.04 in May to reach the $0.17 high in June.
Looking ahead, if the sellers continue beneath $0.118, the first level of strong support lies at $0.1 (.382 Fib Retracement). Beneath this, support lies at $0.09, $0.0836 (.5 Fib Retracement), and $0.08.
On the other side, the first level of resistance lies at $0.128. Above this, resistance is found at $0.143 (bearish .382 Fib Retracement), $0.16, and $0.178 (1.272 Fib Extension).
Against Bitcoin, LEND started the week by surging to 1813 SAT, creating a fresh high for 2020. From there, LEND began to fall as it headed lower to reach the current 1283 SAT level.
Looking ahead, if the sellers continue to drive LEND lower, the first level of support lies at 1172 SAT (.382 Fib Retracement). Beneath this, added support is located at 1100 SAT, 1000 SAT, and 970 SAT (.5 Fib Retracement).
Alternatively, if the buyers can regroup and push higher, the first level of resistance lies at 1500 SAT. Above this, resistance is found at 1760 SAT (bearish .618 Fib Retracement), 1813 SAT, and 1950 SAT (1.414 Fib Extension).
NEXO
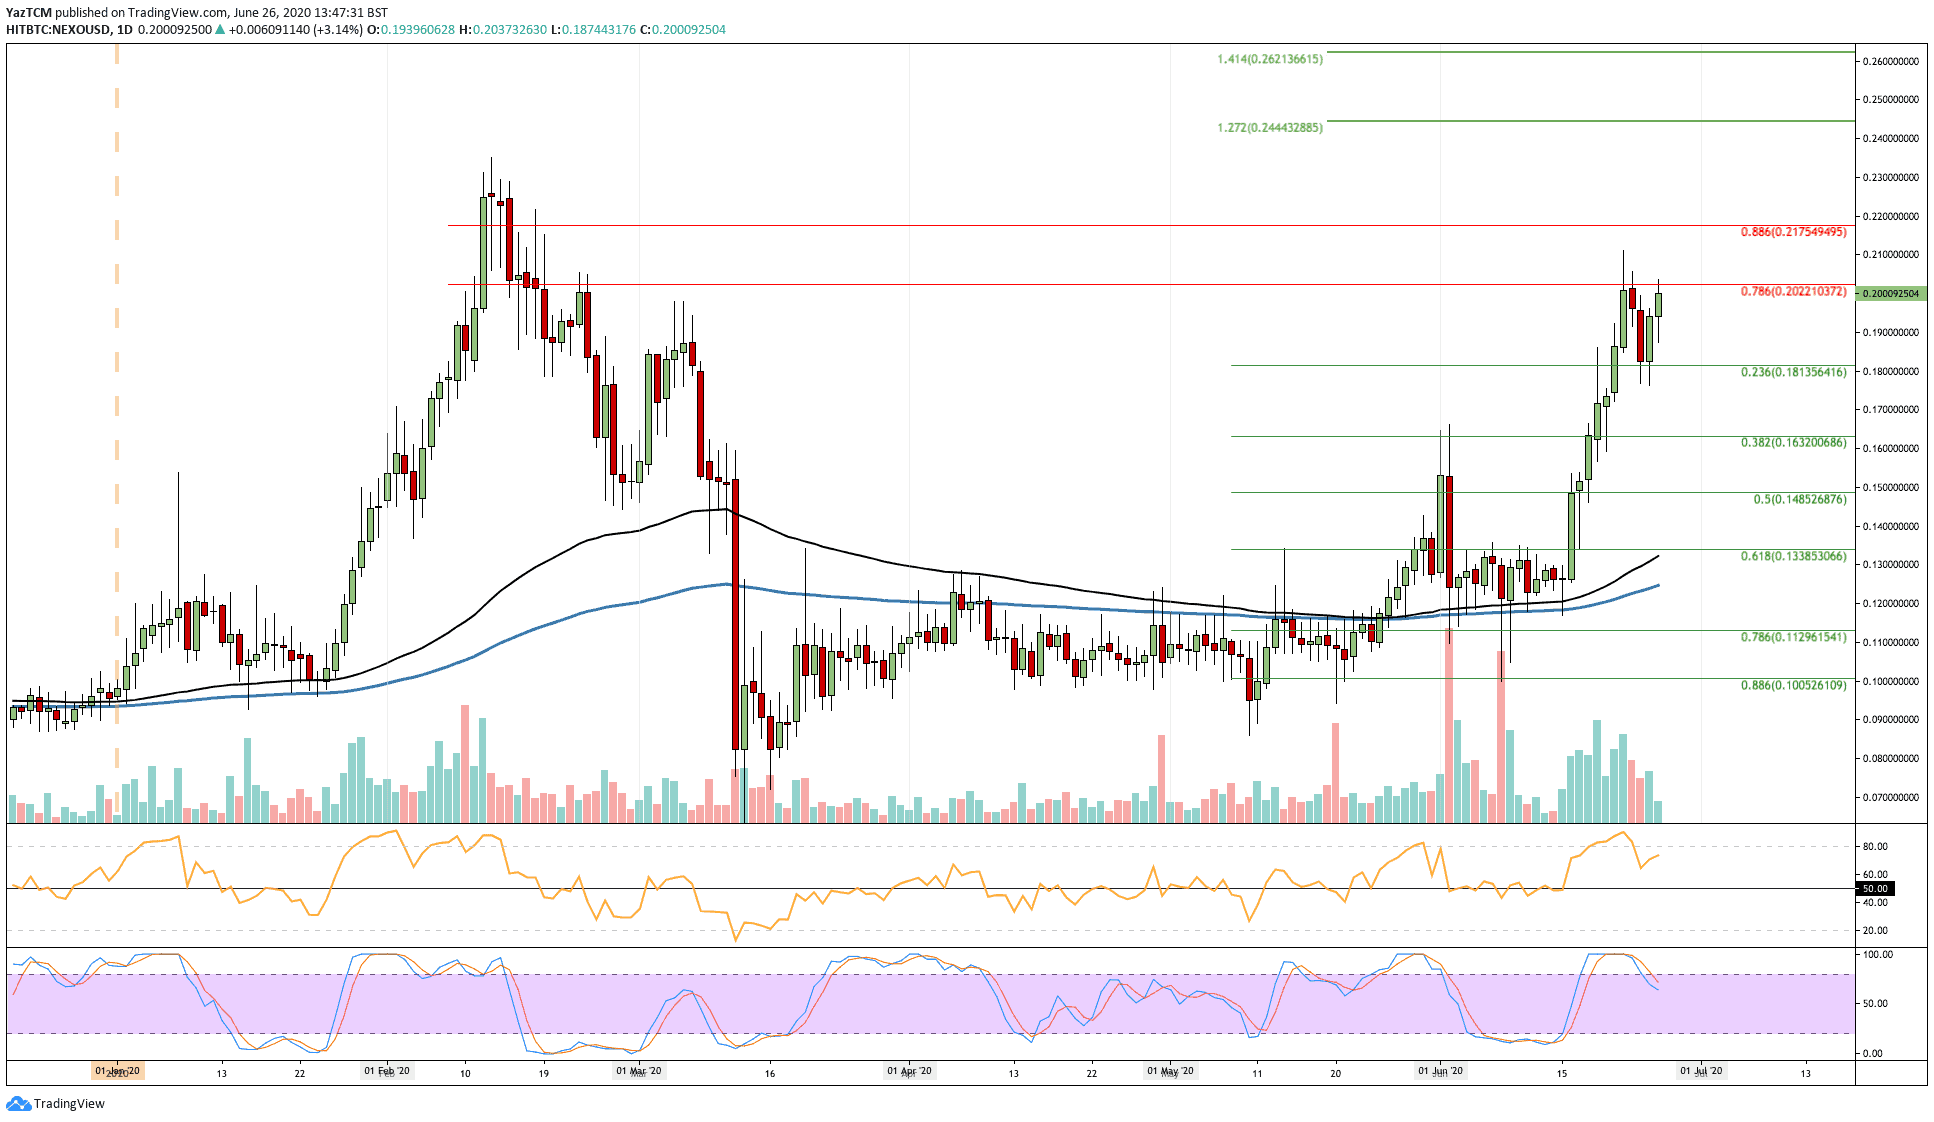
NEXO witnessed a strong 16% price increase this week as the cryptocurrency climbs from as low as $0.16 to reach the current resistance at $0.2. NEXO is currently struggling to break the $0.2 resistance, which is provided by a bearish .786 Fib Retracement level.
Looking ahead, if the bulls can break $0.202, higher resistance lies at $0.217 (bearish .886 Fib Retracement), $0.22, and $0.23.
On the other side, the first level of support lies at $0.181 (.236 Fib Retracement). Beneath this, support is found at $0.17, $0.163 (.382 Fib Retracement), and $0.148 (.5 Fib Retracement).
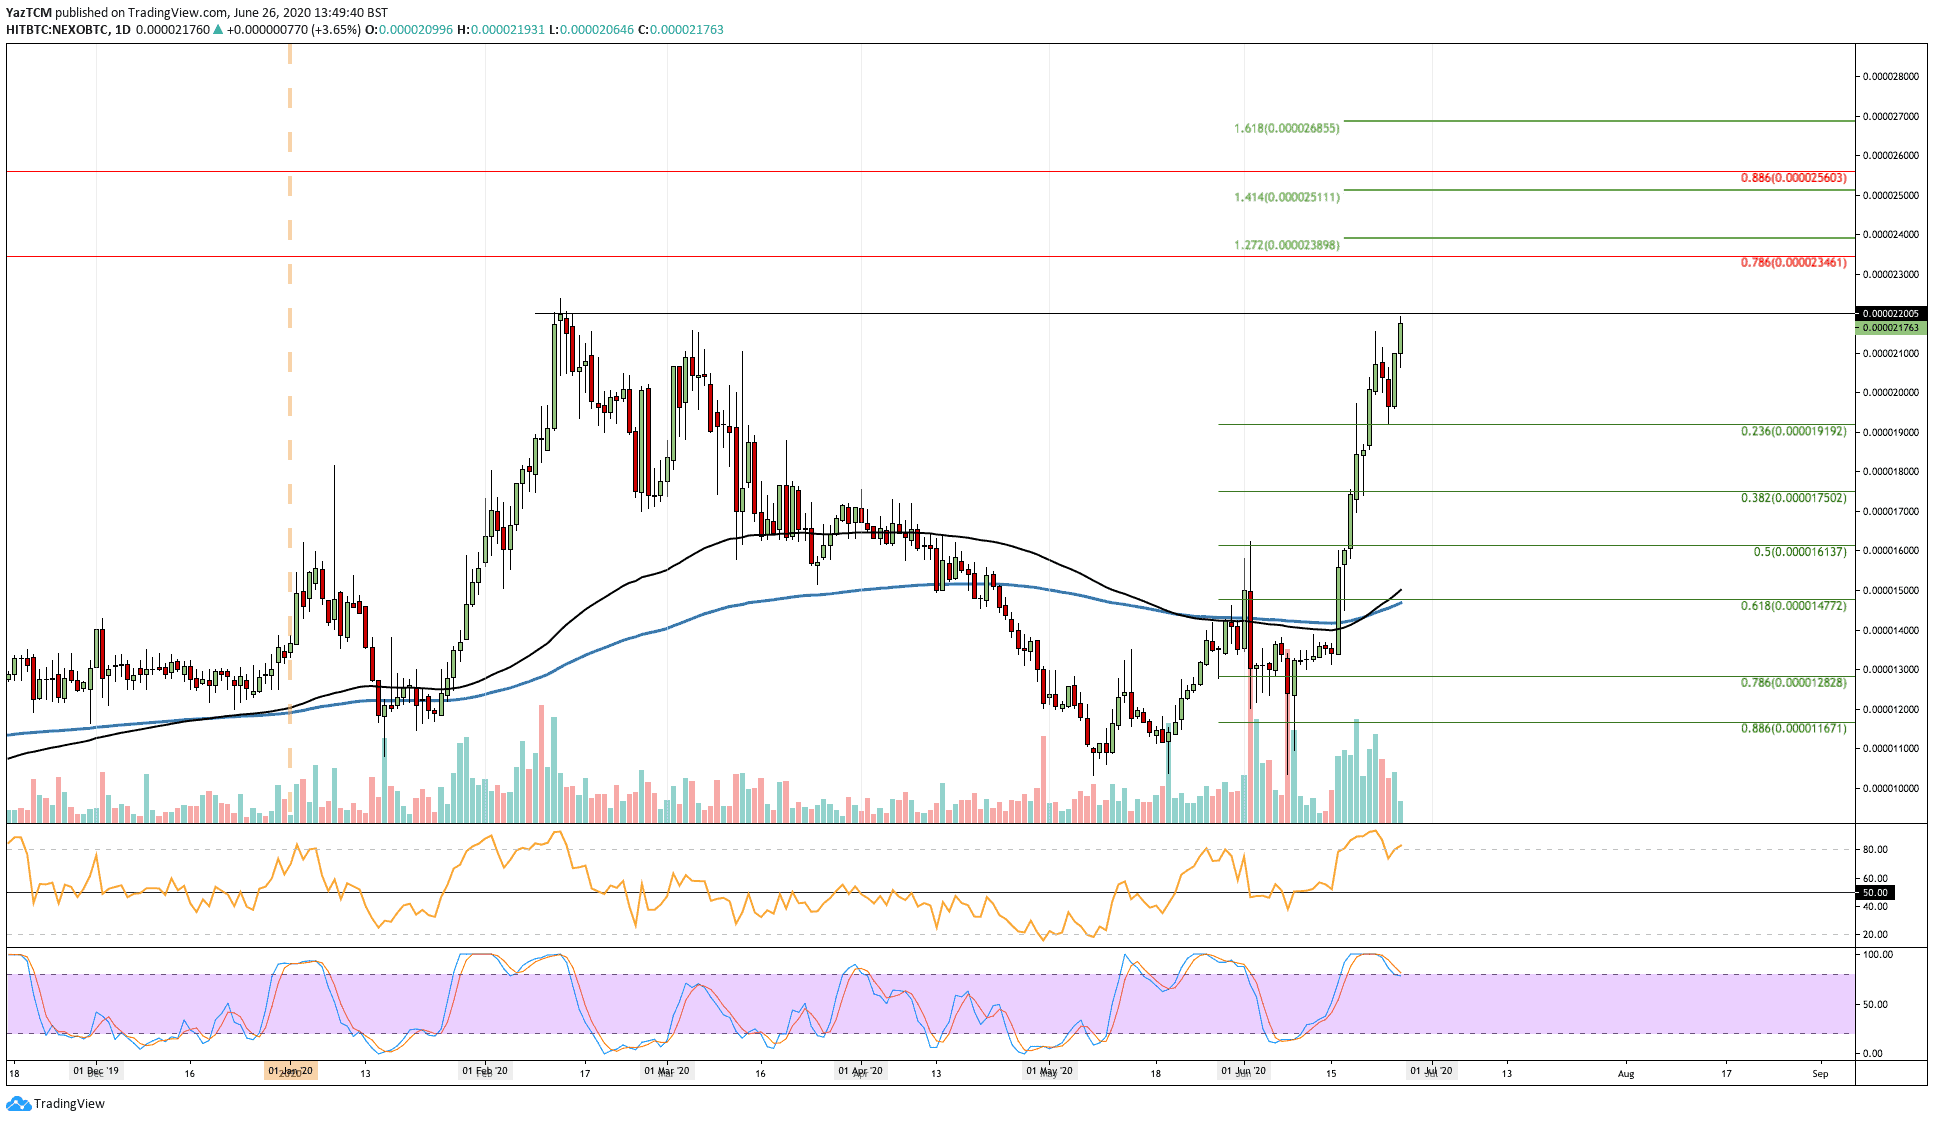
NEXO has also been on a rampage against BTC as it climbs from as low as 1750 SAT to reach the current 2200 SAT level. This current resistance is actually the 2020 high price for NEXO, and a break beyond this would see the coin creating fresh 2020 highs.
Looking ahead, if the bulls can break 2200 SAT, resistance is then found at 2346 SAT (bearish .786 Fib Retracement). Above this, added resistance lies at 2400 SAT, 2511 SAT (1.414 Fib Extension), and 2560 SAT (bearish .886 Fib Retracement).
On the other side, if the sellers push lower, the first level of support lies at 2000 SAT. Beneath this, added support is found at 1919 SAT (.236 Fib Retracement), 1800 SAT, and 1750 SAT (.382 Fib Retracement).

Click here to start trading on BitMEX and receive 10% discount on fees for 6 months.
Disclaimer: Information found on CryptoPotato is those of writers quoted. It does not represent the opinions of CryptoPotato on whether to buy, sell, or hold any investments. You are advised to conduct your own research before making any investment decisions. Use provided information at your own risk. See Disclaimer for more information.
The post appeared first on CryptoPotato


