 Last month, we opened our spot exchange, along with our sweepstakes to win a share of $1,000,000 USD. Since then, we’ve received a tremendous response from our existing users, along with a number of new sign-ups.
For some, they’re trading on a crypto spot exchange for the first time and seeking to learn the ins and outs of how BitMEX Spot works. While for others it’s about brushing up on their knowledge base before executing that first trade. Either way, we’ve created this step-by-step guide to trading on our crypto spot exchange.
How to Spot Trade Crypto on BitMEX Spot
In three quick steps, you’ll be ready to start crypto spot trading on BitMEX.
1. Log in to BitMEX
You’ll need to sign in to trade on BitMEX Spot. If you haven’t yet created a BitMEX account, click here to sign up.
2. Go to Our Crypto Spot Trading Page
You’ll find our spot exchange here, or by clicking ‘Spot’ on our website’s Navbar and selecting ‘Trade’.
 3. Navigate the BitMEX Spot Trading Interface
Our crypto spot exchange interface is divided up into four main sections. Let’s take a look at each of them:
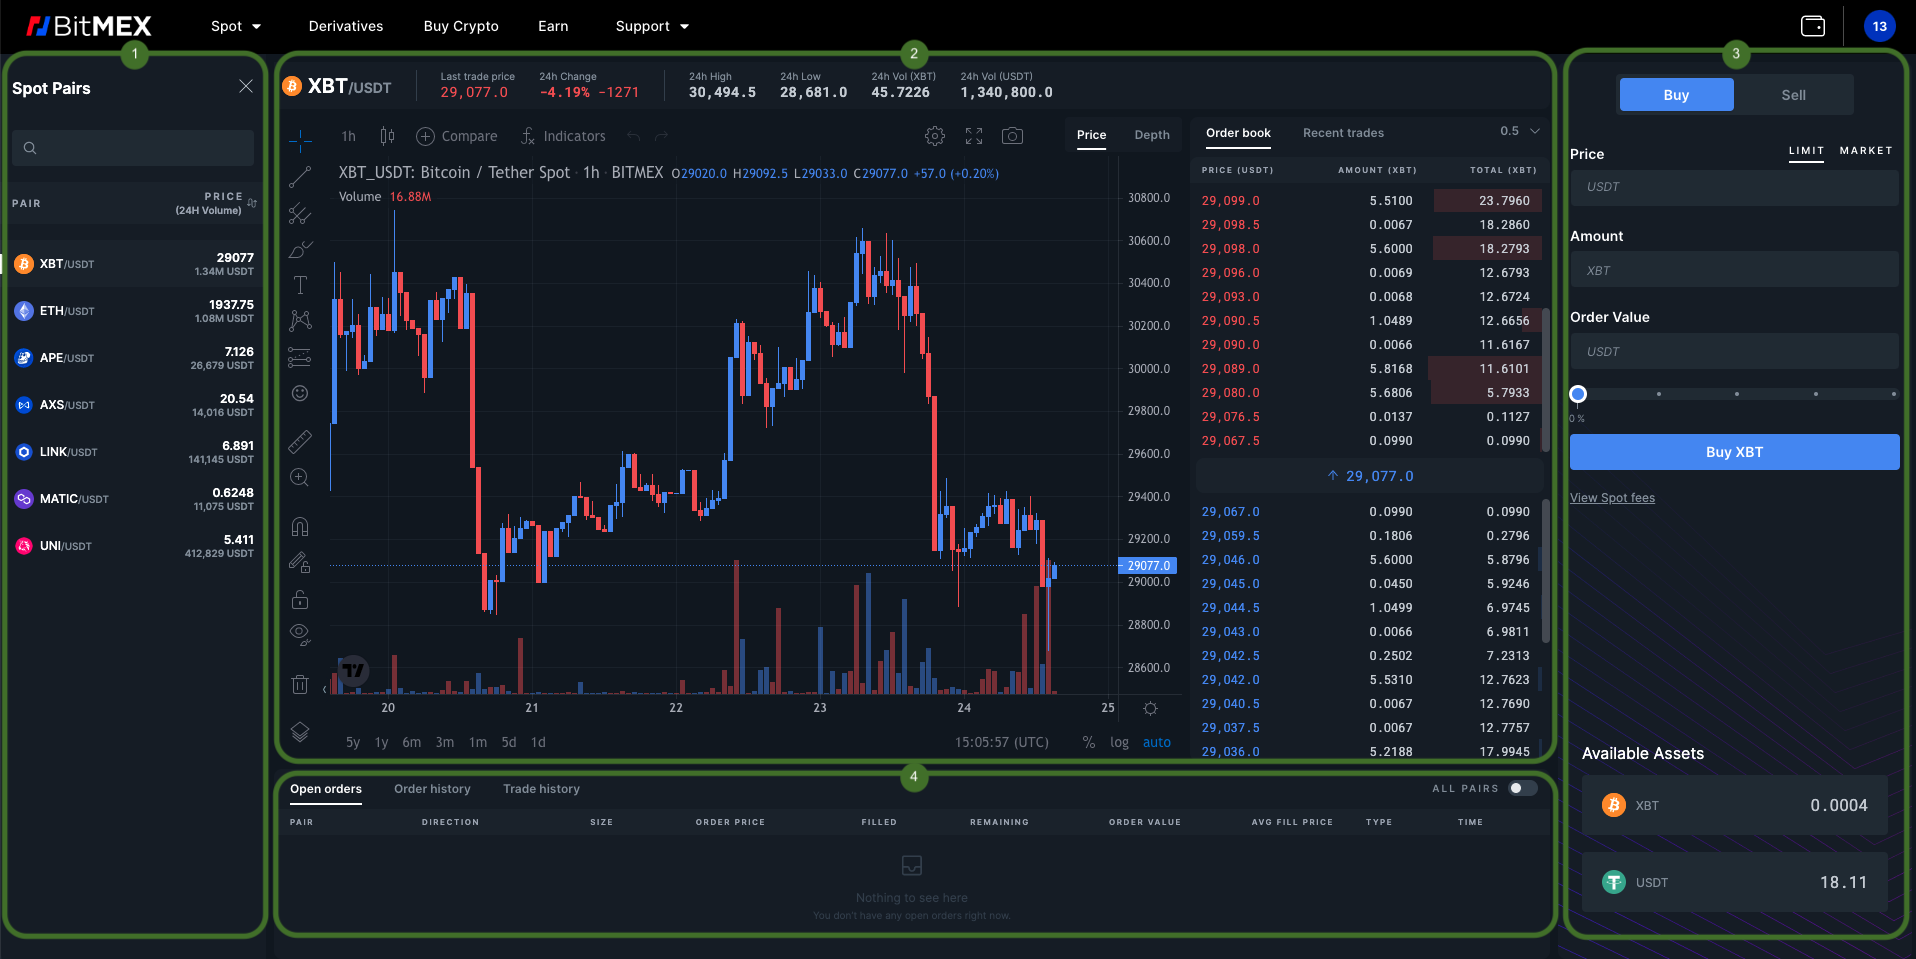 1) Spot Pairs
This section shows the crypto spot trading pairs that are currently supported on our exchange: XBT/USDT, ETH/USDT, APE/USDT, UNI/USDT, MATIC/USDT, LINK/USDT, and AXS/USDT.
You can view the ‘Spot Pairs’ section by clicking the menu icon on the top left-hand side of our spot exchange interface – displayed as ‘≡’. To hide this section, simply click on the ‘✕’ button on the top-right corner of the ‘Spot Pairs’ window.
You can also click on, or search for, a specific crypto trading pair – e.g. ETH/USDT – to display that particular pair’s price chart, order book, and recent trades.
What is Spot Trading?
In the crypto space, spot trading refers to the buying and selling of tokens and coins at the current market rate (or the ‘spot price’) – with the intention of taking delivery of the underlying asset immediately. Spot trading is different to derivatives trading, as you need to own the underlying asset to place a buy or sell order.
What Are Crypto Spot Trading Pairs?
The term “trading pair” describes the asset pair being traded. There are two main types of trading pairs: fiat-to-crypto pairs (e.g. XBT/USD) and crypto-to-crypto pairs (e.g. MATIC/USDT).
Trading pairs are valued in terms of their “base pair” – the currency against which an exchange rate is quoted. In the ETH/USDT trading pair – which references the price of ETH in terms of USDT – the base currency would be ETH, and the quote currency would be USDT.
2) The TradingView Window, Order Book, and Depth Chart
Traders use the TradingView chart, order book, and depth chart to conduct technical analysis, determine liquidity, and select prices for their orders.
Let’s first take a look at the TradingView chart’s main features, settings, and tools:
Candlestick Chart
The TradingView window offers a number of chart display options, including candlesticks, bars, hollow candles, heikin ashi, line, area, and baseline. For the purpose of this article, we’ll focus on our default chart display setting: candlesticks.
At a glance, each candle displays what happened to the price of a crypto asset at a particular period of time. If you click on ‘1h’ above the price chart, you’ll have the ability to adjust the time period displayed by the candle.
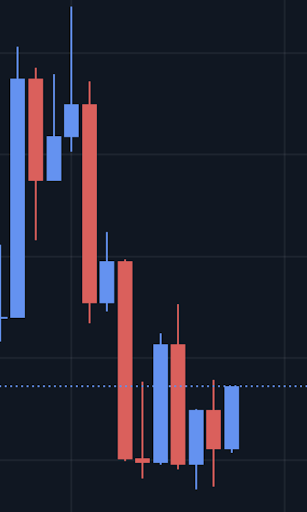
Let’s take a closer look at the anatomy of a candle. In the screenshot above, you’ll see a long line going through the ‘body’ of the candle – this is called the wick. Each candle shows four pieces of information: the high, open, low, and close.
- The ‘high’ is the highest price that was reached during a particular time frame.
- The ‘open’ is the price of an asset at the very start of a particular time frame.
- The ‘low’ is the lowest price that was reached during a particular time frame.
- The ‘close’ is the price of a crypto asset at the very end of a particular time frame – after which, a new candle begins.
The ‘wick’ displays the ‘high’ and the ‘low’, and the coloured part of the candle – a.k.a the body – displays the ‘open’ and the ‘close’.
If the price ended up higher at the ‘close’ than when it opened, then the candle is displayed in the colour blue to show that the price went up. In contrast, if the price ended up lower at the ‘close’ than when it opened, the candle will be displayed in the colour red to show that the price dropped.
24-Hour Trading Volume
At the top of the TradingView window and order book, you’ll see:
- The crypto pair you selected – e.g. XBT/USDT.
- The base cryptocurrency’s last trade price (e.g. XBT) against the quoted cryptocurrency (E.g. USDT).
- Under ‘24h Change’, you’ll see the change in the price of a particular crypto asset over the last 24 hours.
- The highest and lowest price a particular cryptocurrency has reached over the last 24 hours.
- The total volume of both the base and quoted cryptocurrency traded over the last 24 hours.
Customise Your TradingView Window
Here’s a non-exhaustive list of the tools traders can use on our crypto spot exchange to predict, analyse, and track price movements:
- Our crypto spot exchange lets you add and favourite your own indicators; simply click on the ‘fx’ icon to access our indicator feature. Certain indicators give clear buy and sell signals, while others need to be interpreted based on your specific trading strategy.
- The brush tool can be accessed via the paintbrush icon, and is used as a way to draw freely or annotate on the chart.
- The trend line tool – which you can access by clicking on the line icon – lets traders draw lines manually in order to illustrate trends in the market or associated indicators. It can also be displayed as an arrow.
- Click the ruler icon, or hold shift + click, to activate the ruler tool, which lets you measure time, distance, and prices on your crypto price chart.
- You can expand the window you’re looking at by going to fullscreen mode. To exit full screen mode, press ‘esc’ on your keyboard.
The Order Book
To the right of the TradingView window, you’ll find the order book (a.k.a depth of market). The order book displays a real-time list of open buy and sell orders for a selected crypto asset. For example, let’s say the current price is 5 USDT for 1 UNI – the order book will show how many orders there are at 4.8 USDT, 5.2 USDT, etc.
The order book consists of two sides: the ‘buy-side’ and ‘sell-side’:
- The buy-side shows all open buy orders below the last traded price (displayed in the middle). Offers from buyers are known as ‘bids’. You’ll see a list of open buy orders in the bottom half of the order book.
- The sell-side shows all open sell orders above the last traded price. The price is known as the ‘ask’. You’ll see a list of open orders for a particular cryptocurrency in the top half of the order book.
What is an Open Order?
An open order is an unfilled order that has yet to be executed.
Market Depth Chart
For a visual presentation of the order book, select ‘Depth’ next to ‘Price’ on the TradingView window. The more open limit orders there are on both sides of the order book, the more depth that book has.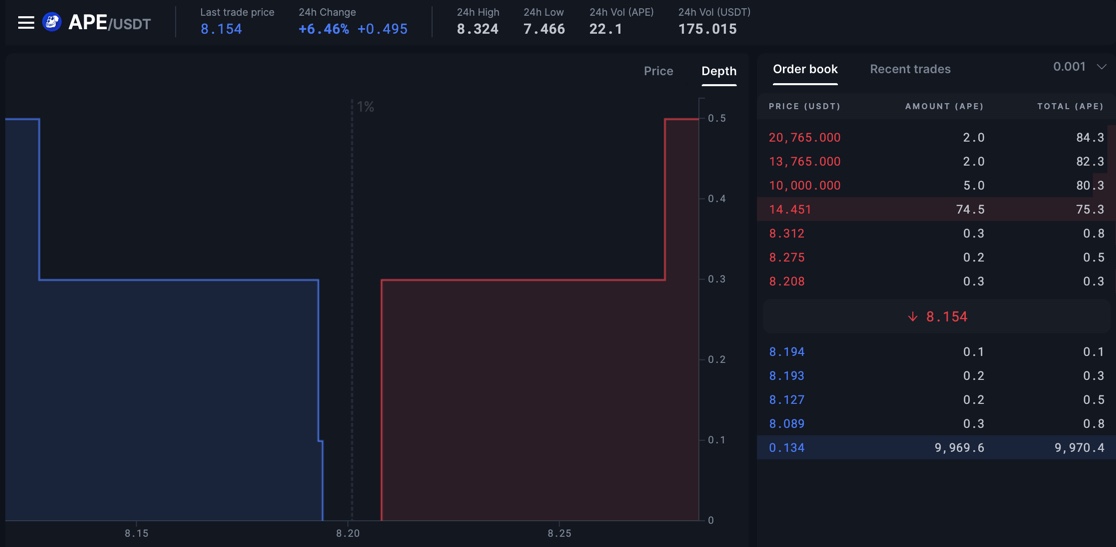 3) Buy and Sell Crypto
The window to the right of the order book lets you trade crypto by creating market and limit orders:
- Limit order: This order type lets users prepare spot trades in advance. Placing a limit order allows traders to set their own price to buy or sell crypto. If the market reaches the limit price, the trader’s order will be executed.
Example: If the current market price for 1 Bitcoin is 30,050 USDT, and you want to buy 10 Bitcoin when the price drops to 30,000 USDT, you can place a limit order.
Instructions: Select ‘LIMIT’, enter 30,000 in the ‘Price’ field, and enter 10 in the ‘Amount’ field. Click the ‘BUY XBT’ button to place the limit order. - Market order: A market order is an order that is executed immediately at current market prices. Traders use this order type when they want to complete their order as quickly as possible. Traders who create market orders will not need to enter in a price.
Example: If 1 Bitcoin costs 30,050 USDT, and you wish to buy 1 Bitcoin immediately, you can place a market order.Instructions: Select ‘MARKET’, enter 1 in the ‘Amount’ field, review the approximated USDT amount presented in the ‘Order Value’ field, and then click ‘Buy XBT’ to place your market order.
Note: The percentage shown on the slider is the amount based on your available asset used for this order. For example, when buying Bitcoin, you can adjust the percentage slider to indicate the amount of USDT held in your account that you wish to trade for XBT.
You’ll see your available assets for a particular crypto spot trading pair underneath the buy/sell window. To view and calculate your spot trading fees, click here.
4) Trading History and Open Orders
Below the TradingView window, you’ll see information on all/selected spot trading pair’s open orders, order history, and trade history:
What Does Order History Mean?
The order history section helps traders keep track of their order placements in a given time period.
What Does the ‘Trade History’ Tab Show?
Users can click the ‘Trade history’ tab to view their trade history for each order (provided it’s been filled). Trade history refers to trades that have actually been executed (i.e. orders that have been filled), whereas order history shows a record of all orders placed – including new, partially filled, filled, cancelled, and rejected orders.
Coming Soon: More Crypto Spot Trading Pairs
Over the coming months, users will have access to a wider selection of spot trading pairs – including BMEX/USDT. What’s more, our mobile app will soon allow users to easily trade on-the-go with a simple, smooth, and intuitive interface.
BMEX rewards also await new and existing traders. Note: Our BMEX offers are always changing in accordance with our current projects and initiatives. For the latest, visit our token promotions page.
To be the first to know about our product launches, spot trading pairs, and giveaways, connect with us on Discord, Telegram, and Twitter.
If you have any questions in the meantime, please contact Support.
Related
The post appeared first on Blog BitMex


