With a reported loss of 3.71 percent over the past 24-hours, EOS continued to struggle on the charts, with the crypto now well outside the top-10 of the market’s rankings. While EOS’s price has remained volatile for quite a while, the prevailing market trend has been bearish too. In fact, at the time of writing, EOS was trading at a price that was 53 percent below its yearly-high, and a whopping 70 percent under its June 2019 high.
The near-future did not suggest a sense of optimism for EOS either, with chances of further corrections prominent on the chart.
EOS 1-day chart


Source: EOS/USD on TradingView
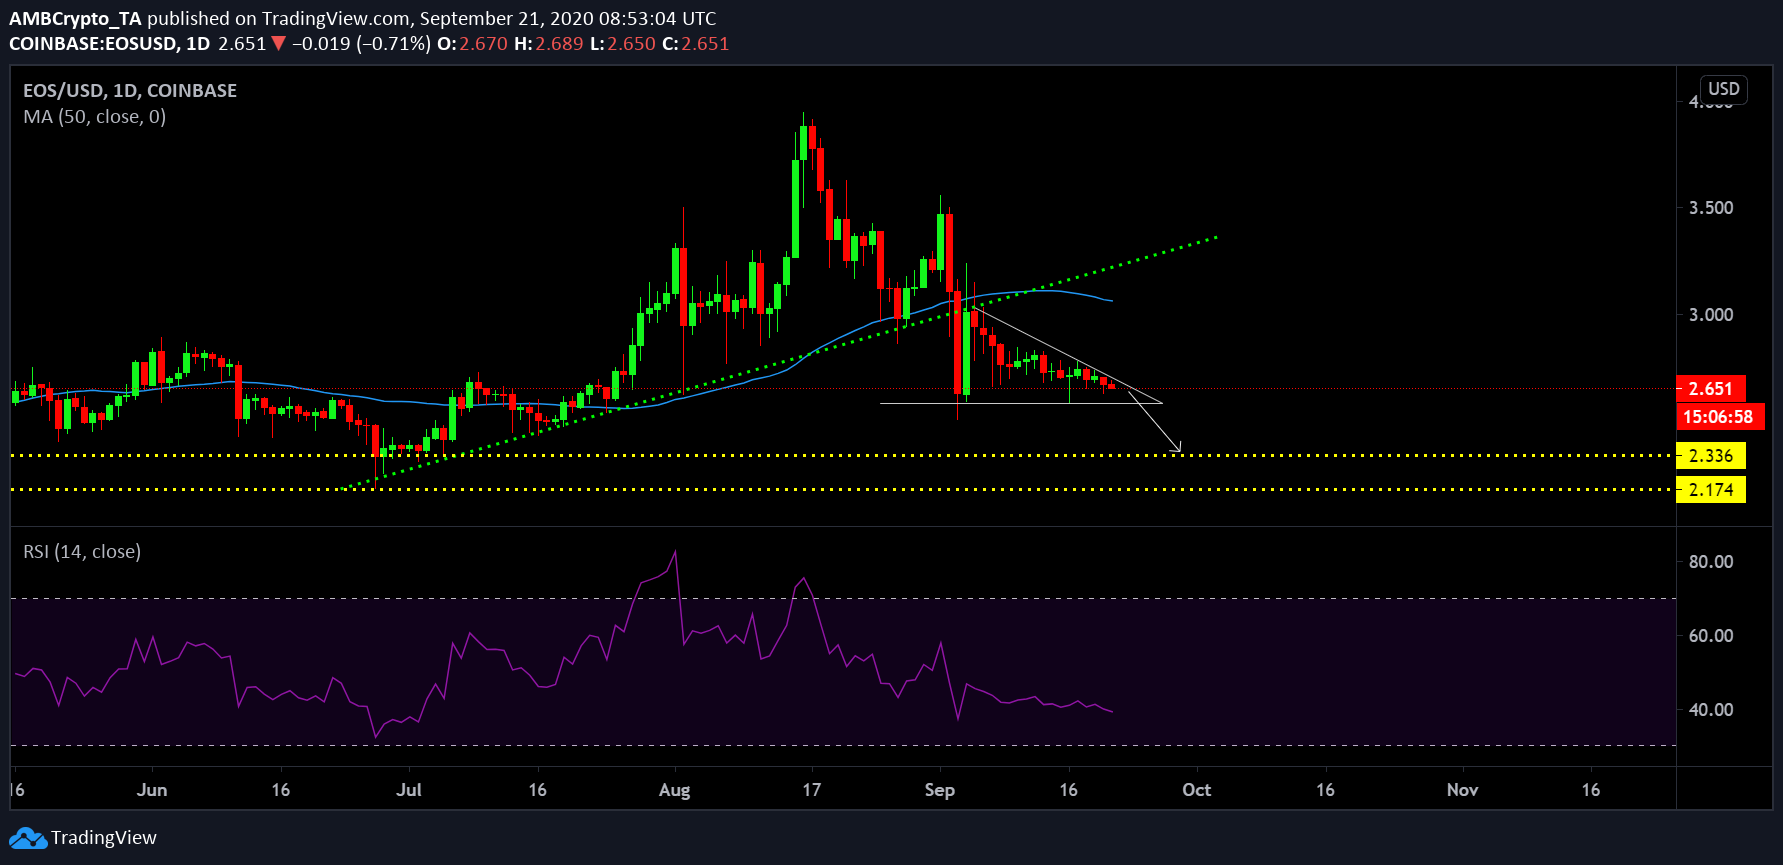
While the collective altcoin market registered a severe crash over 2-3rd September, EOS surprisingly surged on the 4th, recouping close to 40 percent of its lost valuation. However, it hasn’t been that profitable since as the crypto-asset has consistently lost value since the 4th. In fact, the downtrend on EOS’s chart has been key in its inability to recover since the 4th, with the same detrimental to its recent efforts too.
While the trend has been bearish altogether, at the time of writing, EOS was facilitating the formation of a descending triangle. If another pullback occurs from here on, EOS will test its support from July 1st week at $2.336. With the Relative Strength Index or RSI stabilizing under selling pressure, a major sell-off may be on the cards for the token.
EOS Weekly Chart
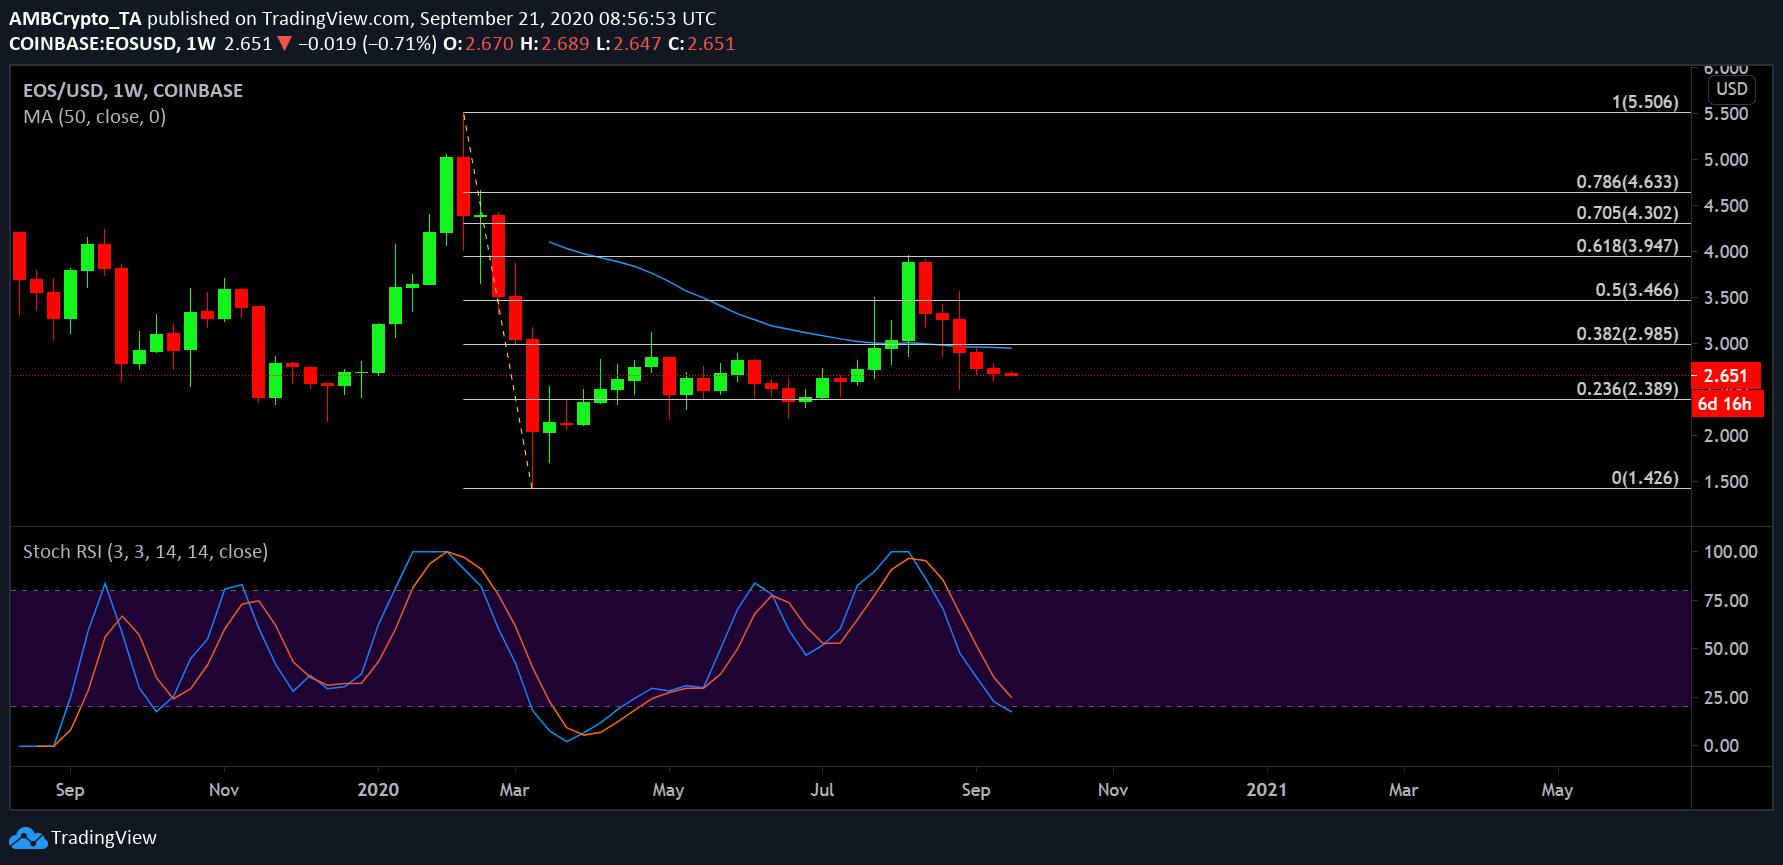
From a weekly point of view, EOS has regularly tested different supports over the past few weeks. According to the Fibonacci retracement lines, the first support at $3.44 was breached during the middle of August, and since then, the support at $2.98 has given way as well. With the 50-moving average strongly attesting the overhead resistance at press time, a re-test of $2.38 is highly likely.
The Stochastic RSI suggested that EOS was on a bearish rally, with chances of a reversal likely ahead. It also means that the bottom might be close for EOS as a turnaround might take place after the support at $2.38 is met. Any move below $2.38 will be catastrophic for the token.
The post appeared first on AMBCrypto


