Bitcoin was trading at $12,960 at press time, with Bitcoin’s market dominance holding at 61.8%, a figure that has slowly risen over the past few weeks. Ethereum shared this bullish sentiment as it conquered a strong region of resistance. However, many altcoins were unable to keep up, suggesting that traders had pulled funds from stagnant altcoins to funnel into Bitcoin, Ethereum, and other assets with bullish momentum.
Ethereum [ETH]


Source: ETH/USD on TradingView
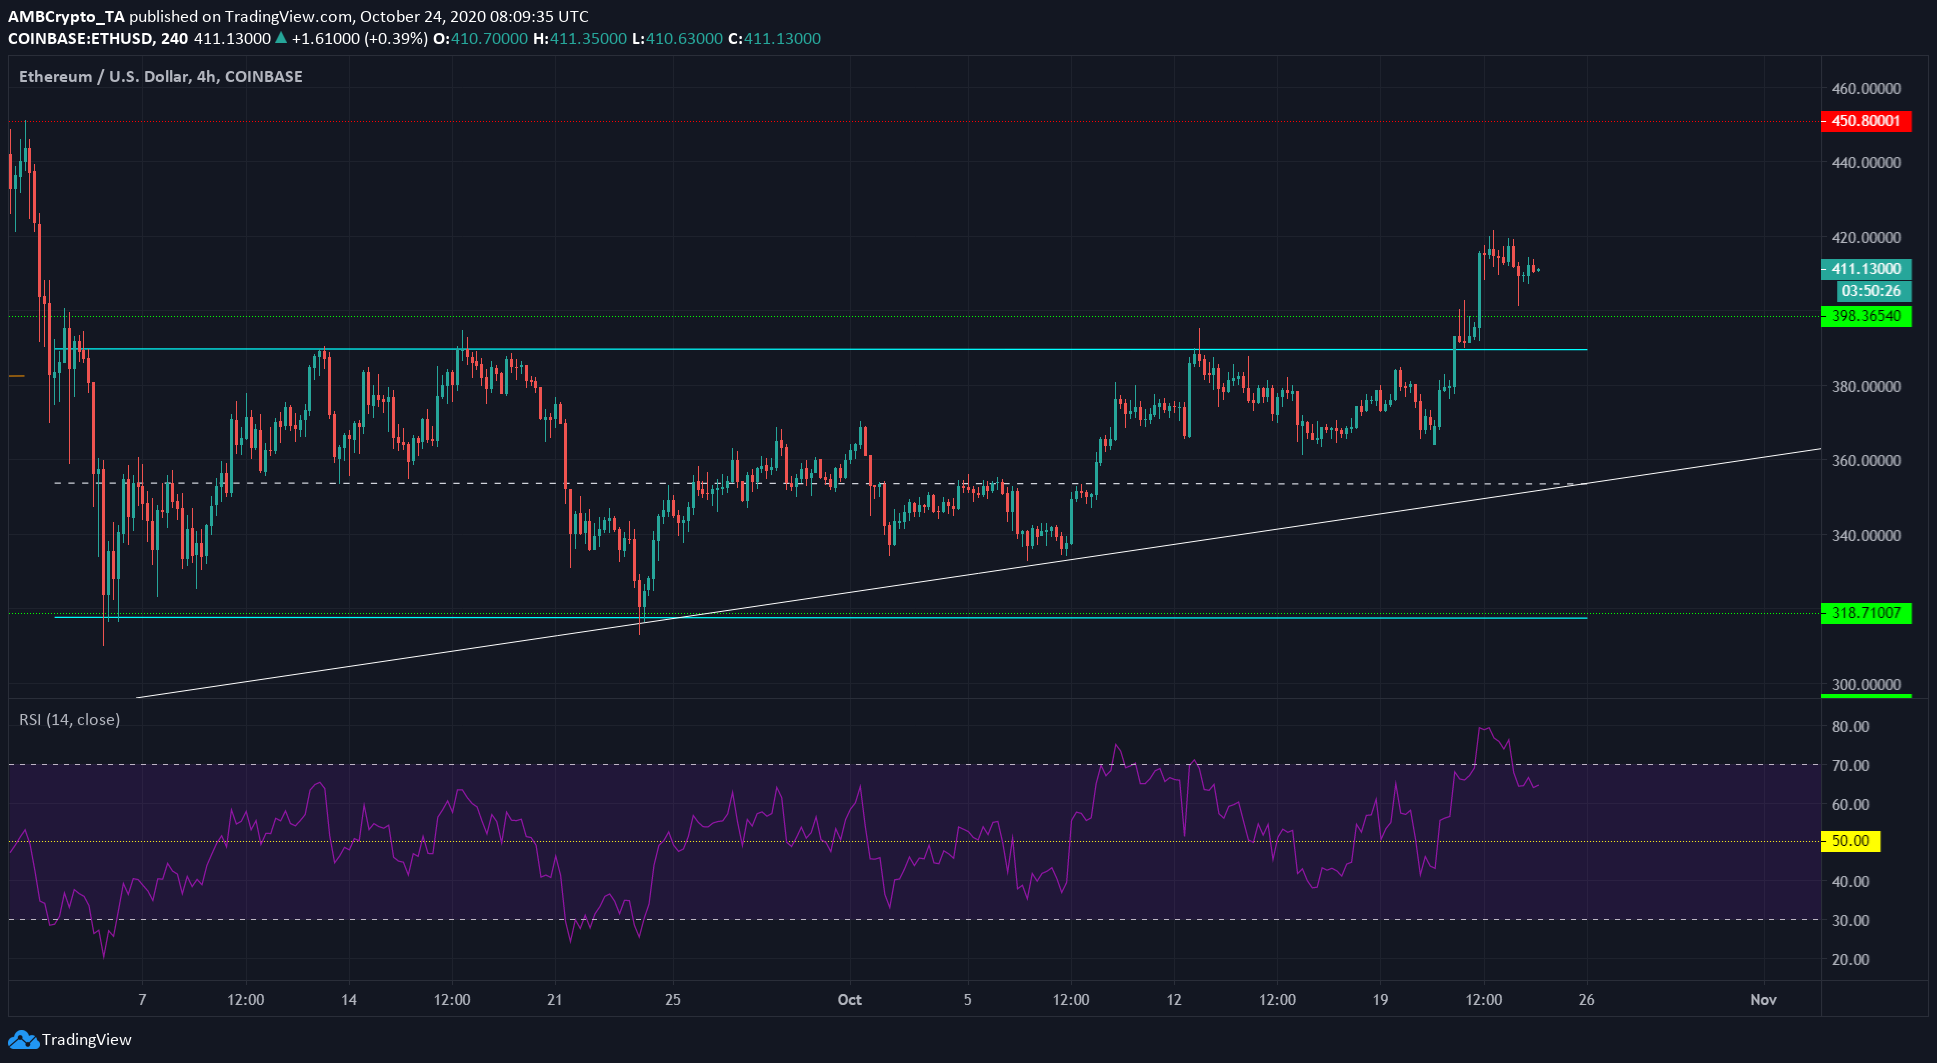
Ethereum broke out of a rectangular pattern (cyan) and was moving above the trendline (white), stretching back to March’s Black Thursday.
The move past the $400-level was particularly momentous because the region from $385 to $400 has served as an important region over the past few months as well. In late-August, ETH moved down to retest the same level before spiking to $487, and it could be set to move in a similar fashion once more.
The RSI highlighted bullish momentum for the crypto-asset with a reading of 65. Ethereum noted a level of resistance at $450. The bullish sentiment around Bitcoin, combined with ETH conquering $400, could be a catalyst for further gains once more.
In other news, iFinex announced an integration with pNetwork to enable automatic tokenization ETH (pETH) to facilitate the direct movement of the asset from the Bitfinex platform onto DeFi blockchains.
Basic Attention Token [BAT]


Source: BAT/USD on TradingView
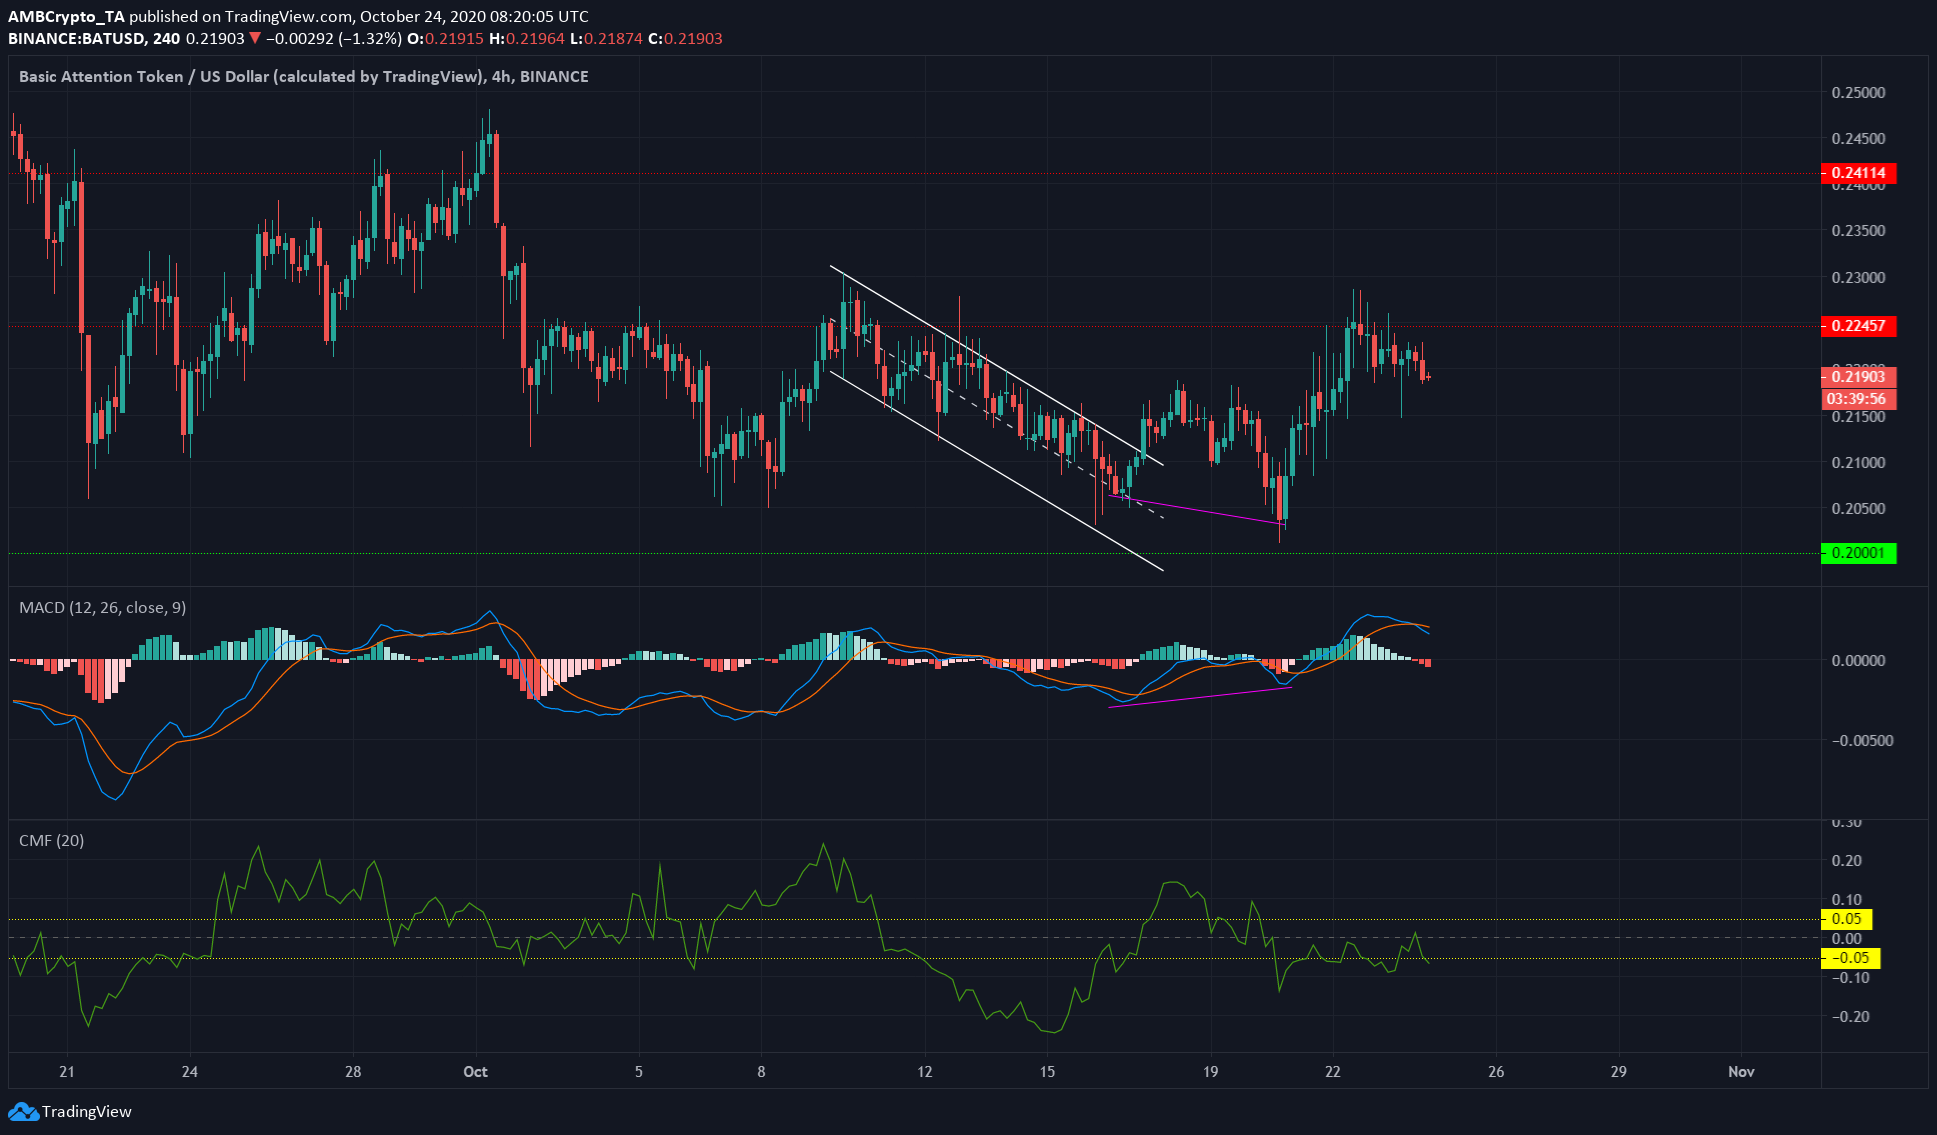
Basic Attention Token was moving within a descending channel (white). It appeared to break out, but failed and was forced lower. Around the $0.202-mark, the cryptocurrency noted a bullish divergence against the momentum indicator (MACD) and rose to test the resistance at $0.224.
BAT faced rejection at that level, in accordance with the long-term bearish trend BAT has noted for the past month.
Finally, the Chaikin Money Flow has highlighted a somewhat neutral market over the past few days, with neither the bulls nor the bears able to impose themselves on the capital flows into or out of the market. This could be set to change, as, at the time of writing, the CMF had dipped beneath -0.05.
DigiByte [DGB]


Source: DGB/USD on TradingView
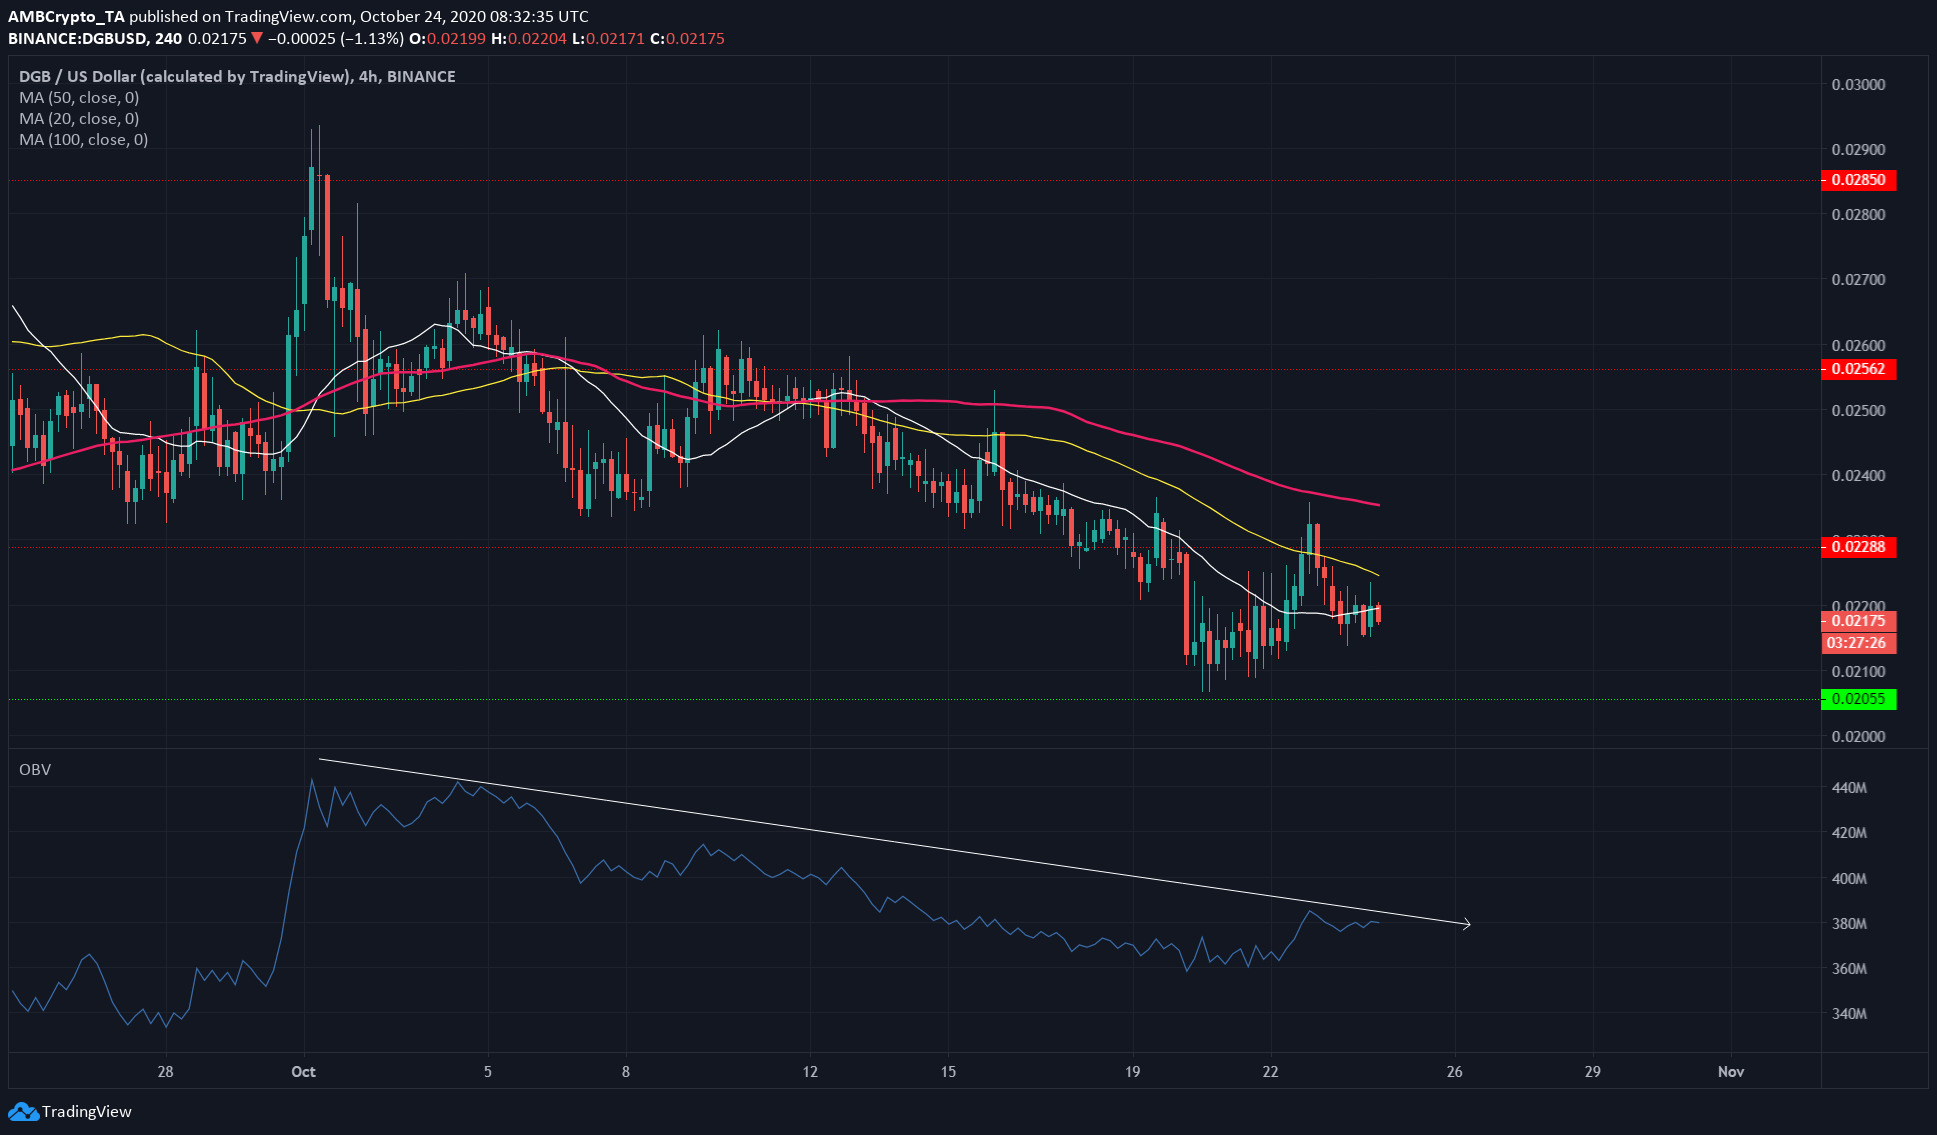
The moving averages painted a bearish picture for DGB. The 100 SMA (pink) moved above the 50 SMA (yellow), in turn moving above the 20 SMA (white) and highlighting that bearish momentum had existed in both the short and medium-term.
The OBV also confirmed that the buying volume was falling (white) on the charts.
In conclusion, DGB might be set to test or even break beneath the support level at $0.02.
The post appeared first on AMBCrypto


