With the cryptocurrency recently recording its high for 2020, Monero could be at the beginning of a long-awaited bull market. NANO too was registering strong buying momentum, with the digital asset’s charts noting a bullish rectangle pattern.
Finally, Ethereum Classic also continued to record appreciable gains on its charts, rising significantly above a crucial support level over the previous week.
Ethereum Classic [ETC]


Source: ETC/USD on TradingView
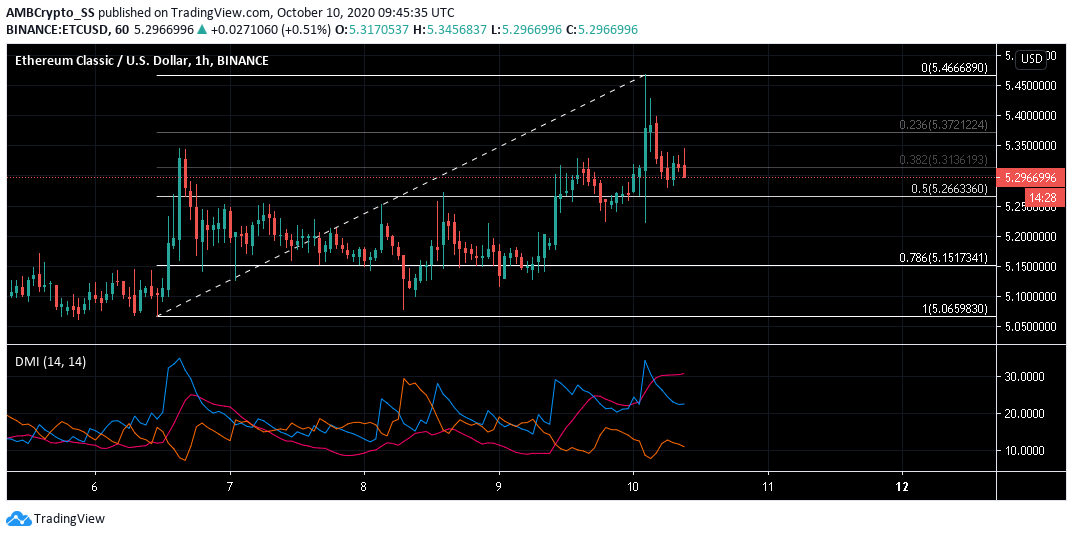
The digital asset was in a short-term uptrend, with ETC displaying signs of bullishness. At press time, ETC was trading at a value of $5.296. In fact, Ethereum Classic, over the last 24 hours, had moved above the 50% retracement zone and the $5.26-support, levels marked by the Fibonacci retracement tool.
Further, the Directional Movement Index with a rising ADX and +DMI (blue) above the -DMI (orange) pointed to the strengthening of an upward price trend.
If buyers were to continue to reaffirm their bullish posture, the price in the coming days may even reach the 23.65% retracement zone.
Monero [XMR]


Source: XMR/USD on TradingView
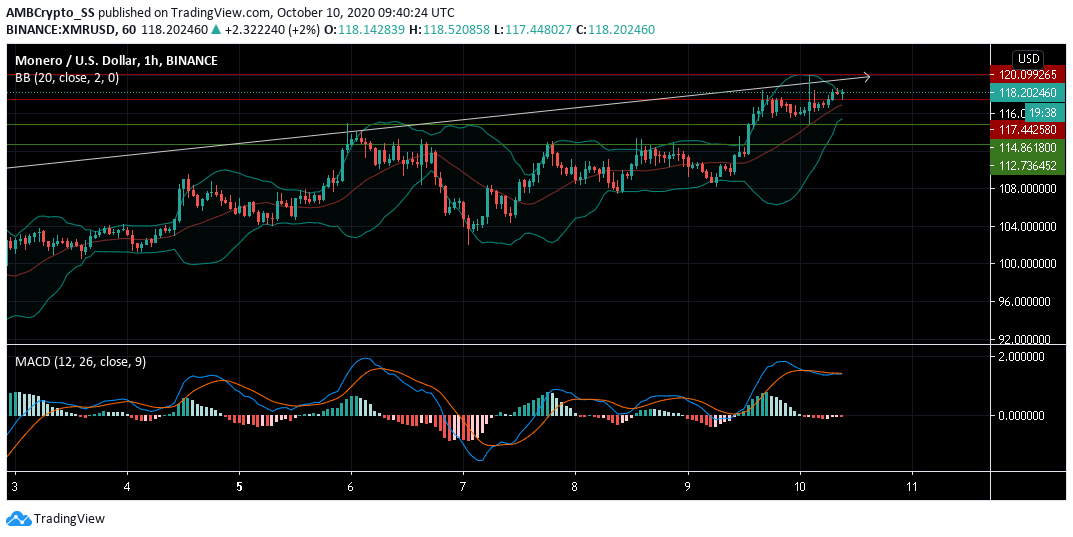
The privacy coin Monero, at press time, was trading at $118.202. XMR breached its resistance of $120 for the first time since June 2019, with the market bulls once again demonstrating positive strength in this region.
However, a brief price consolidation in the short-term period is also a likely scenario. The same was evidenced by the convoluted MACD and Signal lines as they remained neutral. Further, the reduced volatility from the convergence of the Bollinger bands may support more price consolidation.
Monero was in the news after it was announced that it had recently released rolled out the Ledger Nano App update version (1.7.3). The same would be compatible with the latest GUI and CLI clients (0.17.0.1 – Oxygen Orion).
NANO


Source: NANO/USD on TradingView
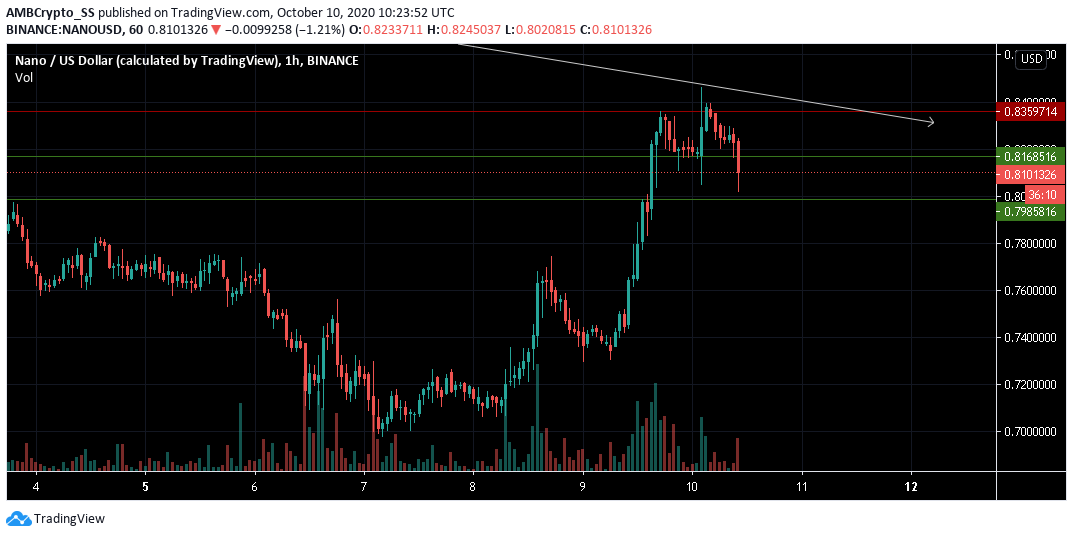
NANO could be in for another bullish formation, following an impressive bounce from the $0.798-level of support over the last 24-hours.
In fact, the digital asset since yesterday has risen by 6.5% in light of some recovery seen across the cryptocurrency market. Nano was also seen making a Bullish rectangle continuation pattern.
It ranged between the support and resistance levels of $0.816 and $0.835. Volumes that generally dive during rectangle patterns, but increase after a breakout also confirmed this scenario.
The low levels of volumes are likely to surge coinciding with a bullish breakout.
The post appeared first on AMBCrypto


