Over the last few months, it would seem that much of the altcoin market has been driven by its own momentum and the organic developments in its own ecosystem. This is a good thing as such movement has given credence to those who believe that one day, these alts may, to a great extent, move independently of Bitcoin, the world’s largest cryptocurrency. However, this goes both ways as well, which is why while BTC was consolidating its position at press time, cryptos like Ethereum Classic and VeChain were falling. Chainlink, however, was an exception.
Chainlink [LINK]


Source: LINK/USD on TradingView
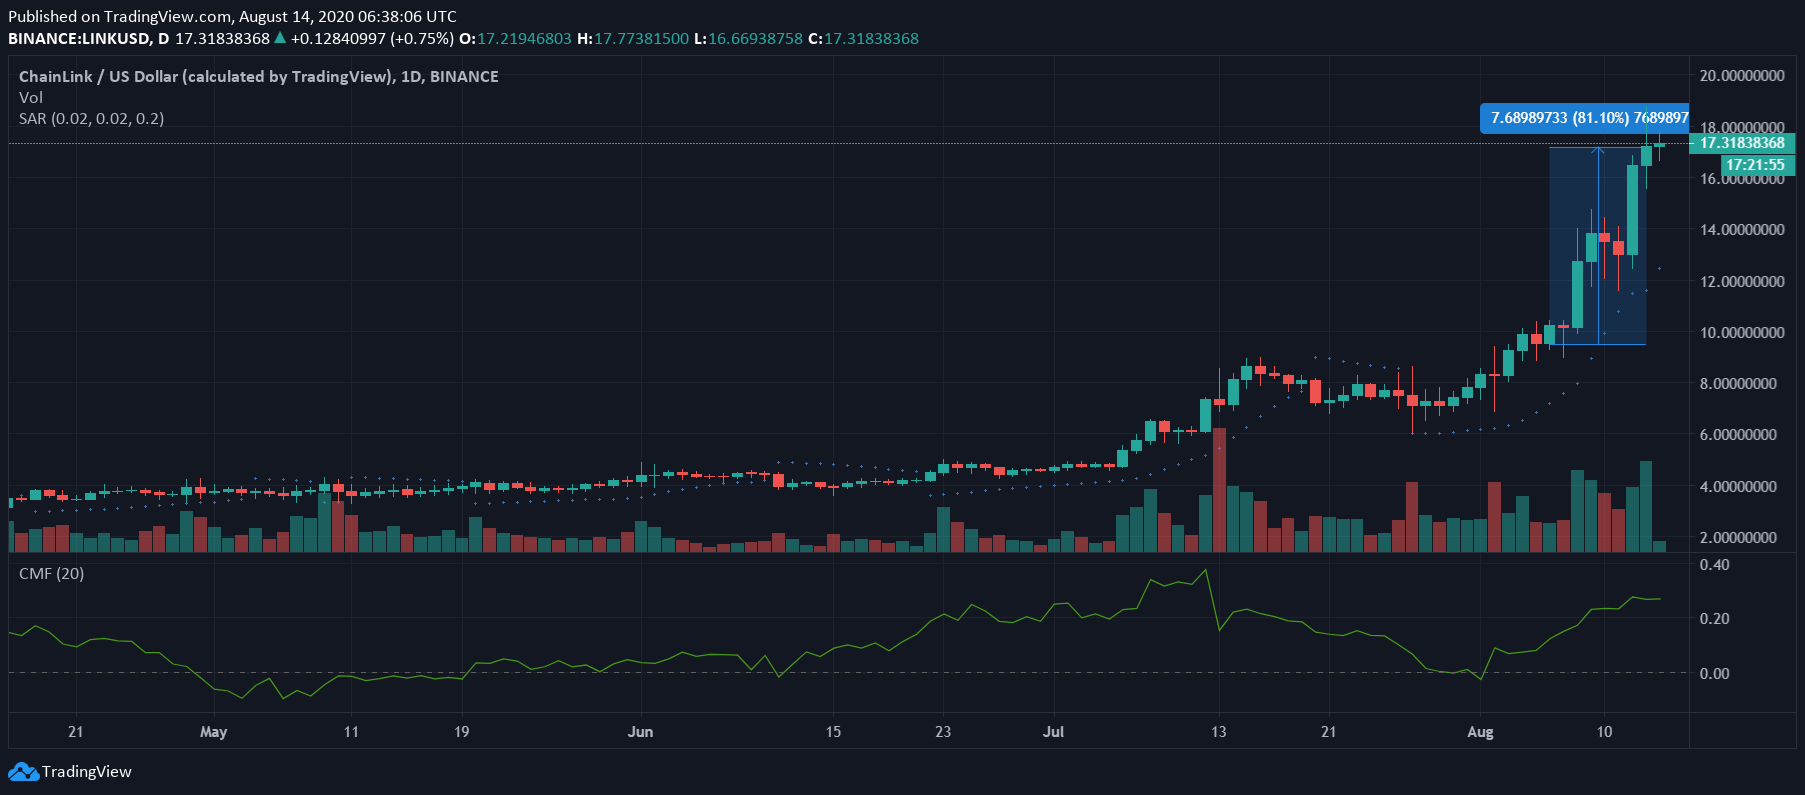
Chainlink, the cryptocurrency now ranked as high as 5th on CoinMarketCap’s ladder, has been the industry’s star performer over the last 6-8 months. However, it should be noted that LINK’s price performance really took flight only in the months of July and August, more so in the latter, with the same attributed to a host of factors including a massive short squeeze to the demand from yield farmers for YAM tokens.
In fact, over the last week alone, LINK has risen by over 80% on the charts, an astonishing hike for a crypto ranked so high on the cryptocurrency ladder. Its YTD gains were even more astonishing, with the figures recorded to be over 864%. In fact, at press time, its 24-hour volume was greater than XRP’s, a crypto ranked 3rd on the charts.
LINK’s technical indicators were evidence of the scale of LINK’s surge as while the Parabolic SAR’s dotted markers were well below the price candles, the Chaikin Money Flow was close to 0.30, a sign of healthy capital inflows.
However, everything may not be so rosy for the Chainlink market as according to Santiment, LINK’s long-term hodlers have begun taking out their profits, with the mean dollar invested age falling too.
Ethereum Classic [ETC]


Source: ETC/USD on TradingView
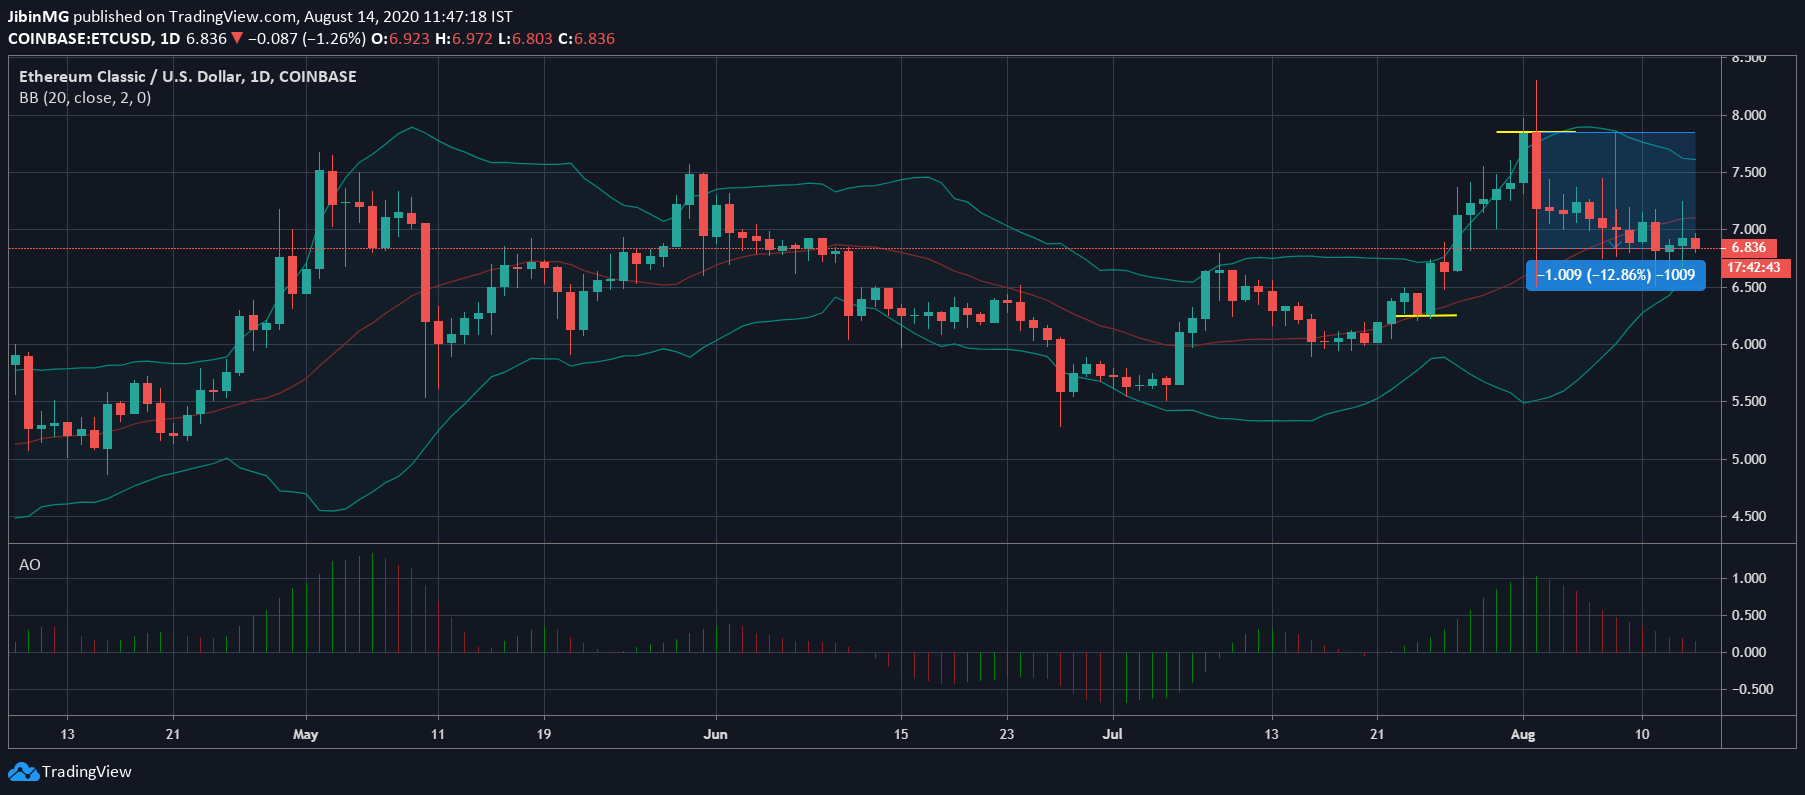
Ethereum Classic, the cryptocurrency ranked 26th on the charts at press time, hasn’t had a great August. Not only with respect to price performance, but on the development front as well. The network was in the news recently after it fell victim to a 51% attack; not once, but twice, over the course of just one week. These events have led to many questioning the security model inherent to Ethereum Classic.
These developments were reflected by ETC’s price charts, with the crypto down by 12% since hitting its local top towards the beginning of the month.
At the time of writing, the mouth of the Bollinger Bands was closing in, a sign of falling price volatility. Further, the Awesome Oscillator pictured a lack of momentum in the market.
Vechain [VET]


Source: VET/USD on TradingView
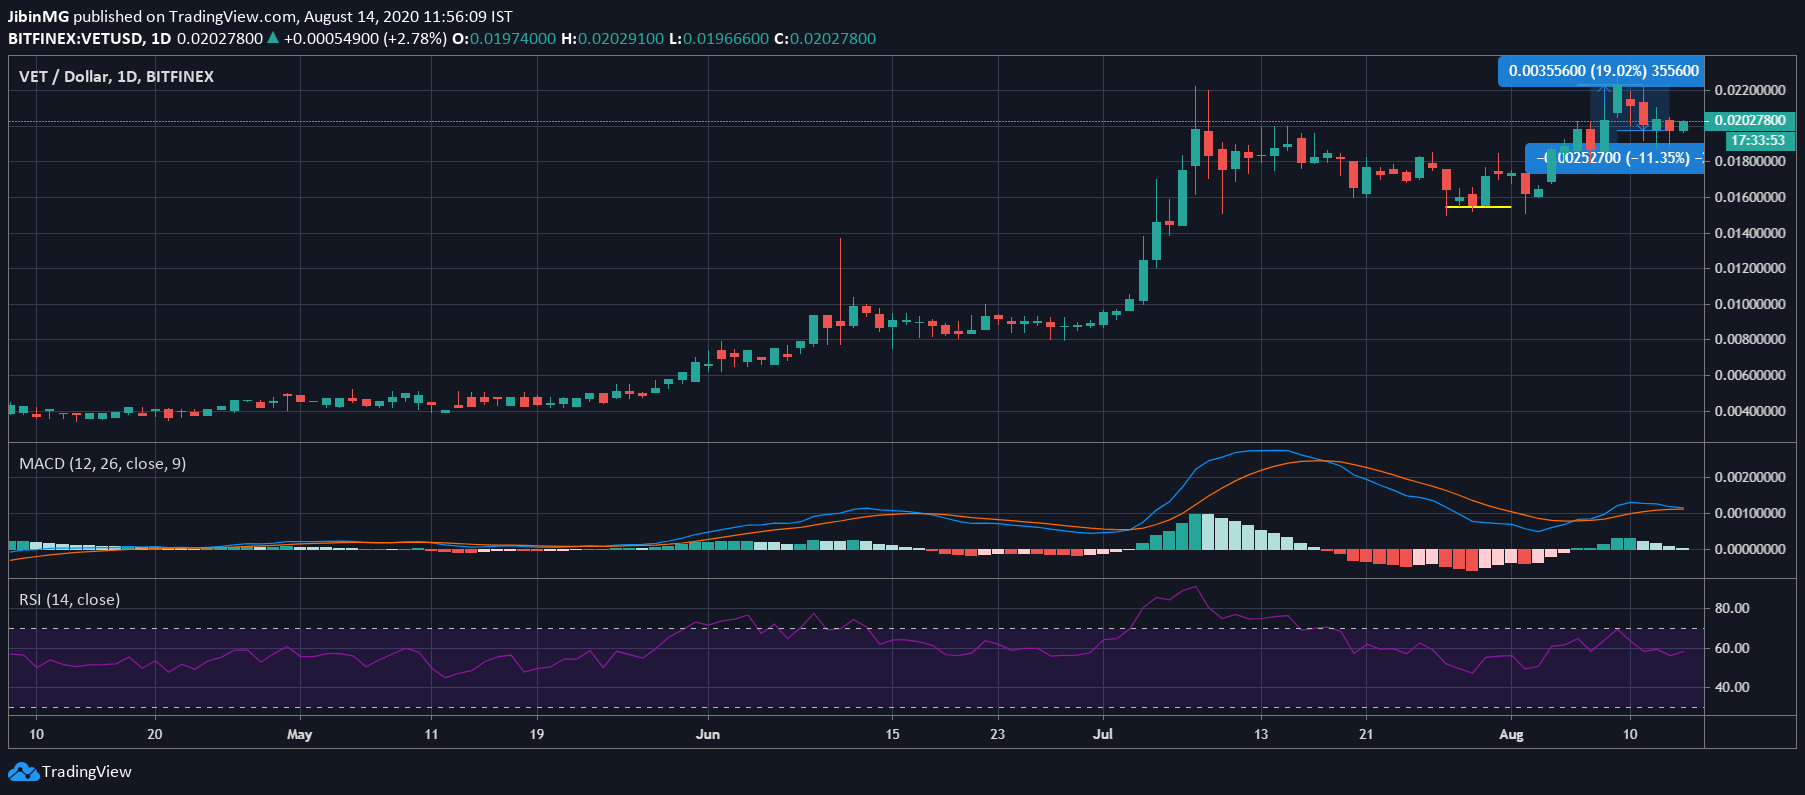
VeChain, now ranked 20th on CoinMarketCap’s charts, like Chainlink, has also performed well on the price charts over the course of July and August. However, contrary to LINK’s own movements, VET’s have been more inconsistent. In fact, at the time of writing, VET was down by over 11% after the crypto’s price climbed by 19% on the charts – all in a matter of a week. That being said, it was trading at its August 2018 levels – a 2 year high for the crypto.
VeChain’s technical indicators shared such inconsistency as while the MACD line was nearing a bearish crossover on the charts, the Relative Strength Index was healthy and right between the oversold and overbought zones.
On the development front, VeChain was in the news after it expanded its partnership with the University of Oxford to study blockchain protocols in a drive for more adoption.
The post appeared first on AMBCrypto


