There was some bullish sentiment toward the crypto markets as Bitcoin trended higher, alongside news of institutional interest. Ethereum faced a crucial level of resistance, while IOTA approached a level of resistance with strong momentum while BitTorrent formed a bearish pattern.
Ethereum [ETH]


Source: ETH/USD on TradingView
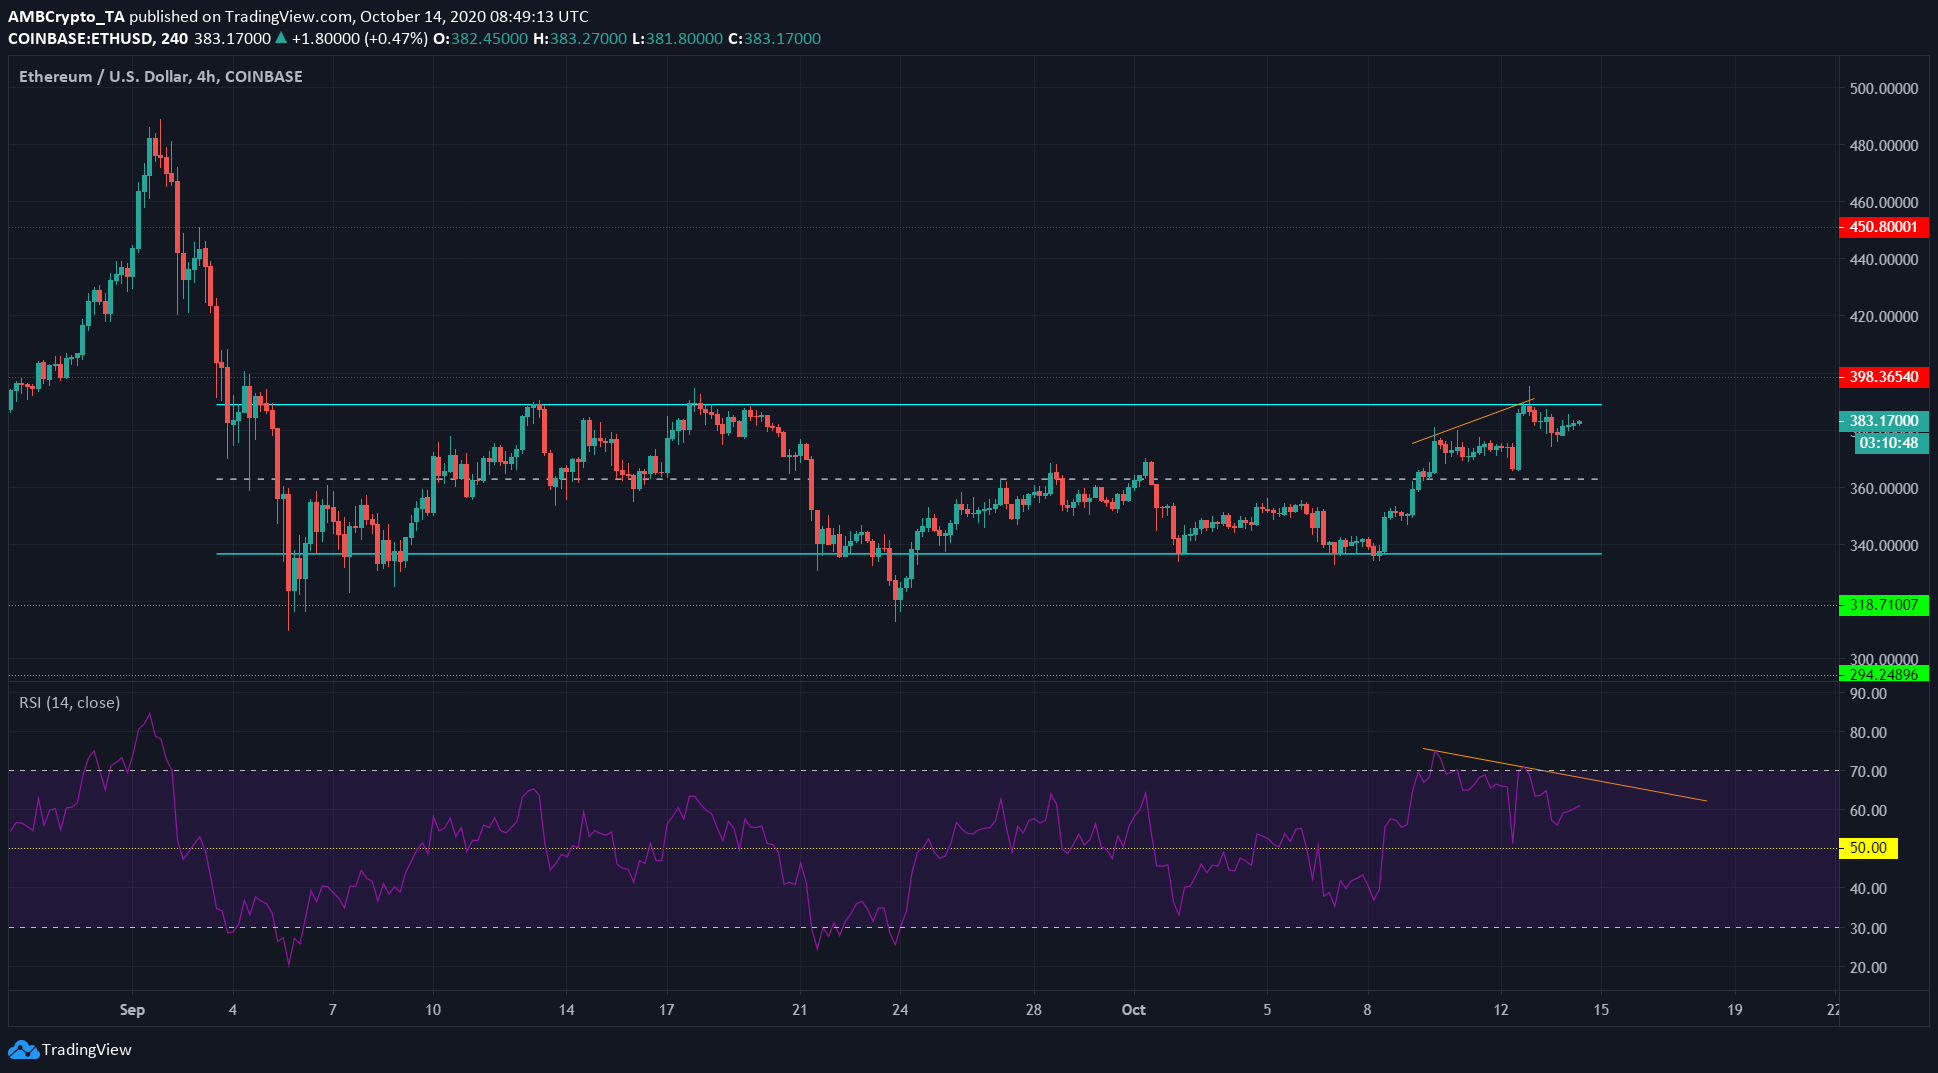
Ethereum was trading within a rectangle bottom (cyan). This is a pattern that sees an asset trade within a price range. Here, ETH has been bound between $335 and $388 for a little more than a month.
The region from $380 to $400 is also a region that ETH has traded extensively throughout August, and could act as a region of stiff resistance.
There was a bearish divergence seen, as ETH set new highs while the momentum indicator (RSI) made lower highs. It occurred in the overbought region, so it might not play out. The price would need to break past $388 with momentum, and the RSI to rise above the falling trendline (orange) for ETH to maintain bullish momentum.
If ETH was unable to climb higher, it could be headed south to $360. A climb above $400 could see $540 in the next few weeks.
In other news, Greyscale Ethereum Trust became an SEC reporting company.
IOTA


Source: IOTA/USD on TradingView
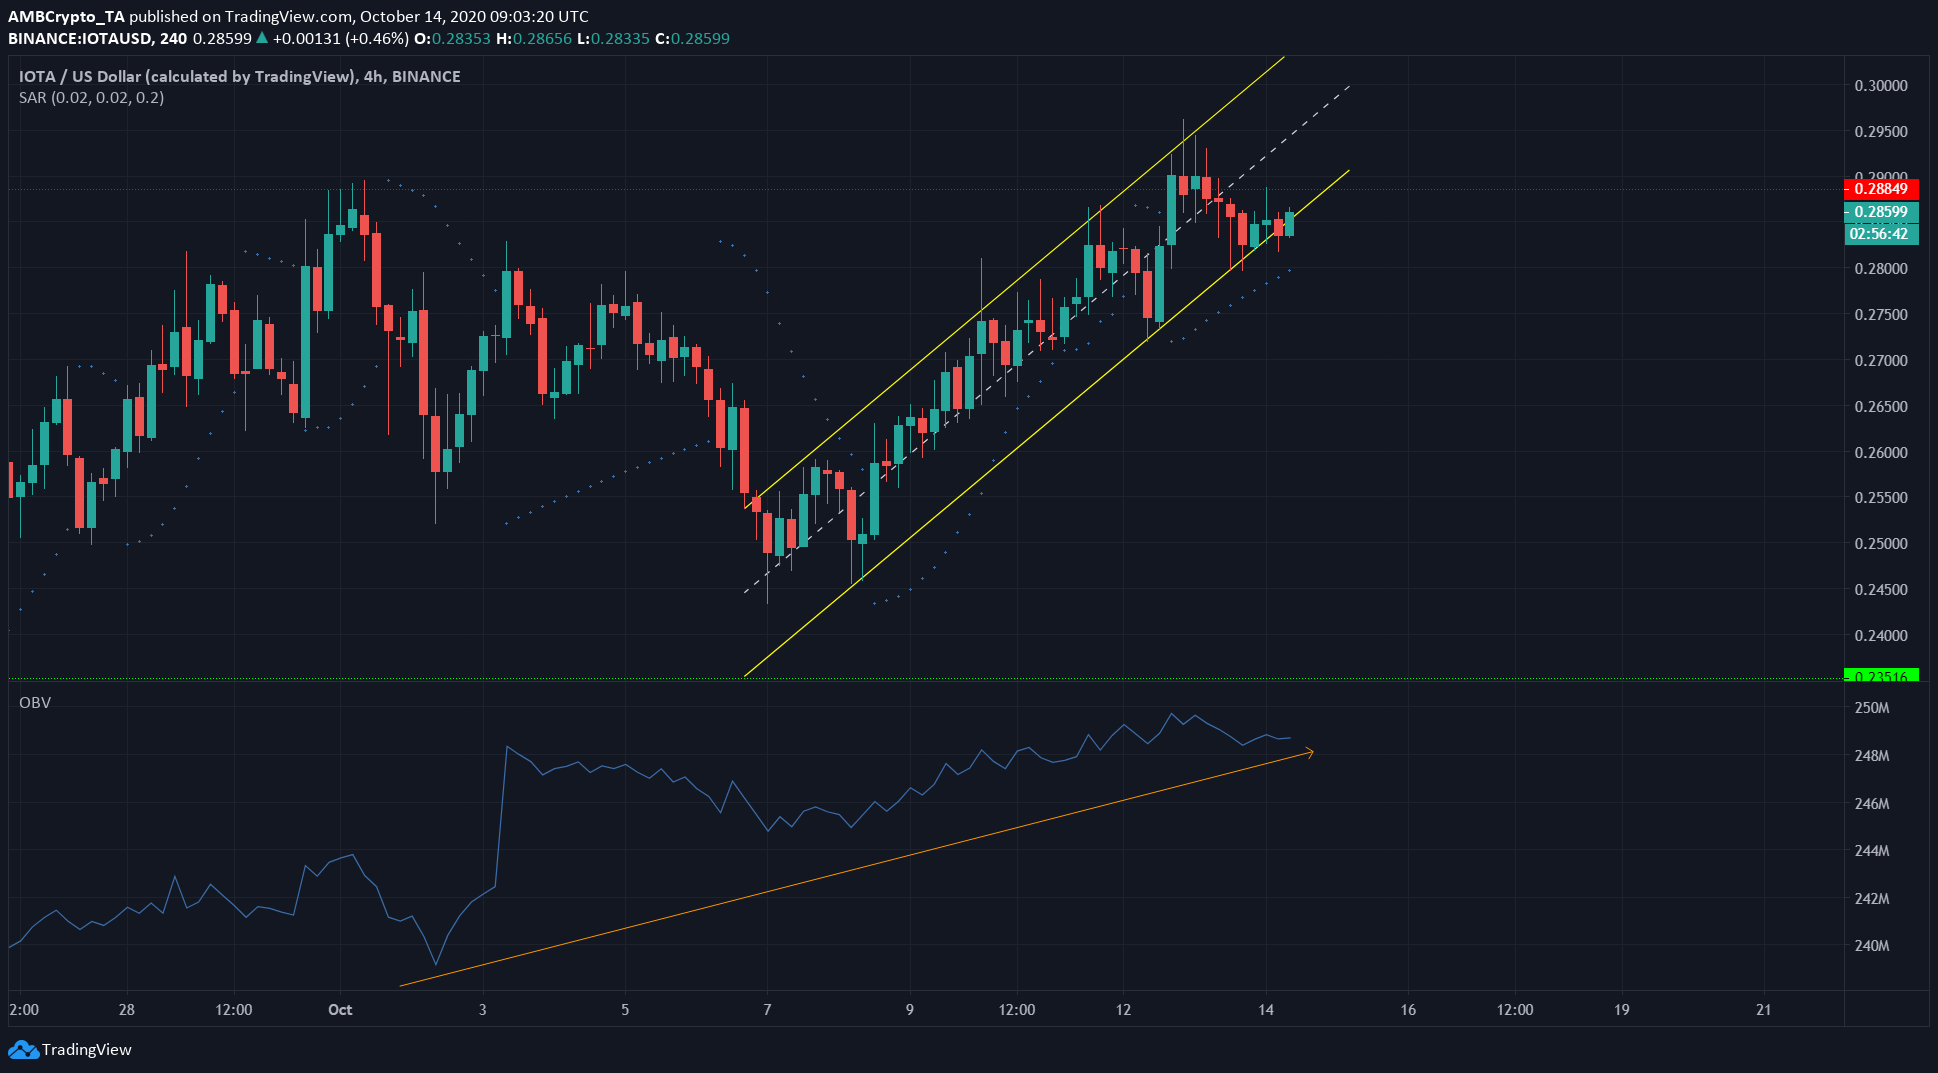
IOTA was moving in an ascending channel (yellow). Sellers tried to push the price beneath the channel, but bulls were able to step in and thwart the bears.
The level of resistance at $0.288 appeared to be under siege once more. IOTA had good buying volume behind its recent hike, as shown on the OBV (orange).
The Parabolic SAR also gave a buy signal. The OBV suggested that rejection at resistance might see IOTA suffer a minor pullback but unlikely to go as far south $0.235 support.
BitTorrent [BTT]


Source: BTT/USDT on TradingView
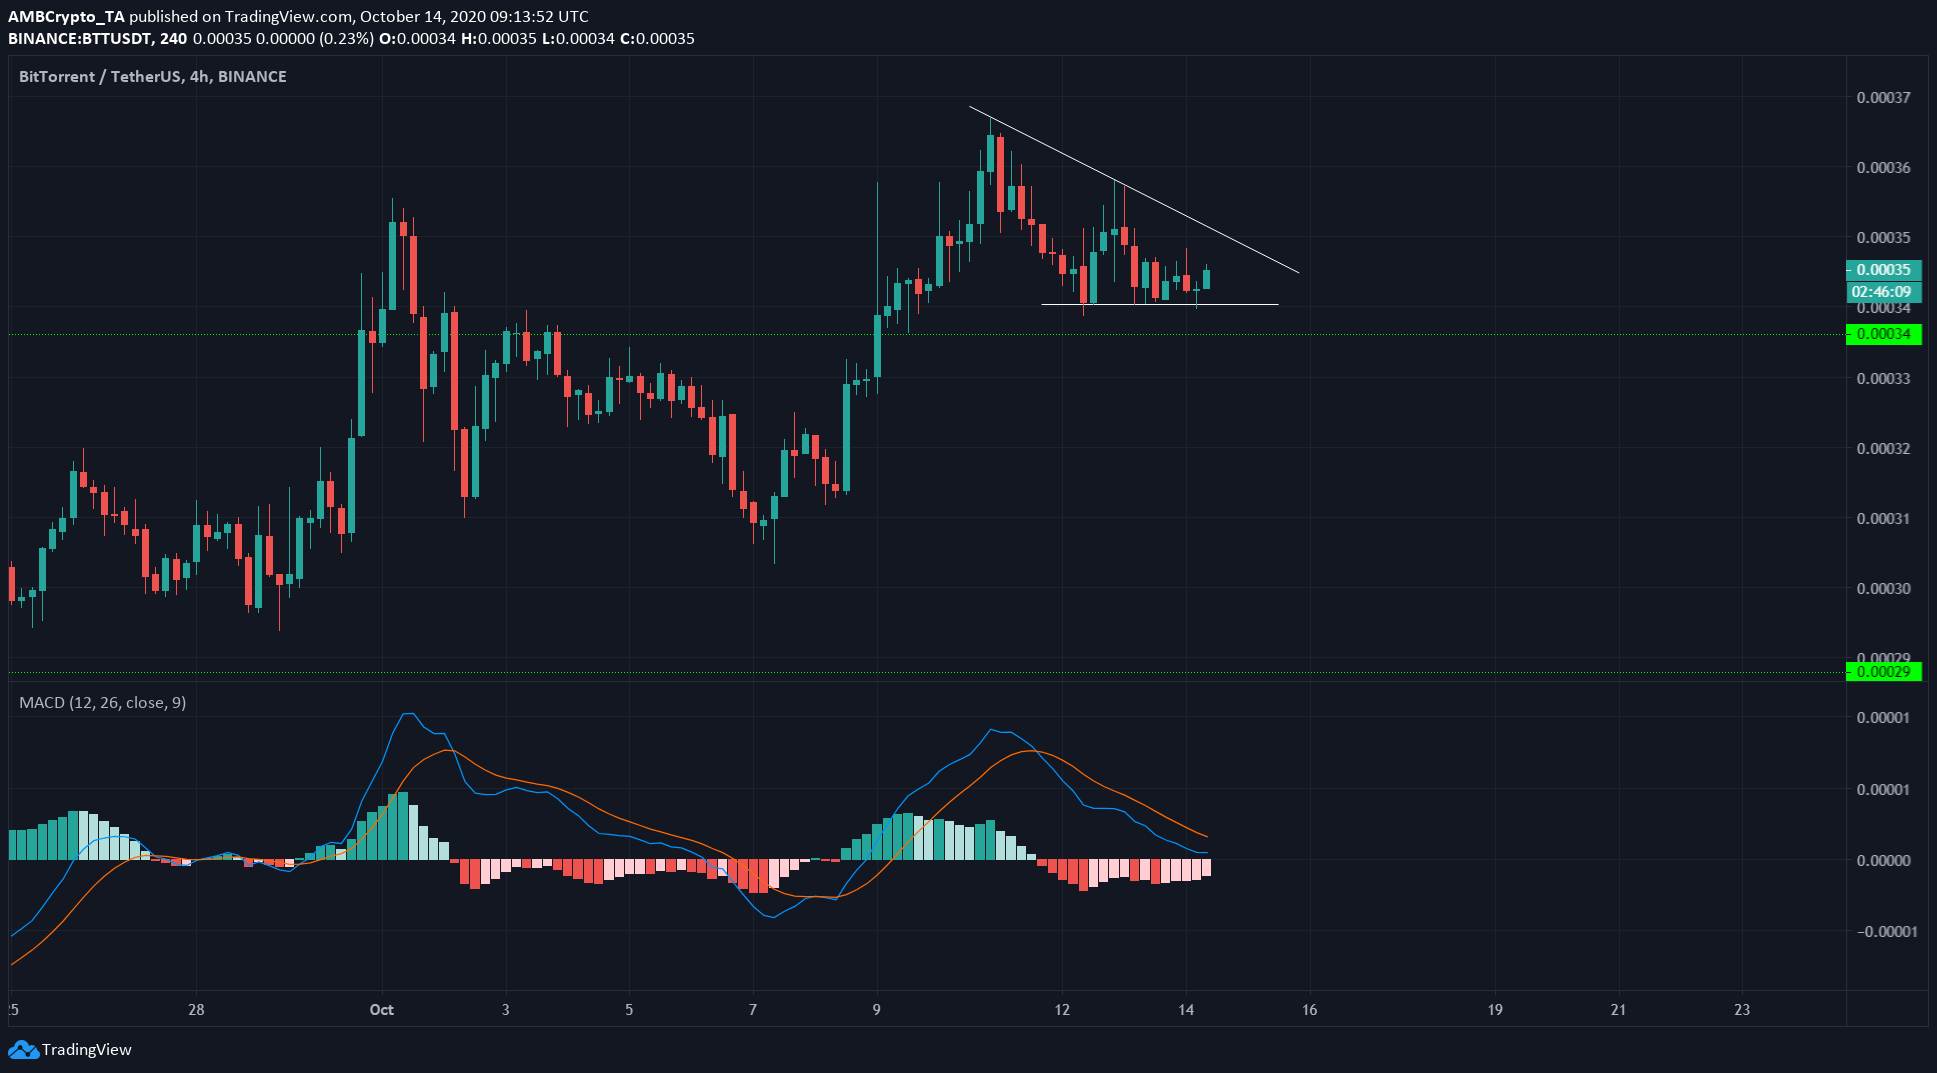
BTT formed a descending triangle (white). This is a bearish pattern that generally sees the price break out to the downside. MACD also backed this hypothesis as it showed a bearish crossover a few days ago, as BTT began setting lower highs.
A close beneath $0.00034 (the lower, flat trendline) could see BTT lose a level of support.
The post appeared first on AMBCrypto


