Disclaimer: The findings of the following article are the sole opinion of the writer and should not be taken as investment advice
With Ethereum 2.0 coming ever closer, ETH’s prospects look good. However, ETH, at press time, underlined an opportunity to short on a high timeframe. So, these are interesting times, as all of it depends on Bitcoin and whether it will rally on the price charts again.
Ethereum 1-day chart


Source: ETHUSD on TradingView
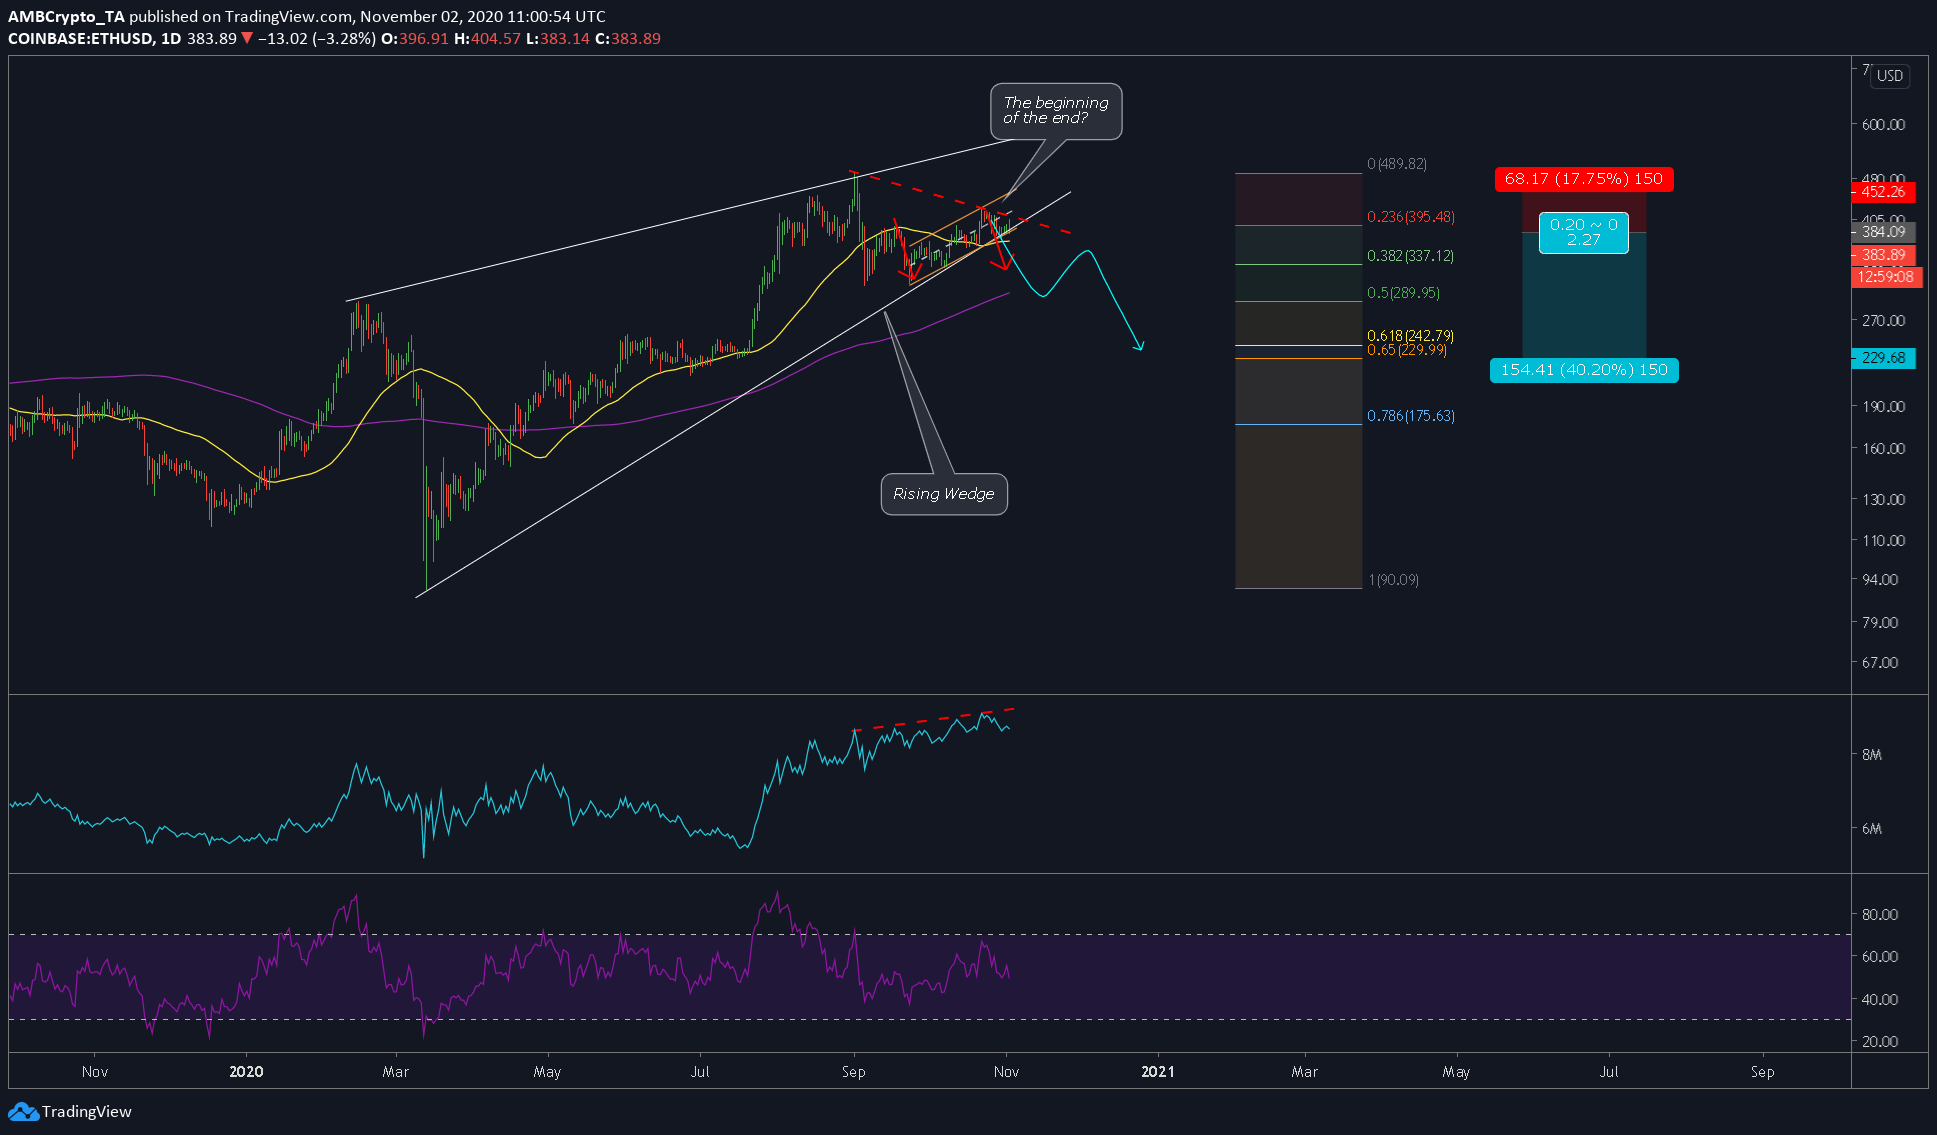
As can be observed from ETH’s 1-day chart, multiple factors are at play – two patterns, important levels, and the indicators.
Patterns over higher timeframes are almost always credible and rarely fall apart. Hence, ETH’s rising wedge is a pattern to be taken seriously. Based on the said pattern, we might see a price drop that might easily be in the double-digit range.
If the rising wedge wasn’t bearish enough, there was a small ascending channel being formed at the end of the wedge. Together, with the recent drop on 19 September, this formed a bearish flag with a breakout awaited on the charts.
Rationale
In addition to the bearish patterns, other aspects that promoted a bearish drop were the indicators – OBV, RSI. The former, with the price, had formed a bearish divergence, indicating an incoming drop. The RSI had also failed to move beyond the overbought zone and was moving towards the neutral zone.
As of now, the 50-day moving average [yellow] is supporting the price and breaching this will push the price down to the 200-day moving average at $300.
Levels to look out for
For a short position, these are the levels to keep an eye out for,
Degenerate levels
Entry: $384
Stop-loss: $452
Take-profit: $229.68
Risk-to-reward: ~2.27
Conservative levels
Entry: $384
Stop-loss: $421.96
Take-profit: $337, $289
Risk-to-reward: ~1.24, ~2.51
Understandably, this target is too steep to come true, especially considering a normal scenario. Perhaps, a March-style crash could achieve this, but it wouldn’t happen normally. So, an adjusted target would put the take-profit to $289 aka the 0.5-Fibonacci level. Even with a reduced take-profit, this might be a bit of a stretch, hence, a conservative take-profit would be the 0.382-Fibonacci level or $337.12
The post appeared first on AMBCrypto


