The digital asset industry has somewhat re-ignited its bullish momentum over the past week as Bitcoin emerged above $11,000 price level yet again. Ethereum kept pace with the king coin and currently, both the assets are enjoying over 6 percent growth over the past week.
Yesterday the market opened on another high as Ethereum Grayscale Trust became an SEC reporting company, adding a layer of credibility to the 2nd largest asset. With things moving in the right direction, we analyzed the daily and weekly chart for more indications which may suggest an incoming bull run.
Ethereum 1-day chart
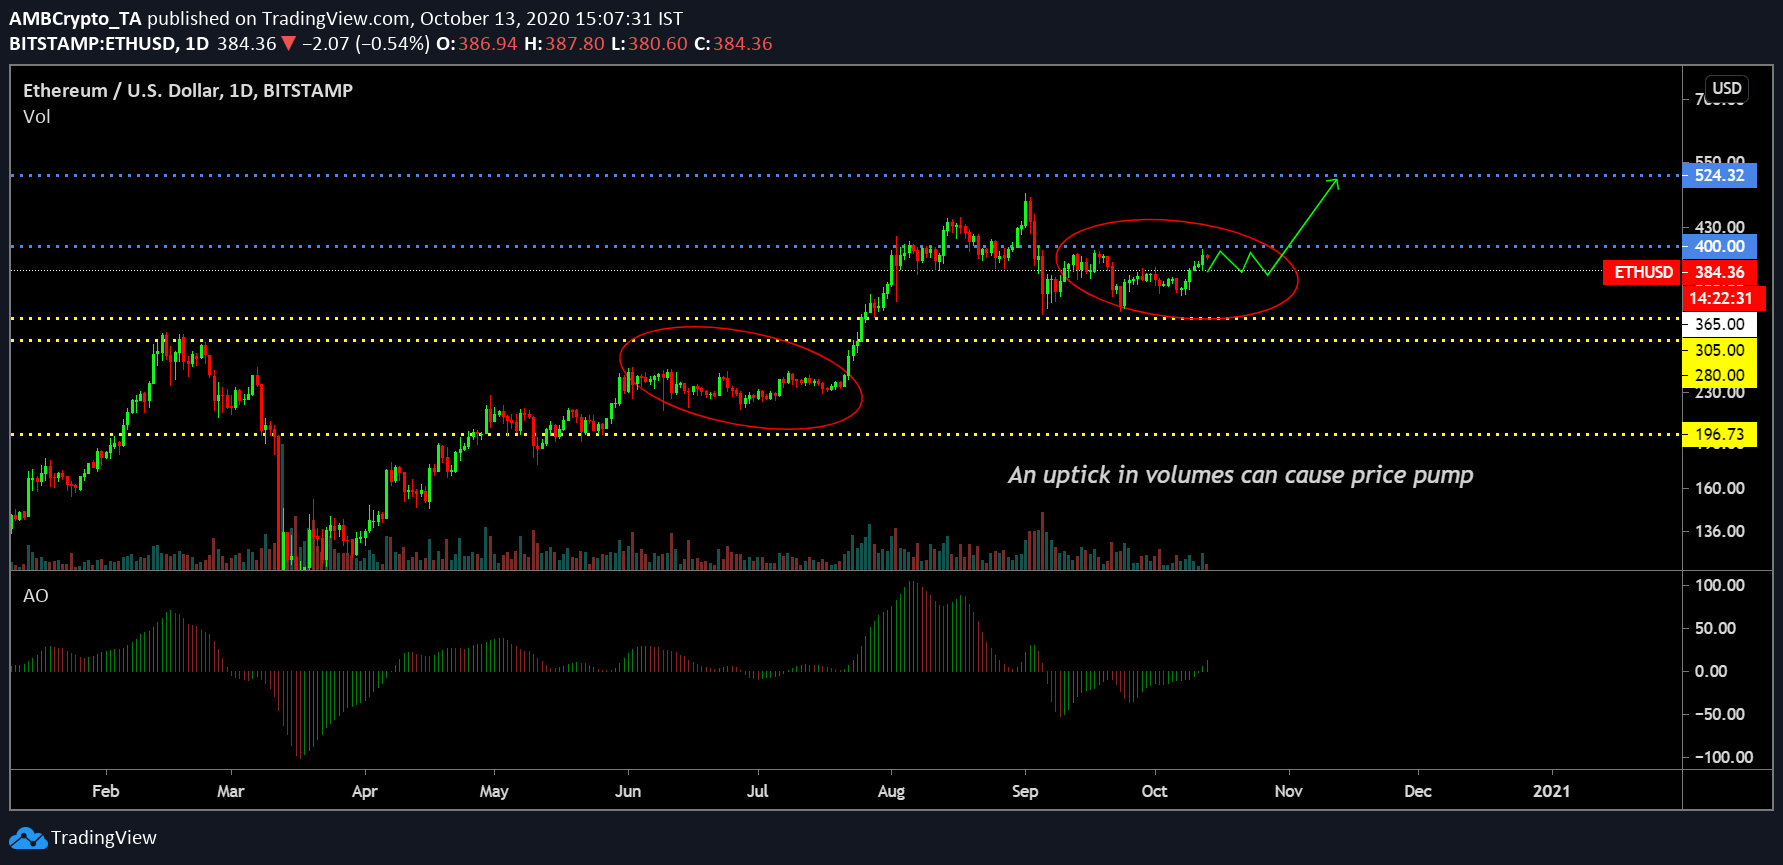
The 1-day chart of Ethereum is currently replicating the consolidation phase of June-July. During the end of July, the bull rally kicked in causing a major upheaval of the valuation from July-end to August-mid. Now, after another similar period of consolidation, the Ethereum price might represent another strong rally towards the 2nd half of October.
Over the current week, Ethereum might swing trade a little by pivoting off the 1st support at $365. After fueling back to back bounce back from $365, the price should gain enough momentum to jump near its August mid highs of $480 by November 2nd week.
The current price can be observed with less trading volume which can be considered as a trigger point. An uptick in trading volume might cause the price to pump higher with bullish momentum.
Awesome Oscillator also hinted at the beginning of Ethereum’s rising bullish momentum.
Ethereum’s 1-week chart
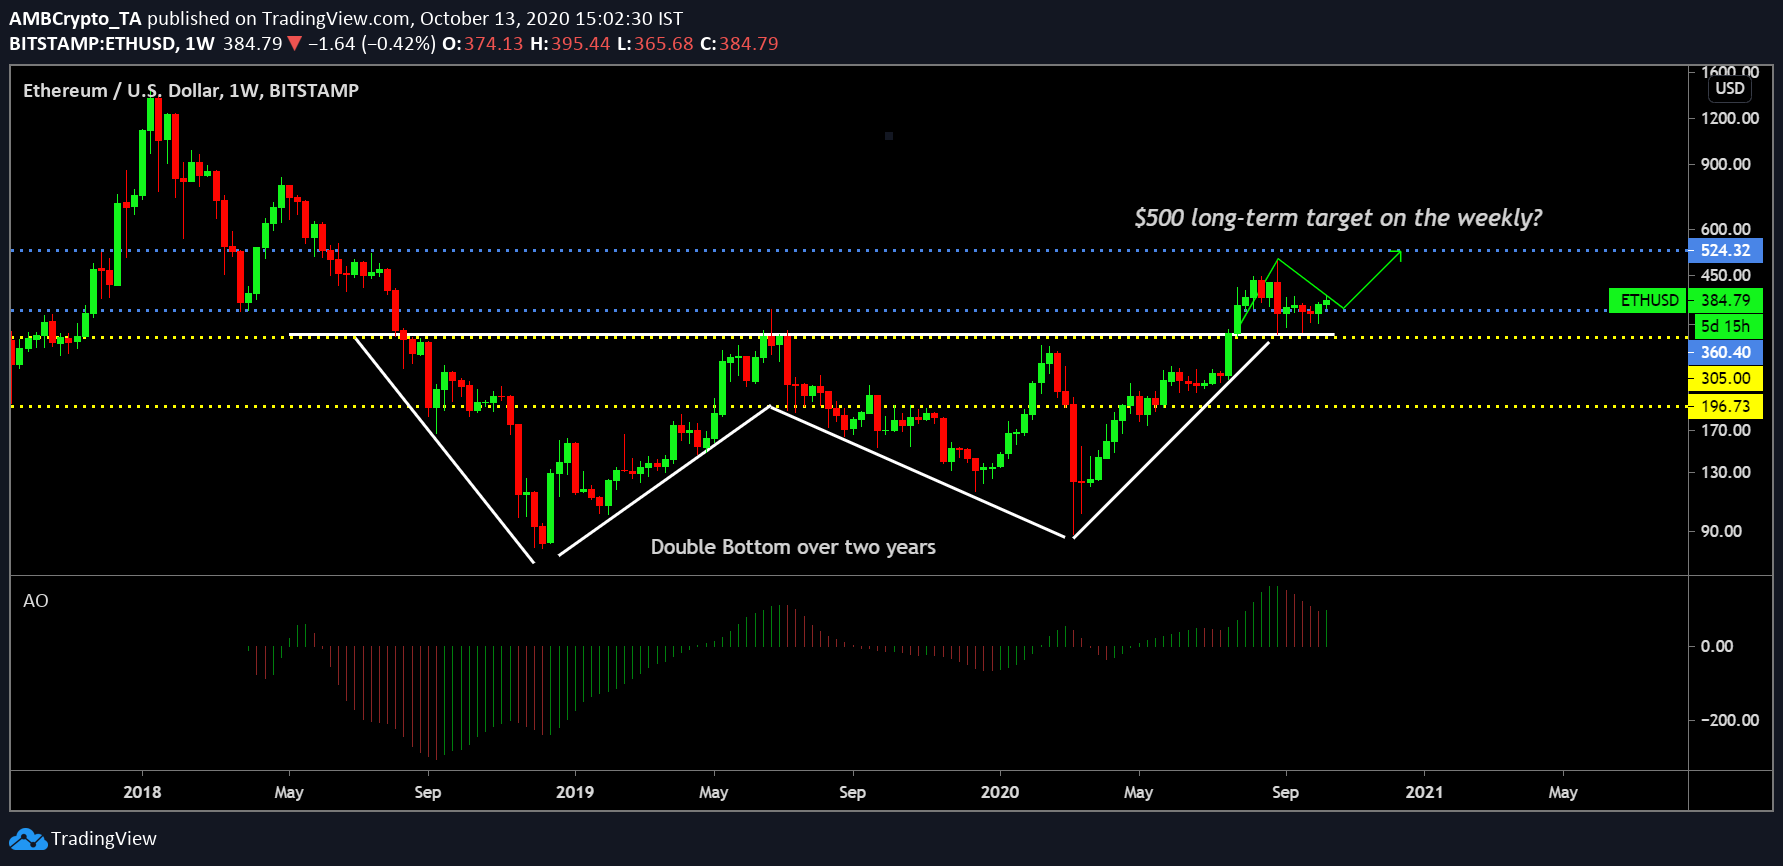
On the 1-week chart as well, Ethereum was witnessed completing a double bottom chart which has taken place in 2+ years starting May 2018. The major fact that ETH has maintained to close a position above the weekly resistance of $360 over the past two weeks is a strong sign of balance and maturity. The next resistance to climb above remains the $400 mark which should be talked easily over the next week.
While the Awesome Oscillator exhibited a little bearish undertone, a green candle to close the recent trend suggested a potential reversal. If the bullish pieces are moved in a clock-work manner, a next all-time high for Ethereum in 2020 can be possible by the end of November; a valuation close to $500.
The post appeared first on AMBCrypto


