For Ethereum and the rest of the altcoin industry, volatility is high at the moment. With the price undergoing massive sell-off and surges on a 24-hour period, Ethereum has entered a transitionary realm when bears are losing their grip on the long-term.
With consistent recovery since September 3rd, there was a high probability for Ethereum to regain its $400 mark but the bears may swing the trade towards them as well.
Ethereum 6-hour chart
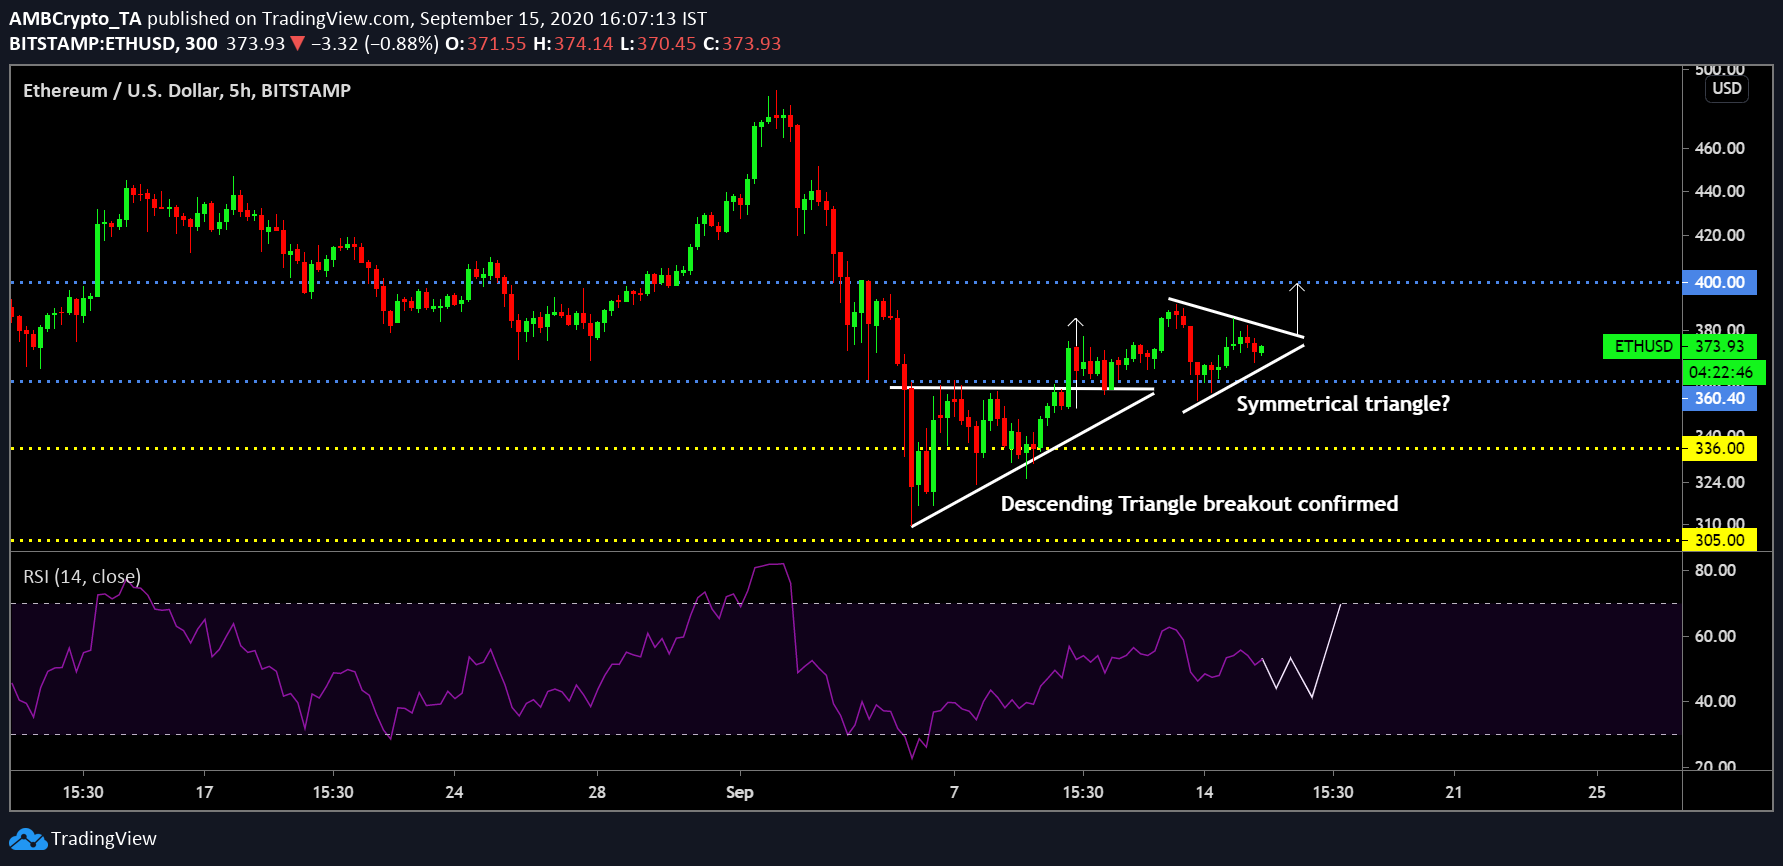
As illustrated in the chart above, Ethereum’s first breakout above resistance $360 came at the back of a descending triangle pattern. Afterward, the asset did not lose track in terms of recovery and carried forward to sustain a position above said resistance of $360. Now, over the past 24-48 hours, a turbulent period has led to the formation of a symmetrical triangle. Although the breakout from a symmetrical triangle is 50-50, assuming the trend is able to keep up with its bullish momentum, the next re-test could be at $400.
Relative Strength Index or RSI also suggested the activeness of buying pressure hence the chances of a spike are quite clear and relatively strong over the next few days.
Ethereum 1-day chart (Bearish Edition)
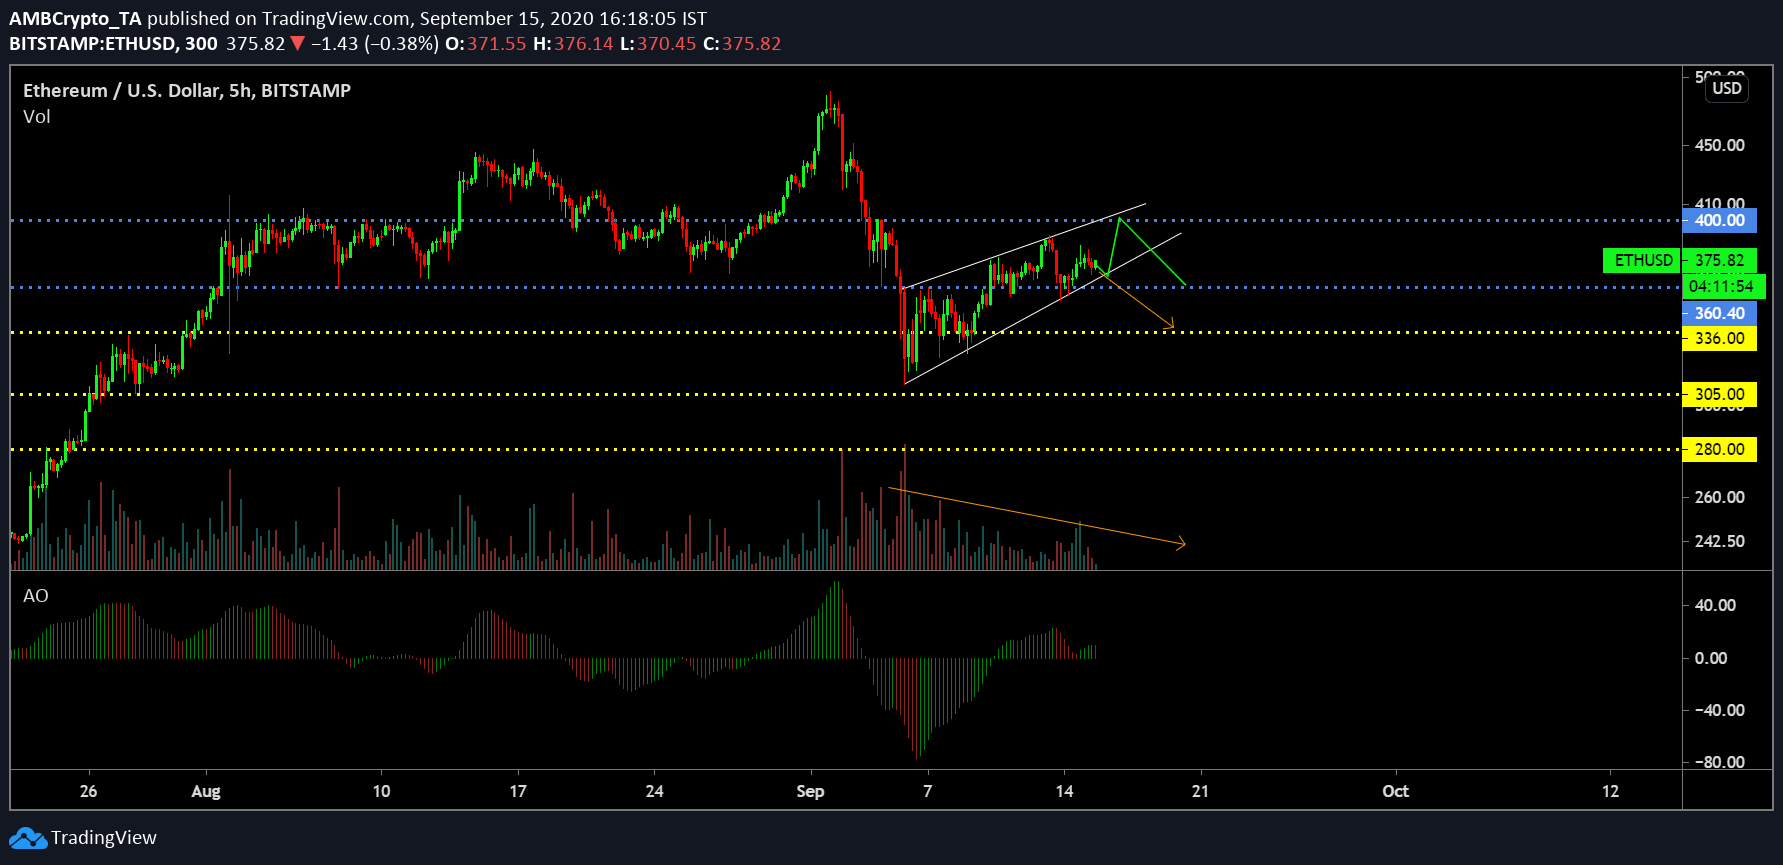
However, considering the markets are extremely fickle at the moment, the chances of a drop from here onwards is high as well. From a larger perspective, Ethereum’s value is also oscillating within the trendline of a rising wedge, hence a breakout down south is also in the cards. A strong re-test from $360 can be expected at the moment, but the bearish divergence with volume indicated a fall all the way down to $336 is also possible.
Awesome Oscillator or AO also suggested that momentum is slighting diminishing from the charts, suggestive of a bit of stagnancy.
Verdict
At the moment, nothing is set in stones over the next week as a breakout both ways seems feasible in the charts.
The post appeared first on AMBCrypto


