Disclaimer: The following price prediction analyses the emerging price trend in the market and its impact.
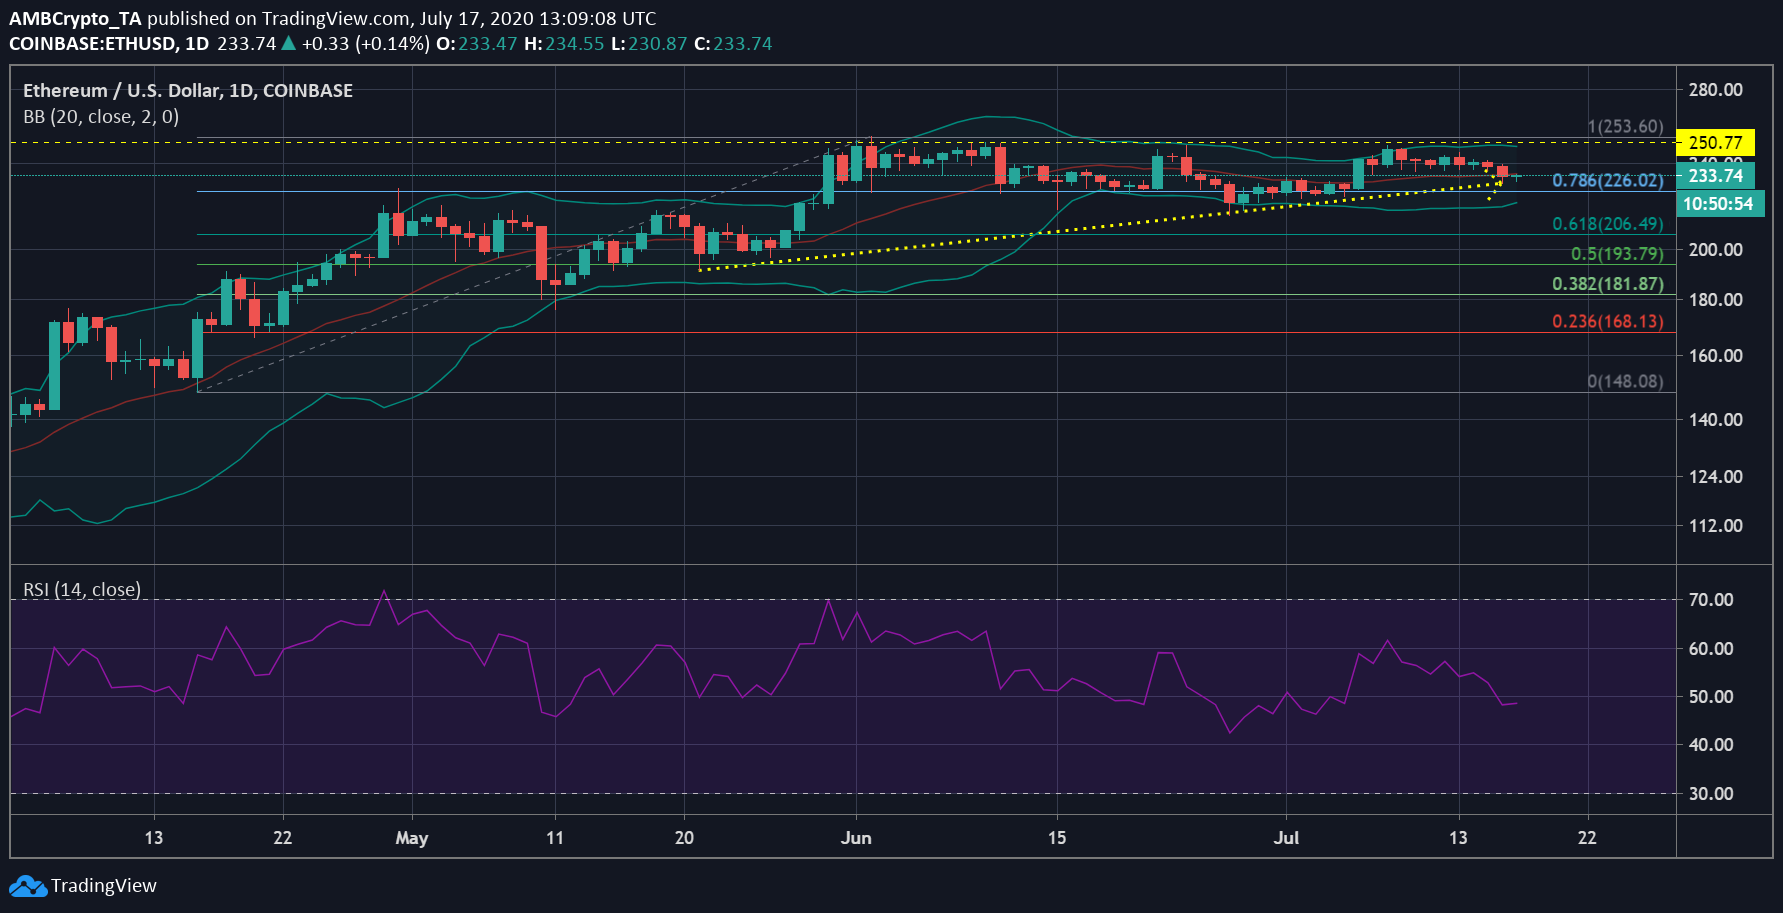
Ethereum’s price was able to breach past the resistance at $226 and reach $249, however, with the resistance so close at $250, the coin retracted. The second-largest digital currency has been bouncing around $227 and $250 for the past month. At press time Ethereum had been trading at $233.22 with a market cap of $26.08 billion.


Source: ETH/USD on TradingView
According to the daily chart of Ethereum, the digital asset been noticing the price to trend lower. Since mid-may, the Ethereum price movement allowed a horizontal line to be drawn along the swing highs at $250.77, and a rising trendline can be drawn along the swing lows, suggesting the formation of an ascending triangle. As the pattern is a continuation pattern, the breakout ought to take place in the direction of the previous breakout.
According to Ethereum’s chart ascending channel succeeded a symmetrical triangle breakout towards the upside. This could mean, that the breakout from the ascending triangle pattern could be upwards. However, as the price is moving lower, it may bounce off the support provided by the upward sloping line of the ascending triangle. The Bollinger Bands indicator, appeared to be diverging indicating the increase in volatility in the market, while the signal line was moving above the price bar suggesting a downward pressure.
If ETH were to break out of the pattern it has to breach resistance at $250, following which $253 also noted an important resistance. However, if the coin breaks down, $226 could be an important support, but if the ETH failed to hold on to this level, it may sink further to $206, as noted by the Fib Retracement tool.
According to the Relative Strength Index, Ethereum has maintained a balance between the buying and the selling pressure. At press time, it was at equilibrium.
The post appeared first on AMBCrypto


