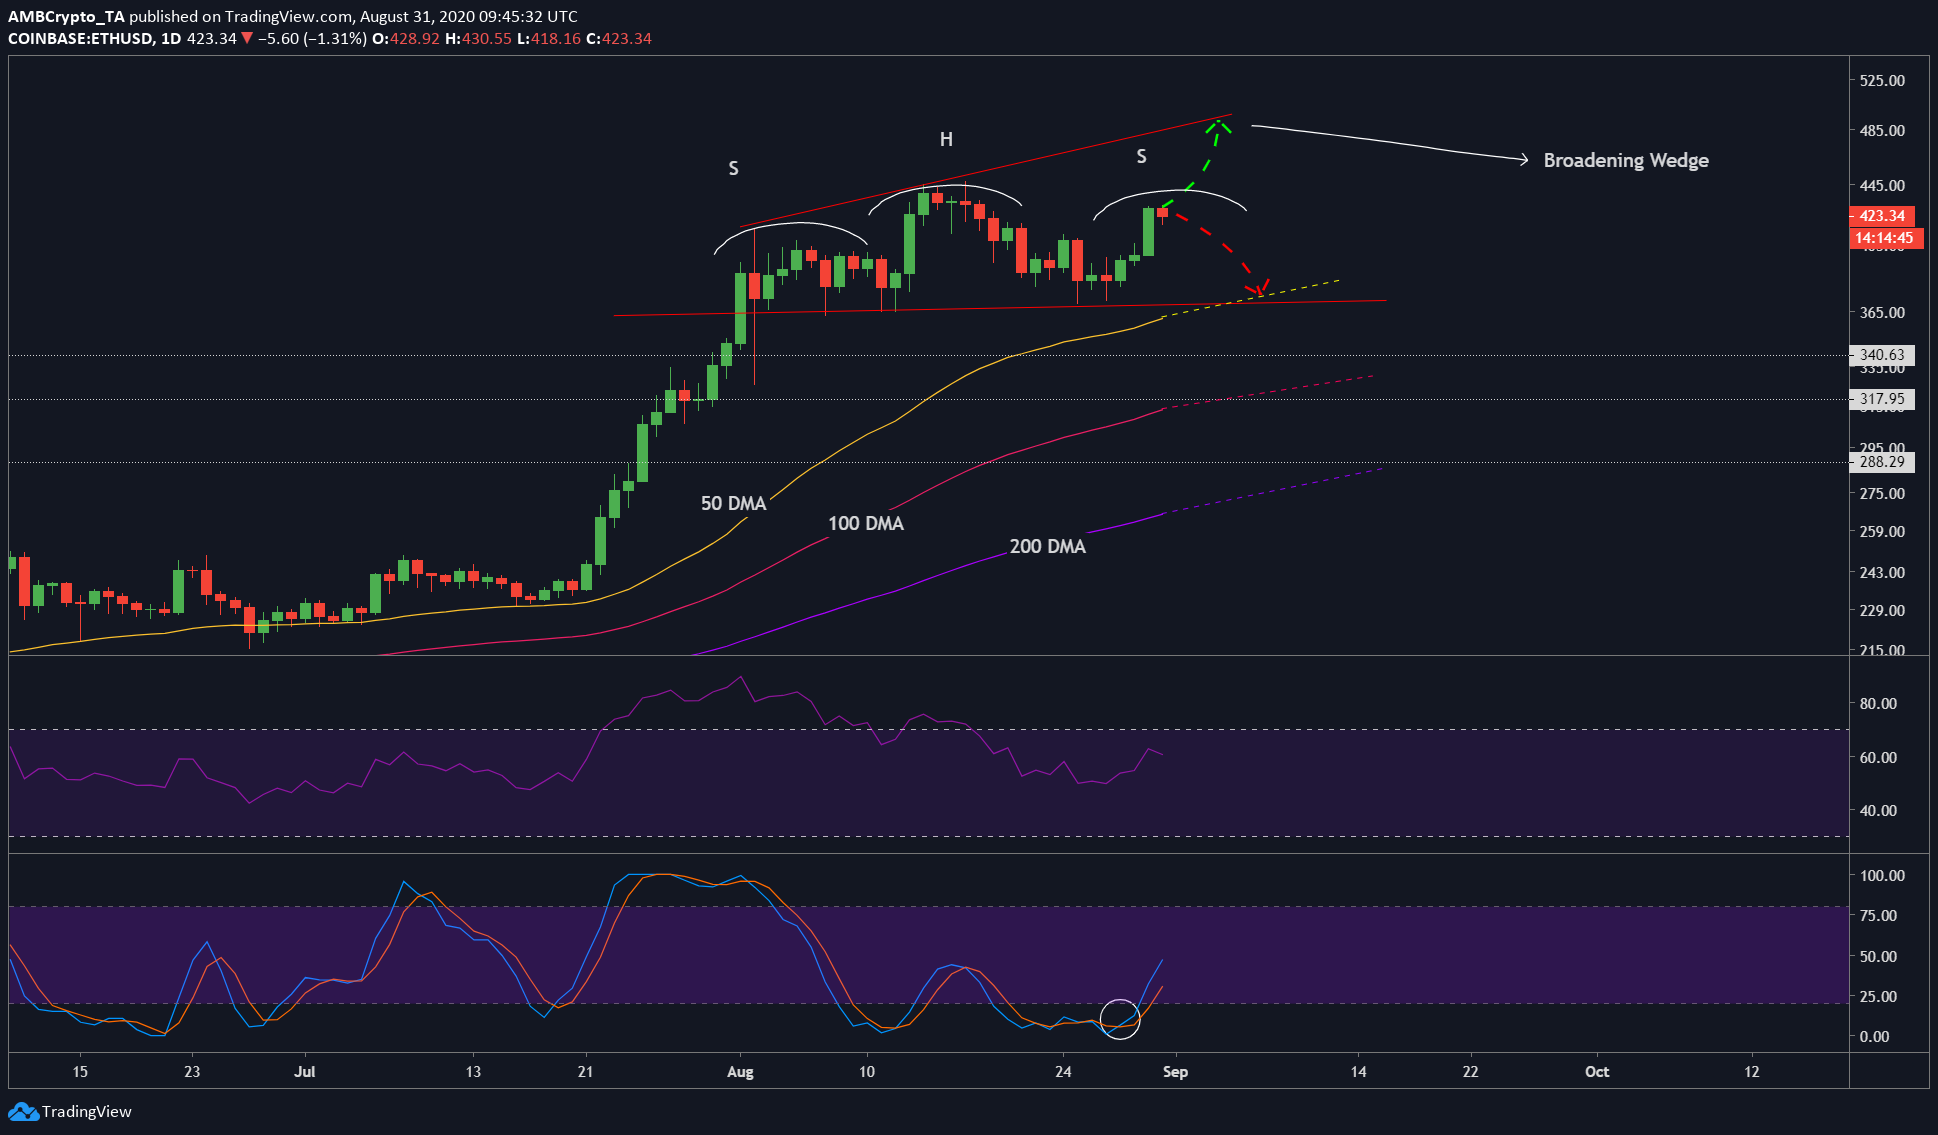
Like Bitcoin, Ethereum didn’t show a lot of strength among buyers or bulls, at the time of writing. In fact, ETH’s price looked toppy. After tapping the $420 level 6-7 times in less than two weeks, ETH might go under it once again.
On the daily time frame, ETH’s price was showing signs of what seemed to be a potential broadening wedge pattern. Since the trend before this pattern was bullish, the breakout will most likely be bearish. This is the first potential reason why ETH will see a retracement of 10-30%.
Ethereum 1-day chart


Source: ETHUSD on TradingView
The one-day chart showED a potential broadening wedge formation underway. However, as previously mentioned, it was too soon to tell. Assuming the price completes its surge to the top of the line, this would confirm the formation of a broadening wedge. In this case, the price will surge to $500 or $490, which is a 17% surge from the current level. Supporting this was the Stochastic RSI, which registered a bullish crossover recently.
Following this surge, the price will be primed to break out of this pattern, a breakout that will be bearish. The breakout will push the price down to the 50-day moving average [yellow]. This will mean a 15-20% depreciation in the price of ETH. Depending on the bears’ strength, the price could dip from the 50-DMA [$375] to the 100-DMA [pink] at $330.
This is the first bearish case for Ethereum. However, the second bearish case arises if ETH doesn’t surge to the top of the potential broadening wedge. In this case, the price will head towards the lower part of the broadening wedge; this would mean a head and shoulder pattern formation. Since such a case will include a formation at the top of the trend, this would mean the price reversing its direction.
In this case, the retracement from the neckline [$370] would mean an 8.3% drop to the next immediate support at $340. As mentioned previously, depending on how fierce the bears are, the price can dip to as low as the 200-DMA [purple] at $288.
As was highlighted, the market’s bears seemed to have cornered Bitcoin as well. Considering ETH’s correlation with BTC, a drop in ETH’s price will be sealed if BTC crashes violently.
The post appeared first on AMBCrypto


