There is no lack of development in the Ethereum community at the moment. However, while Ether’s value is soaring, the network has become the most expensive one to use and miners are rejoicing over all-time high revenues, with the network’s hashrate now better than it has ever been in the last 20 months.
And yet, nothing conclusive can be asserted about Ethereum’s fundamentals or its price. While the hashrate reached a 20-month high, the daily active addresses for Ethereum registered a 67-day drop. The contradiction was evident, with DeFi pulling a lot of strings in the ETH ecosystem.
Now, while DeFi continues to bloat Ethereum’s transaction fees, it is possibly pricing out users who wanted to use the network and register authentic activity. One set of data that remains consistent and indicative of the use of Ethereum as an asset is its Options activity.


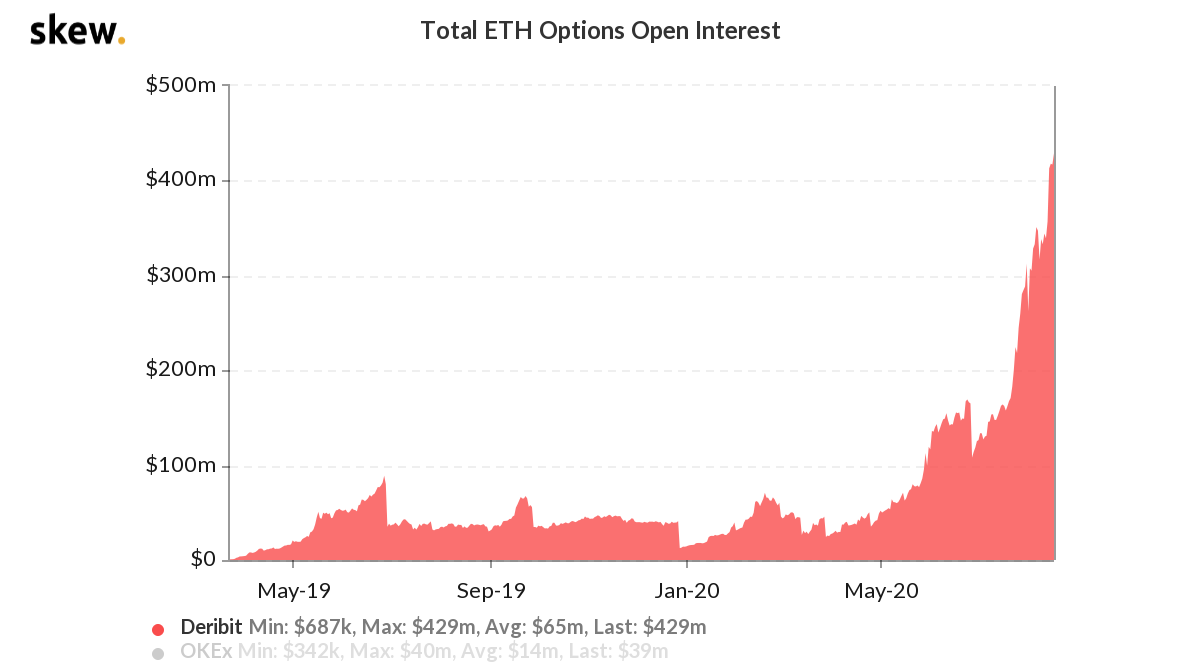
Source: Skew
Since the start of August 2020, ETH Options activity on Deribit has noted a $150 million rise in OI, marking a substantial rise in activity in a very short period. The Open Interest jumped from $310M to climb to an all-time high of $440M. Now, the major difference between Options activity and any fundamental metric is the sole fact that ETH Options are a result of user base participation.
A higher OI is a direct indication of the fact that investors and traders are consistently involved in Ethereum’s network, without a side-chain protocol consuming all the space.
Another important aspect that is indicative of Ether’s price movement is its rising Implied Volatility levels.
As can be observed from the chart, Implied Volatility reached a low of 3.2 percent in July, indicative of a lackluster period in June. Volatility, although it might drive prices down, is extremely imperative for a price surge as well. Soon after it gradually built up, ETH’s IV spiked quickly from 3.4% to $5.4% over the past two weeks.
Improving IV is indicative of an extremely active price trend going forward, and considering the major factors in play and the overall trend being bullish, the prices may only go higher from here.
Are Ethereum’s derivatives a clear indication of activity?


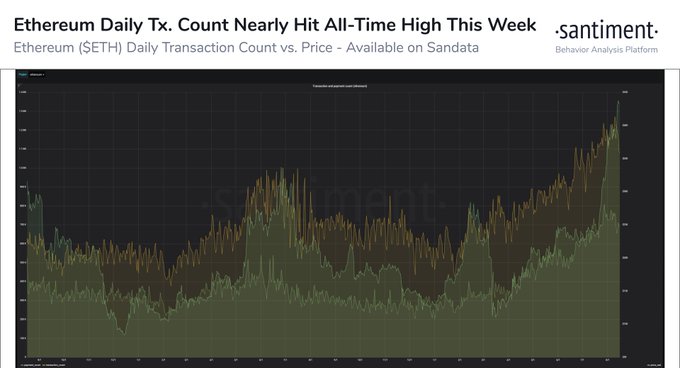
Source: Twitter
Santiment recently suggested that Ethereum’s daily transaction count is on its way to breach its 2018 ATH of 1.34 million. Now, on the surface, this is extremely positive, but the fact remains that these transactions are all taking place in DeFi to either unlock gas or DeFi token acquisition. So, in spite of the metric rising on the chart, it is not representative of user utilization.
On the contrary, Ethereum users continue to flood into the derivatives exchange where the interaction with ETH in transparent. Hence, it can be speculated that Ethereum Options activity is the only remaining real-time data for the world’s largest altcoin market.
The post appeared first on AMBCrypto


