- Ethereum saw a sharp 3% price drop today as it falls to the $230 level.
- This price decline has put ETH in danger of breaking beneath a rising trend line and turning bearish.
- Against Bitcoin, Ethereum fell lower from the 0.0263 BTC resistance to reach 0.0253 BTC again today.
ETH/USD: ETH Bears Push Into Trend Line Support
Key Support Leves: $225, $215, $210.
Key Resistance Levels: $245, $250, $265.
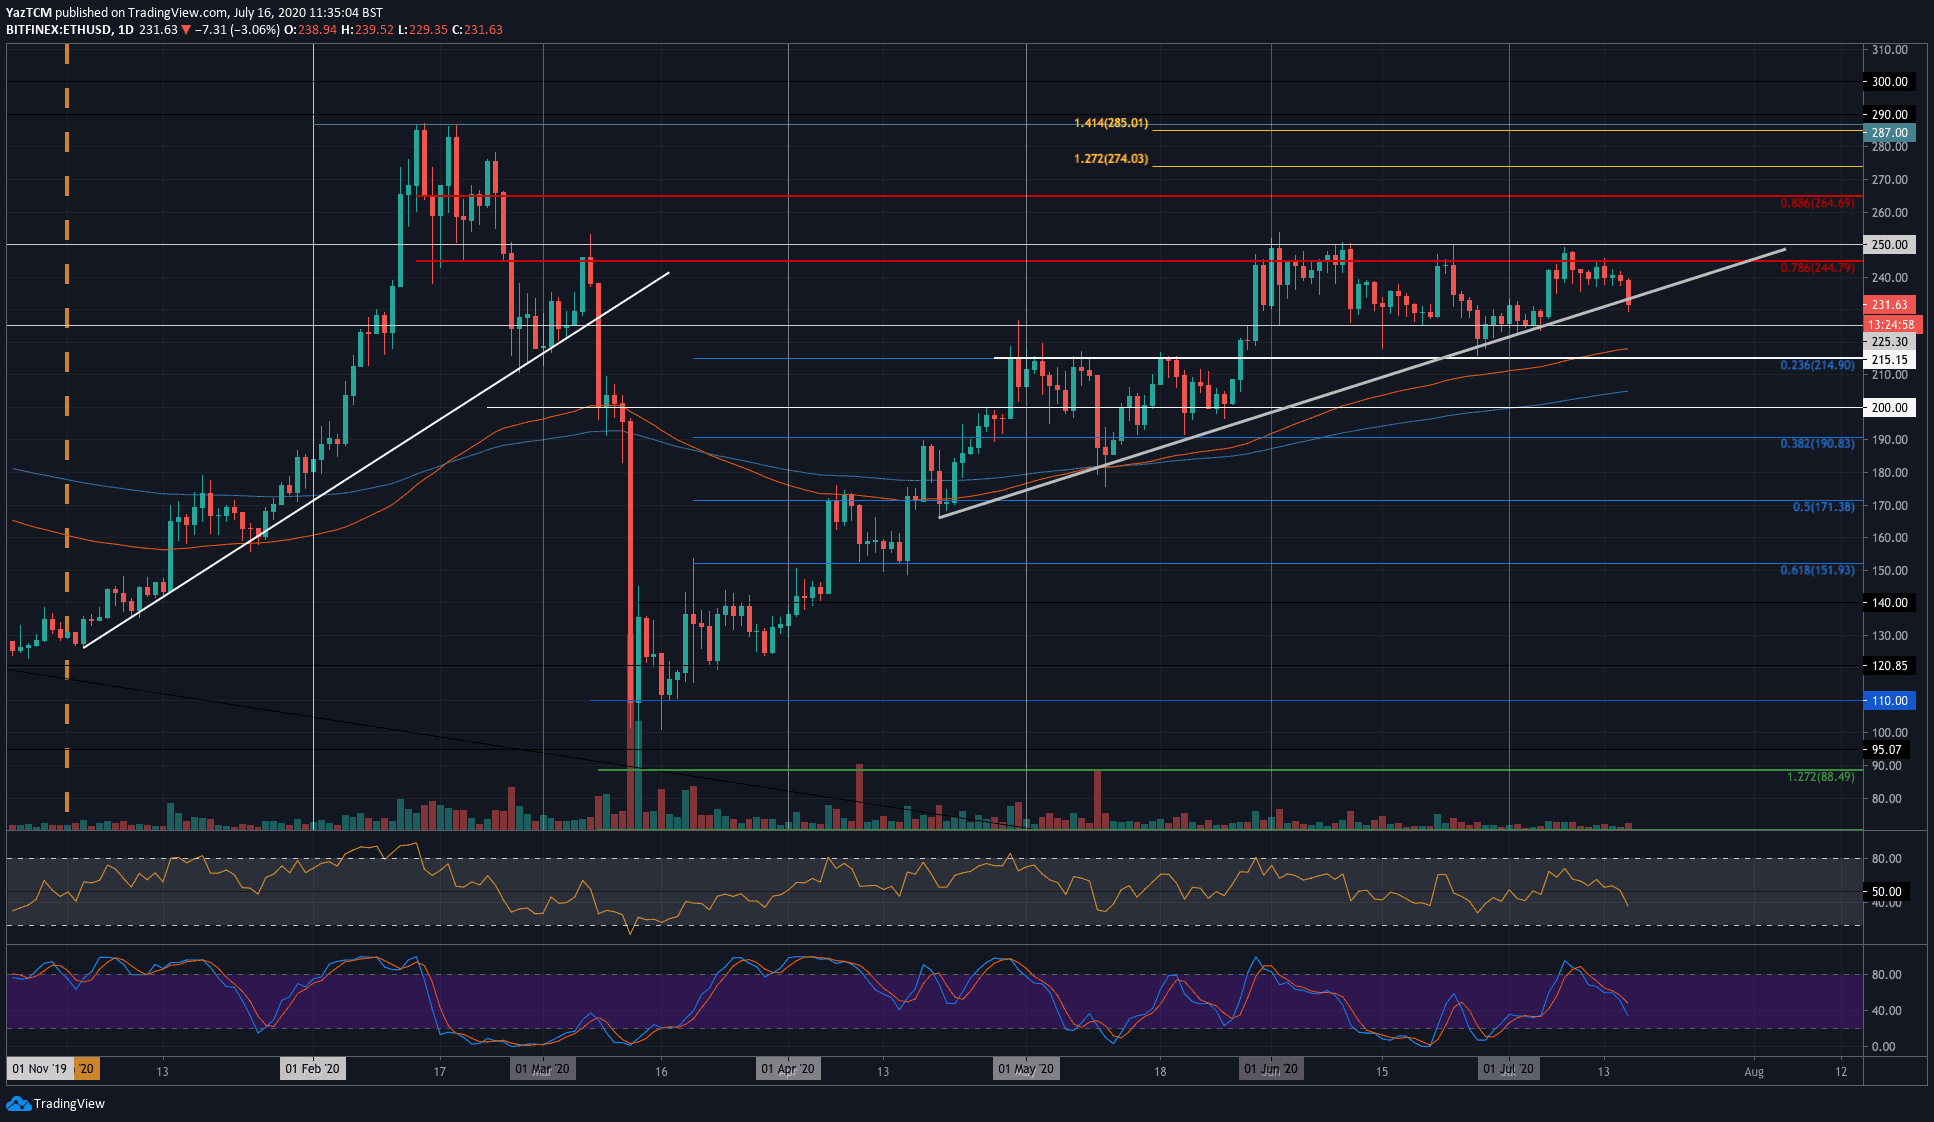
Looking at the daily chart, we can see that ETH struggled to break the resistance at $245 this week which caused the coin to roll over and fall. The latest 3% price drop saw ETH poking beneath the rising trend line and if it closes beneath it, the coin could unwind toward $190.
This trend line has been in play for almost 3 months and a break beneath could result in negative pressure for ETH. It is important to remember that a closing candle must be seen beneath the trend line to act as confirmation that it has indeed been penetrated.

ETH-USD Short Term Price Prediction
Looking ahead, if the sellers break beneath the trend line, the first level of support lies at $225. Beneath this, support lies at $215 (100-day EMA), $200 (200-day EMA), and $190 (.382 Fib Retracement).
On the other side, if the bulls can rebound from the rising support line, resistance is firstly located at $245 (bearish .786 Fib Retracement). Above this, added resistance is found at $265 (bearish .886 Fib Retracement) and $275.
The RSI did recently slip beneath the 50 line which indicates that the sellers are in charge of the market momentum.
ETH/BTC: Ethereum Returns To 0.0253 BTC Support
Key Support Levels: 0.0253 BTC, 0.025 BTC, 0.0241 BTC.
Key Resistance Levels: 0.0263 BTC, 0.0266 BTC, 0.027 BTC.
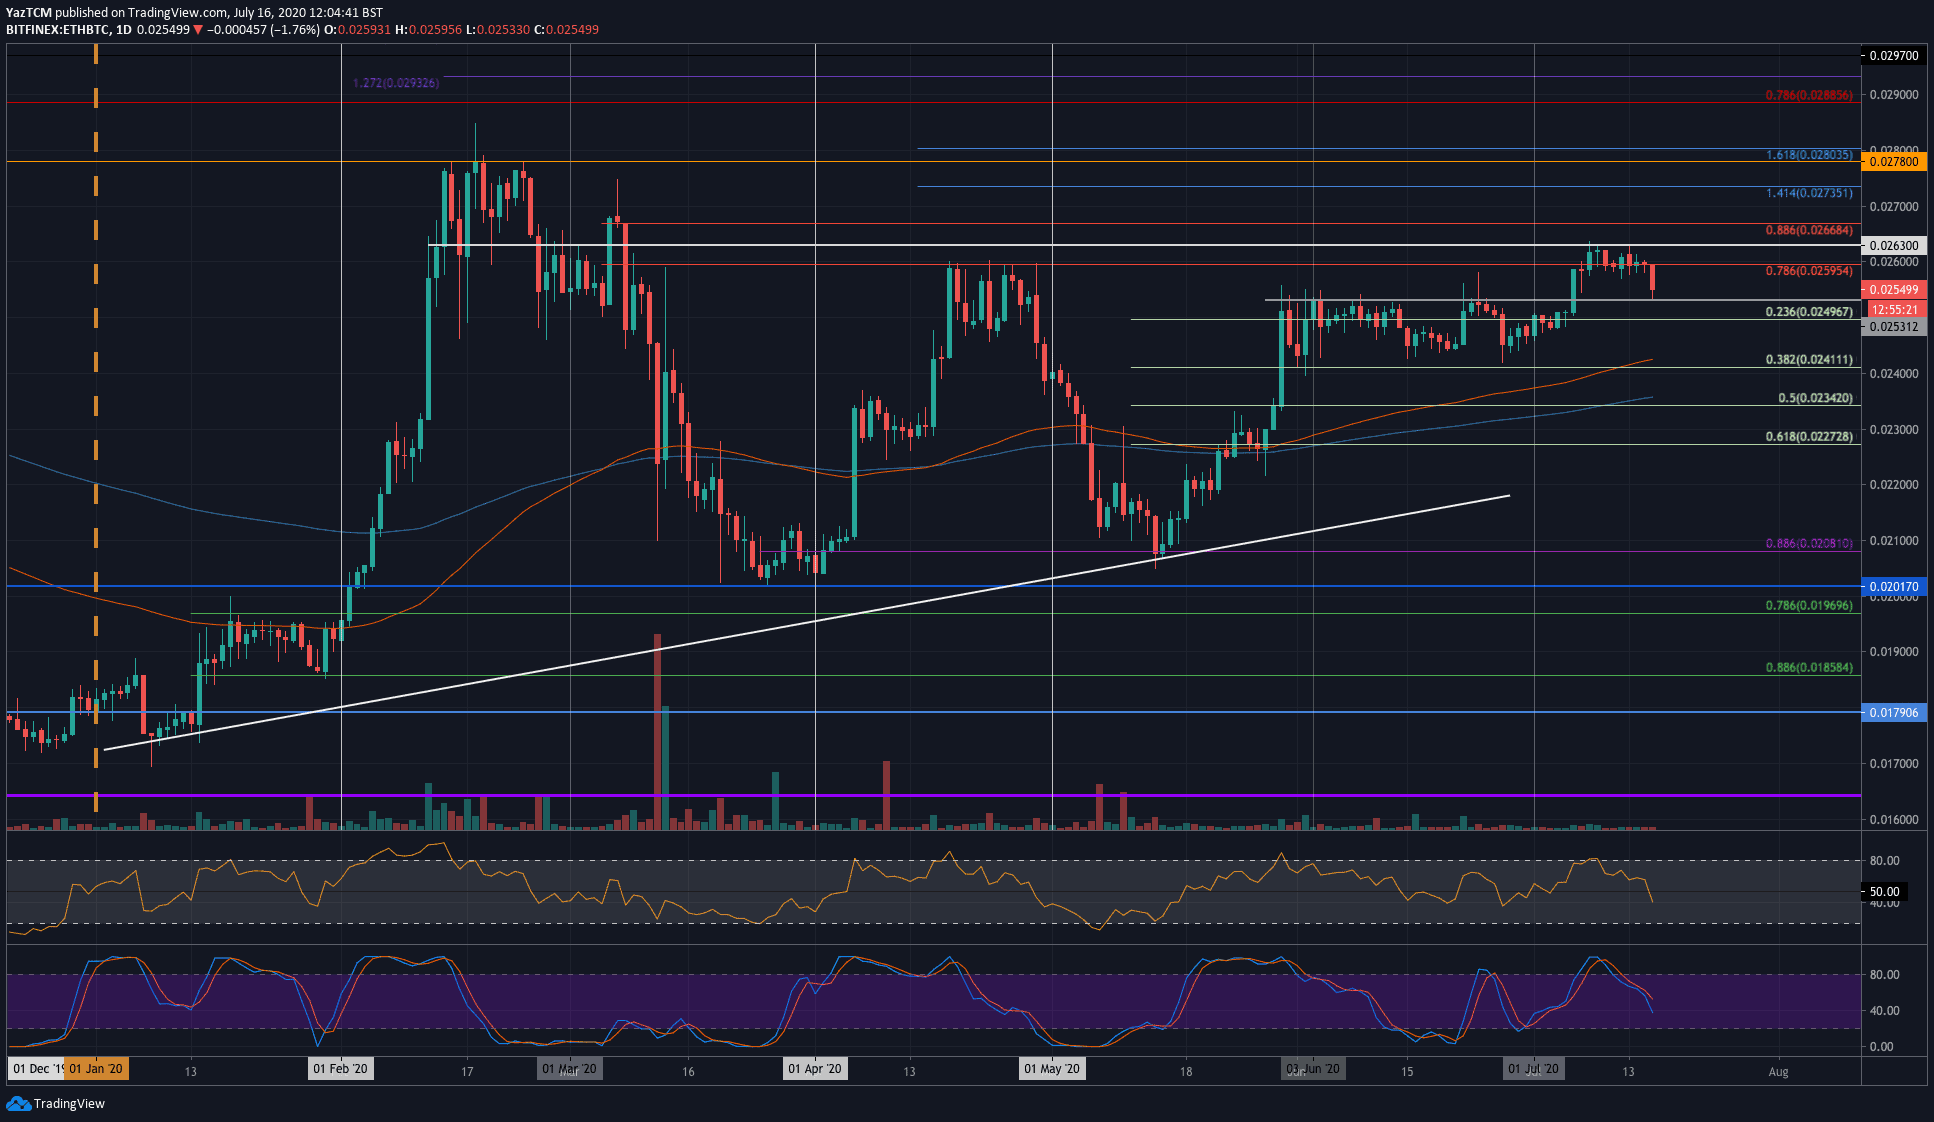
Against Bitcoin, ETH had pushed higher above the strong resistance at 0.0253 BTC at the start of July. This allowed it to reach the resistance at 0.0263 BTC.
Unfortunately, the buyers were unable to break above this level, which caused the coin to roll over and fall today as it hit the 0.0253 BTC support again.

ETH-BTC Short Term Price Prediction
Looking ahead, if the bears push beneath 0.0253 BTC, immediate support is found at 0.025 BTC (.236 Fib Retracement). This is followed by added support at 0.0241 BTC (.382 Fib Retracement & 100-days EMA) and 0.0234 (.5 Fib Retracement).
Alternatively, if the bulls can rebound from 0.0253 BTC, the first level of resistance lies at 0.0263 BTC. Above this, added resistance is found at 0.0266 BTC (bearish .886 Fib Retracement), 0.0273 BTC, and 0.0278 BTC.
Likewise, the RSI recently slipped beneath the 50 line to indicate bearish momentum creeping within the market.
Click here to start trading on BitMEX and receive 10% discount on fees for 6 months.
Disclaimer: Information found on CryptoPotato is those of writers quoted. It does not represent the opinions of CryptoPotato on whether to buy, sell, or hold any investments. You are advised to conduct your own research before making any investment decisions. Use provided information at your own risk. See Disclaimer for more information.
The post appeared first on CryptoPotato


