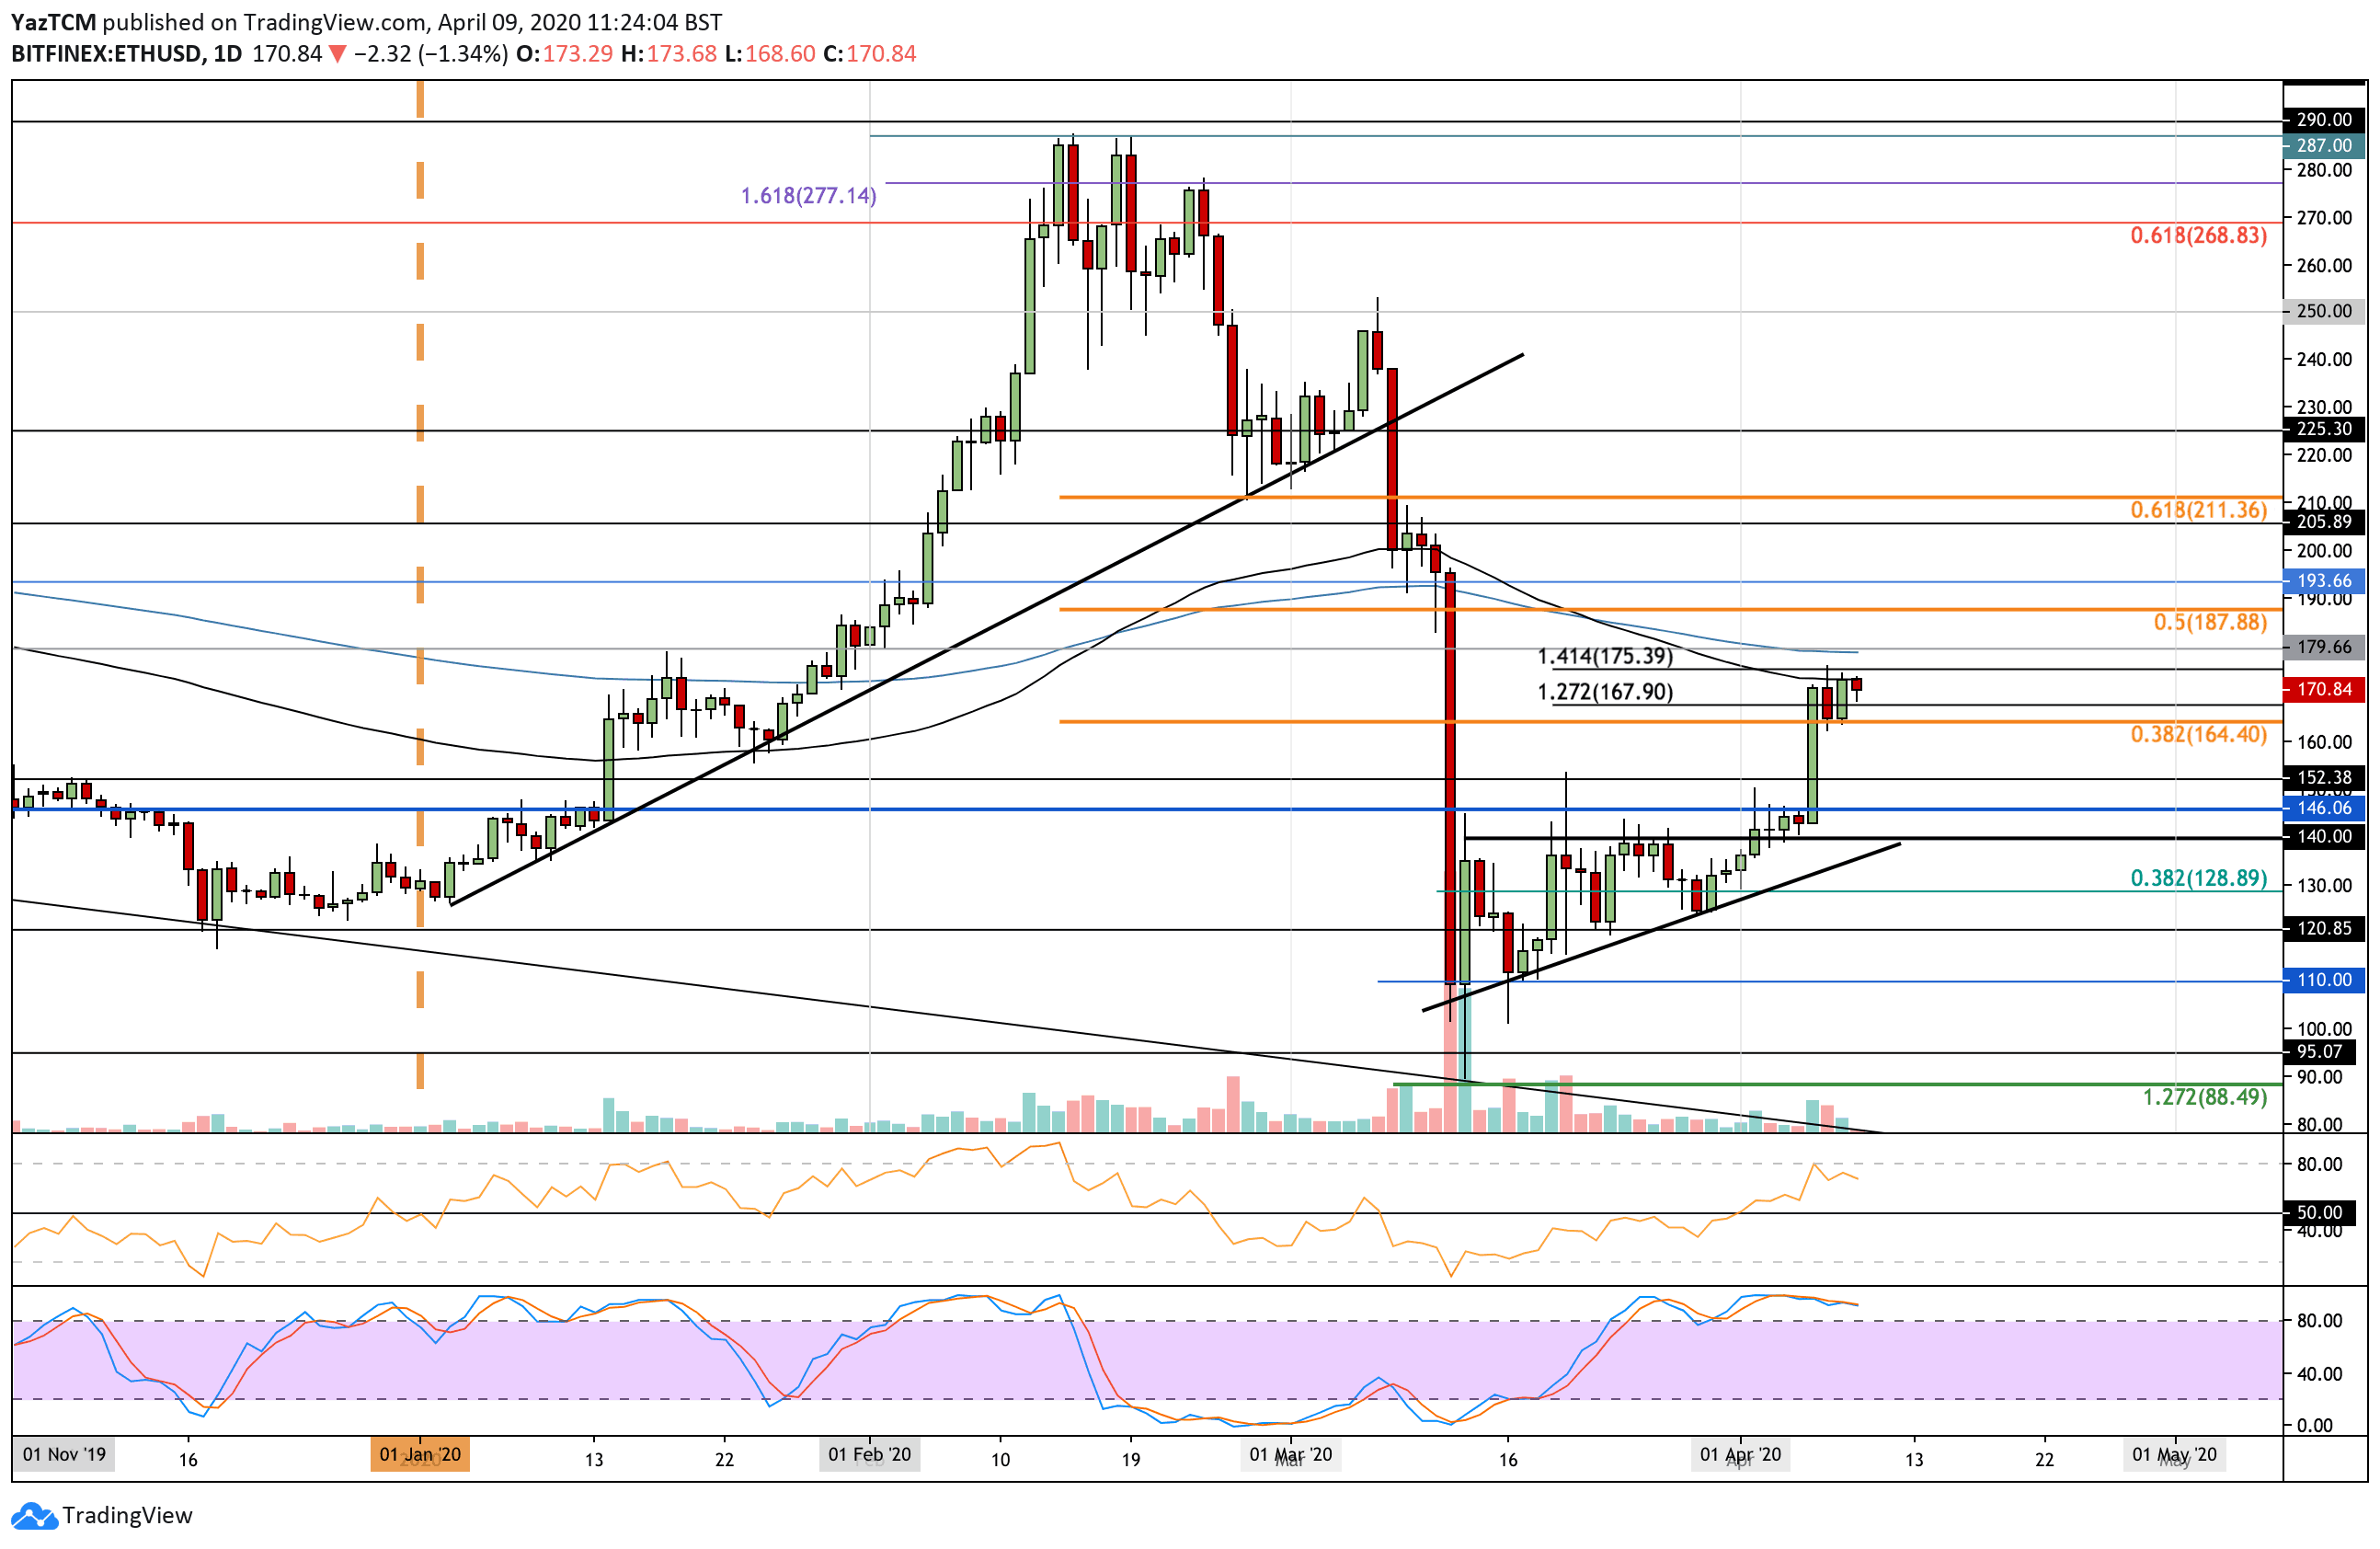
- Ethereum increased by a small 1.3% over the past 24 hours of trading as the cryptocurrency reaches $170.
- It is now facing resistance at the 100-days EMA and has struggled here for the past 3-days.
- Against Bitcoin, Ethereum continues to perform well as it reaches 0.0234 BTC.
Key Support & Resistance Levels
ETH/USD:
Support: $165, $150, $145.
Resistance: $175, $180, $188.
ETH/BTC:
Support: 0.023 BTC, 0.022 BTC, 0.0215 BTC.
Resistance: 0.0235 BTC, 0.024 BTC, 0.0247 BTC
ETH/USD: Ethereum Struggles At 100-days EMA
Ethereum dropped from the $175 level in our last analysis but managed to find support at $165. It has since rebounded from there but is struggling to break above resistance at the 100-days EMA.
Ethereum has been on a surge this week after increasing by a total of 25% but it must break the resistance at the 100-days EMA for it to continue toward $200.

ETH-USD Short Term Price Prediction
Above the 100-days EMA, resistance is located at $180 which is provided by the 200-days EMA. Above this, resistance lies at $188 (bearish .5 Fib Retracement), $194, and $200.
On the other side, the first level of strong support is expected at $165. Beneath this, support lies at $150, $145, and $140.
The RSI dropped slightly from near overbought conditions. If the RSI continues to drop, this will signal that the buying momentum is fading and will likely cause ETH to fall toward $150 again. A bearish crossover signal on the Stochastic RSI will be the first signal that the buyers are losing pressure.
ETH/BTC: Can Ethereum Reach 0.025 BTC?
Against Bitcoin, ETH remained above support at 0.023 BTC over the last 3-days but has struggled to overcome resistance at 0.0235 BTC. The bulls had increased the price from 0.021 BTC at the start of the week to break above the 200-days EMA and reach the current level at 0.0234 BTC.
It looks like the buyers are losing momentum, but if they can stay above 0.023 BTC then ETH will still remain bullish over the next few days.

ETH-BTC Short Term Price Prediction
Once the bulls break 0.0235 BTC, resistance is expected at 0.024 BTC, 0.0247 BTC (bearish .618 Fib Retracement), and 0.025 BTC. This is followed by additional resistance at 0.0263 BTC.
From below, the first level of support lies at 0.0023 BTC. Beneath this, support lies at 0.022 BTC, 0.0215 BTC, and 0.021 BTC.
As mentioned, the RSI is about to head lower which signals that the selling momentum is fading slightly. Nevertheless, so long as ETH remains above 0.023 BTC, the market will remain bullish and head toward 0.025 BTC.
The post Ethereum Price Analysis: ETH Struggling At 100-Days EMA, $170 Presents A Challenge appeared first on CryptoPotato.
The post appeared first on CryptoPotato


