
 The above chart indicates that Ethereum price is clearly trading near a crucial juncture at $192. If there is an upside break, the price could start a decent recovery. If not, there are chances of another bearish wave below $180.Technical Indicators4 hours MACD – The MACD for ETH/USD is showing no positive signs in the bearish zone.4 hours RSI – The RSI for ETH/USD is currently near the 45 level, with a bearish angle.Major Support Level – $180Major Resistance Level – $198The post appeared first on NewsBTC
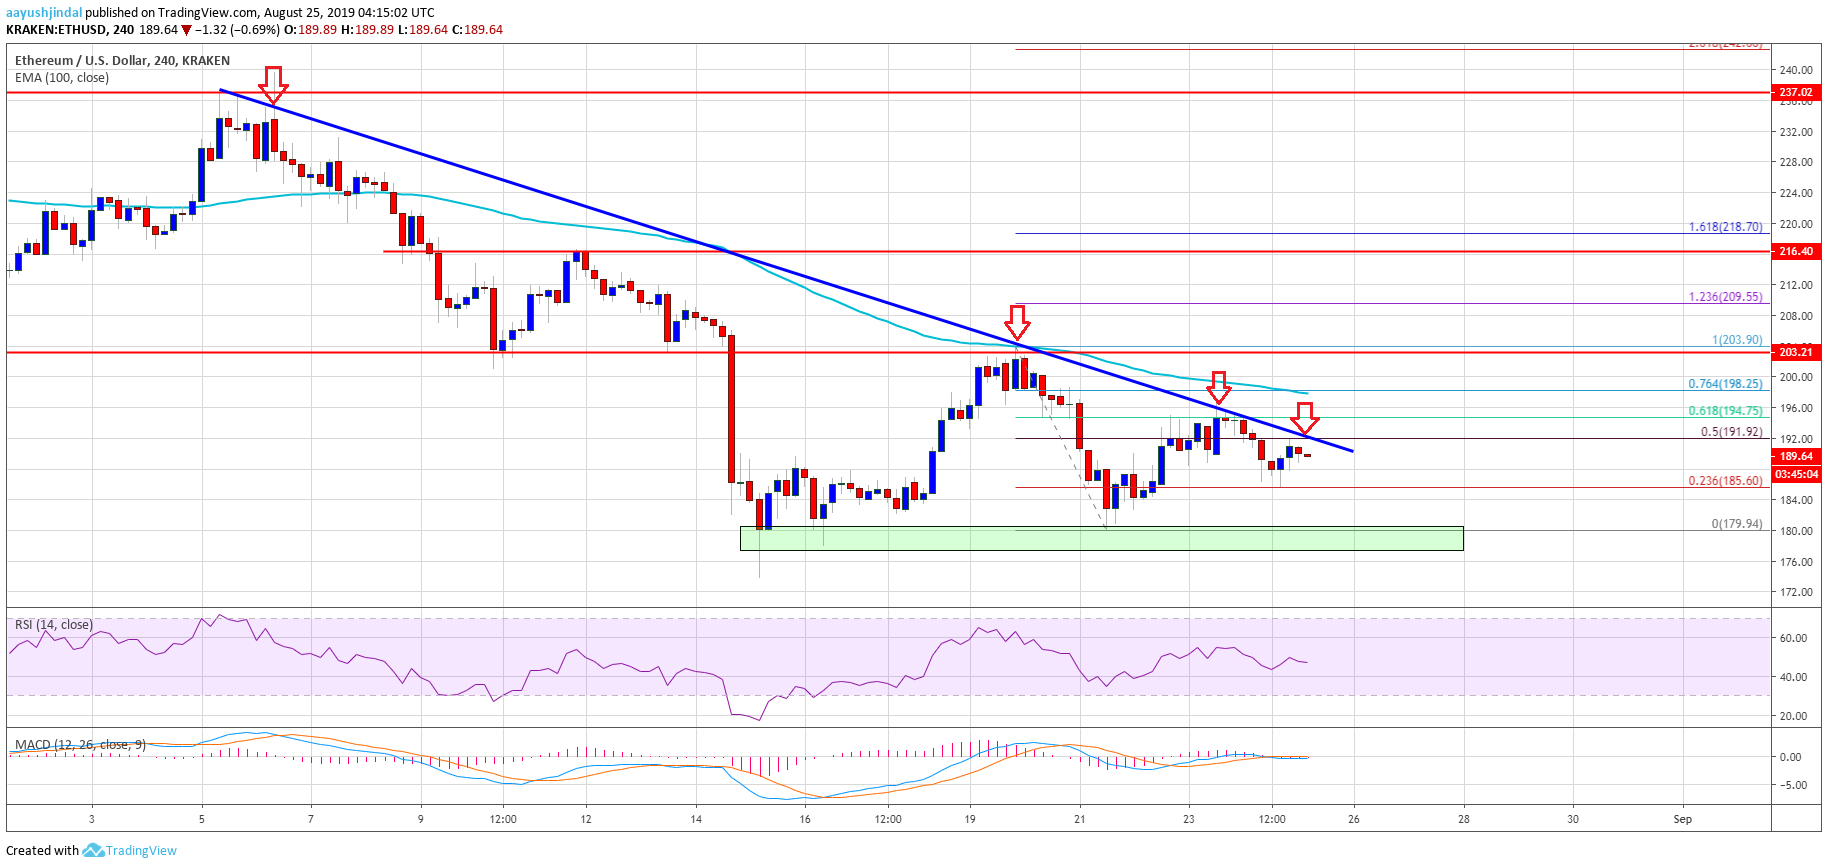
ETH price remained in a bearish zone and even tested the $180 support area against the US Dollar.The price is currently correcting higher, but it is facing hurdles near $192 and $195.There is a significant bearish trend line forming with resistance near $192 on the 4-hours chart of ETH/USD (data feed via Kraken).An upside break above $192 and $195 might trigger a solid recovery in the near term.Ethereum price is currently facing a strong resistance against the US Dollar and bitcoin. ETH remains at a risk of more downsides until there is a daily close above $200.Ethereum Price Weekly AnalysisThis past week, there were bearish moves in ETH below the $210 and $200 supports against the US Dollar. Moreover, the price settled below the $200 level and the 100 simple moving average (4-hours). Additionally, there were bearish moves in bitcoin below $10,000 and ripple price settled below the key $0.290 support level. At the moment, the market is correcting higher, but facing many hurdles such as ETH near the $192 and $195 levels.Ethereum price traded as low as $180 recently and it is currently correcting higher. It recovered above the 50% Fib retracement level of the recent decline from the $204 high to $180 swing low. However, the upward move was capped by the $195 resistance area. Moreover, the 61.8% Fib retracement level of the recent decline from the $204 high to $180 swing low acted as a resistance.It seems like there is a strong resistance forming near $192 and $195. More importantly, there is a significant bearish trend line forming with resistance near $192 on the 4-hours chart of ETH/USD. The main resistance is near the $198 and $200 levels. The 100 simple moving average (4-hours) is also positioned near the $200 level. Therefore, an upside break above the $200 level might trigger a strong recovery.Conversely, if there is no upside break above $195 or $198, the price could is likely to continue lower. An immediate support is near the $185 level. However, the main support is near the $180 level, below which there is a risk of a sharp decline in the near term. The above chart indicates that Ethereum price is clearly trading near a crucial juncture at $192. If there is an upside break, the price could start a decent recovery. If not, there are chances of another bearish wave below $180.Technical Indicators4 hours MACD – The MACD for ETH/USD is showing no positive signs in the bearish zone.4 hours RSI – The RSI for ETH/USD is currently near the 45 level, with a bearish angle.Major Support Level – $180Major Resistance Level – $198The post appeared first on NewsBTC
The above chart indicates that Ethereum price is clearly trading near a crucial juncture at $192. If there is an upside break, the price could start a decent recovery. If not, there are chances of another bearish wave below $180.Technical Indicators4 hours MACD – The MACD for ETH/USD is showing no positive signs in the bearish zone.4 hours RSI – The RSI for ETH/USD is currently near the 45 level, with a bearish angle.Major Support Level – $180Major Resistance Level – $198The post appeared first on NewsBTC


