Disclaimer: The following article attempts to analyze the impact of emerging patterns on the Ethereum short-term market and its price.
The cryptocurrency market saw a sudden shakeup in terms of price on 1 October as the Commodity Futures Trading Commission [CFTC] and the Department of Justice charged BitMEX co-founders for violating regulations. Although BitMEX denied any wrongdoing, the news did cause the market to witness sell-offs not only in the Bitcoin market but also in Ethereum.
The appreciating value of ETH was pushed down by 7% and was at $343.52, at press time. This devaluation was unexpected and the market moved away from a bullish pattern it was charting until the sell-off event.


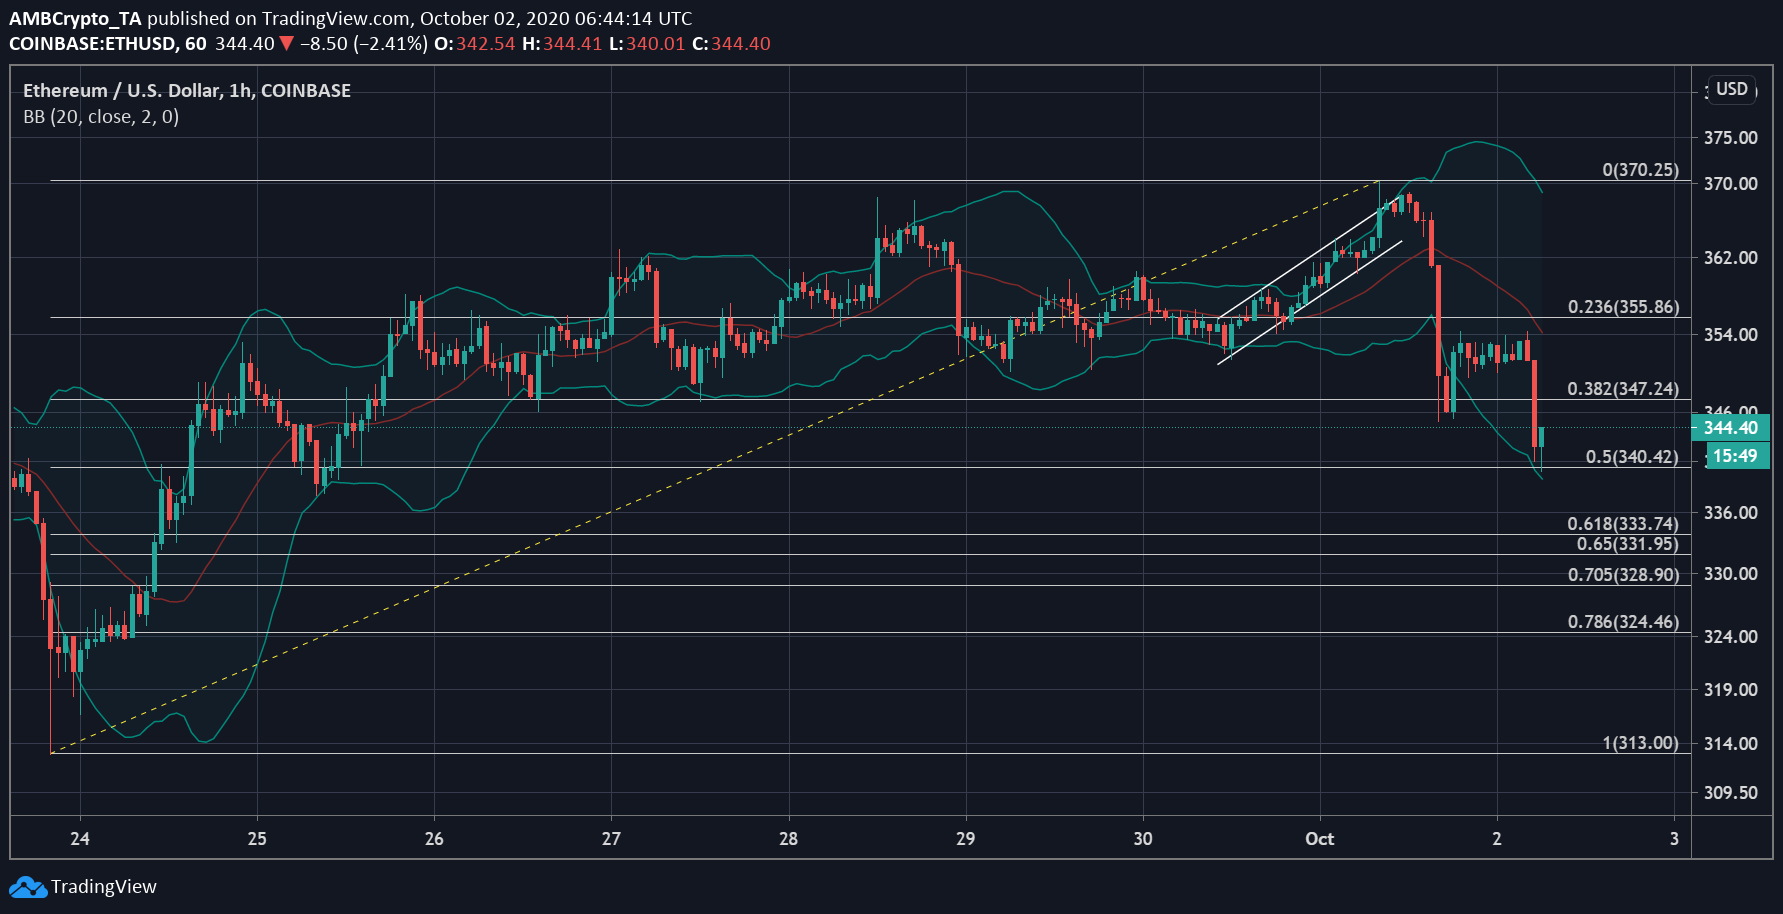
Source: ETH/USD on TradingView
The above short-term chart noted great volatility in the ETHUSD market as the Bollinger Bands had diverged. The vast difference between the bands indicated the volatile nature of the fall and the short-term future of the market. Looking closely, we can see that before the collapse in the value of Ethereum, the market was witnessing a bullish move, with low volatility and the signal line under the price bars, noting the upwards moving price.
However, the fall has changed the trend to a bearish one, wherein with great volatility the price has not yet managed to stabilize and has currently found support at $340.42.


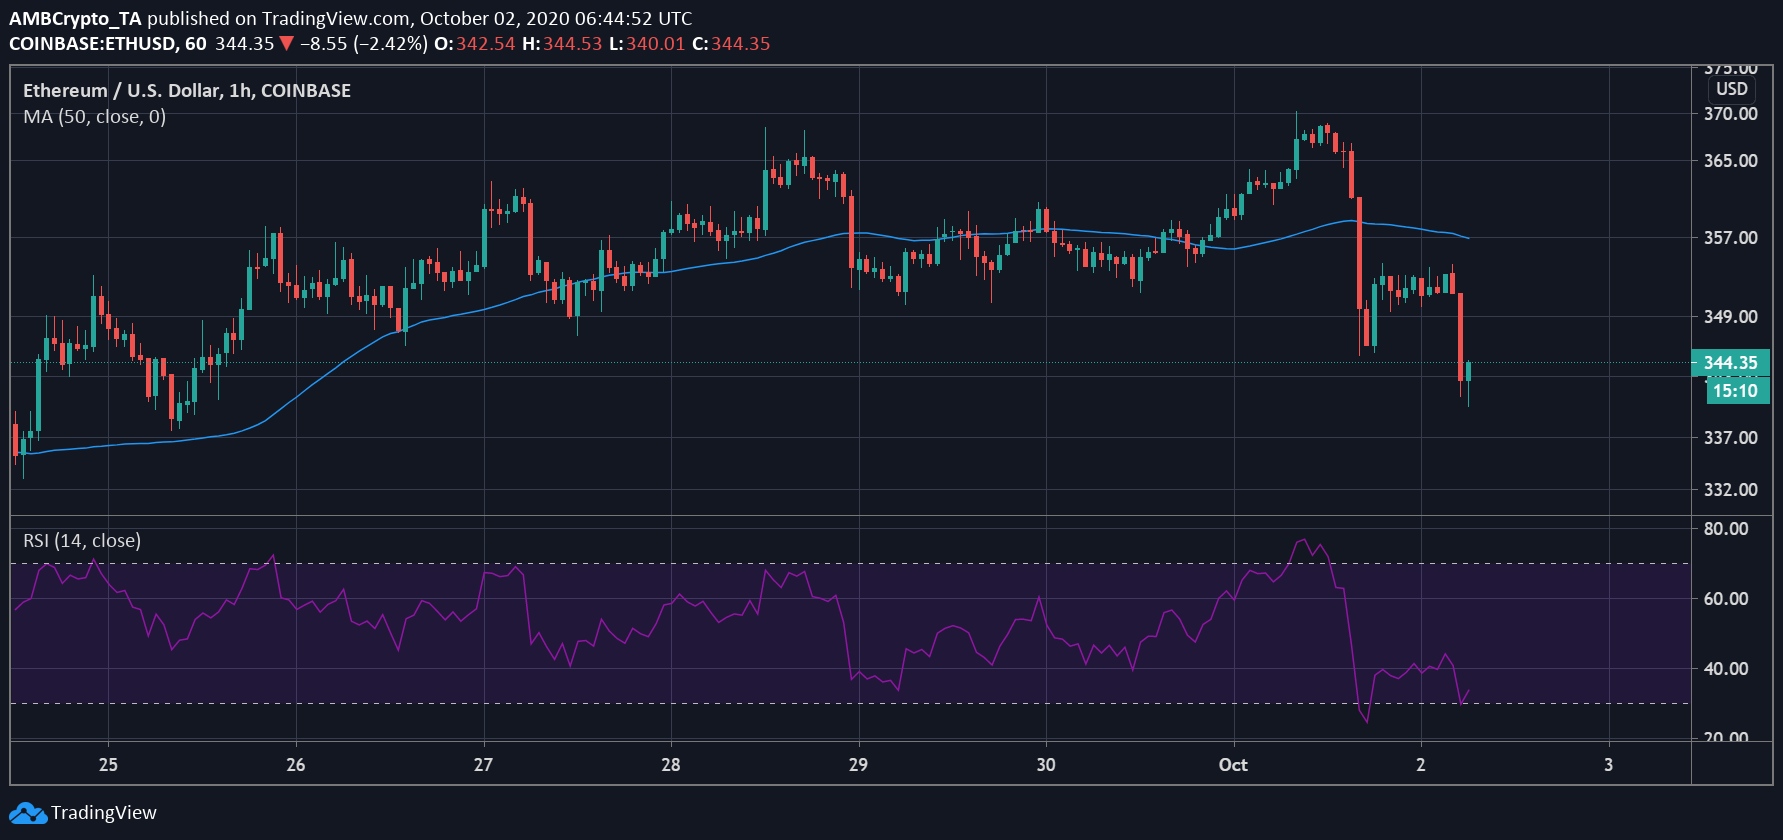
Source: ETH/USD on TradingView
The 50 moving average also indicated a similar price trend to continue until the near future. Whereas the Relative Strength Index was noting that before the crash, ETH had already entered the overbought territory and the sudden dump in price caused it to dip directly in the oversold zone. As the digital asset was quick to jump back within the equilibrium range, it was still closer to being oversold as RSI was at 32.12. A dip below 30 will push it back to the oversold territory.
The post appeared first on AMBCrypto


