At the time of writing, Ethereum, the world’s largest altcoin, was trading within a range, and a close outside the range would give traders clarity on the next direction for the crypto-asset. At the time, the Crypto Fear and Greed Index was noting a figure of 55, a figure that might be an indicator of incoming bullish sentiment as Bitcoin seeks to climb past $11,500. Waves had soared past its own levels of resistance while Nano also had a bullish outlook.
Ethereum [ETH]


Source: ETH/USD on TradingView
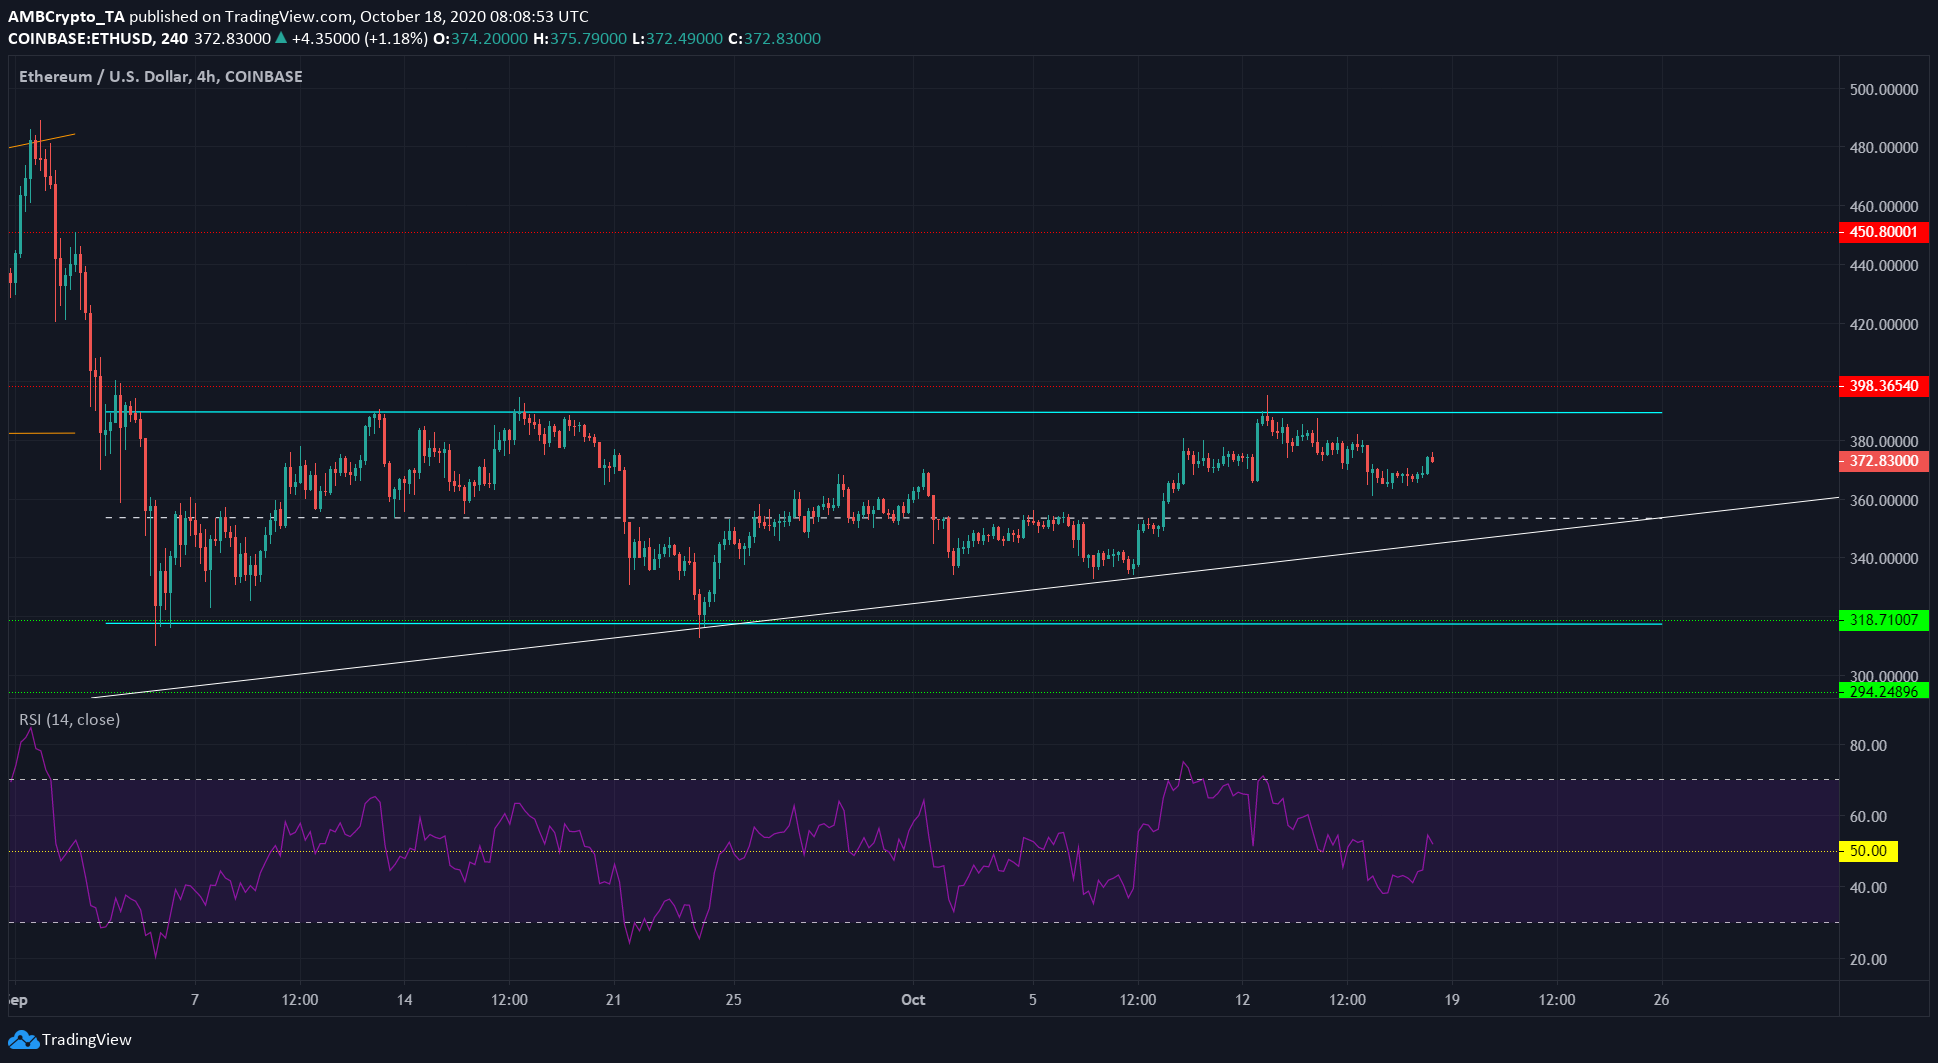
Ethereum descended to its support level at $318 in early-September, following which, it bounced strongly off the level. However, it was soon halted by the resistance level at $388.
Since then, the cryptocurrency’s price has appeared to trade within a rectangle bottom pattern (cyan). This pattern generally sees a breakout to the upside. In the near-term, ETH can expect to face strong resistance in the $385-zone and strong support around the $355-level.
The mid-point of the rectangle was at $355, and there was ascending trendline support (white) going back to March’s Black Thursday.
The RSI was observed to have dipped beneath 50, but the same had risen to 54, at press time. It showed how ETH has seen both bullish and bearish momentum in almost equal parts over the past month.
A close above $390 could see ETH march towards $500, while a close below $340 can see a test of $320, and might even bring a fall towards $260.
A recent report revealed that the combined value of ERC-20 tokens had reached its all-time high.
Waves [WAVES]


Source: WAVES/USDT on TradingView
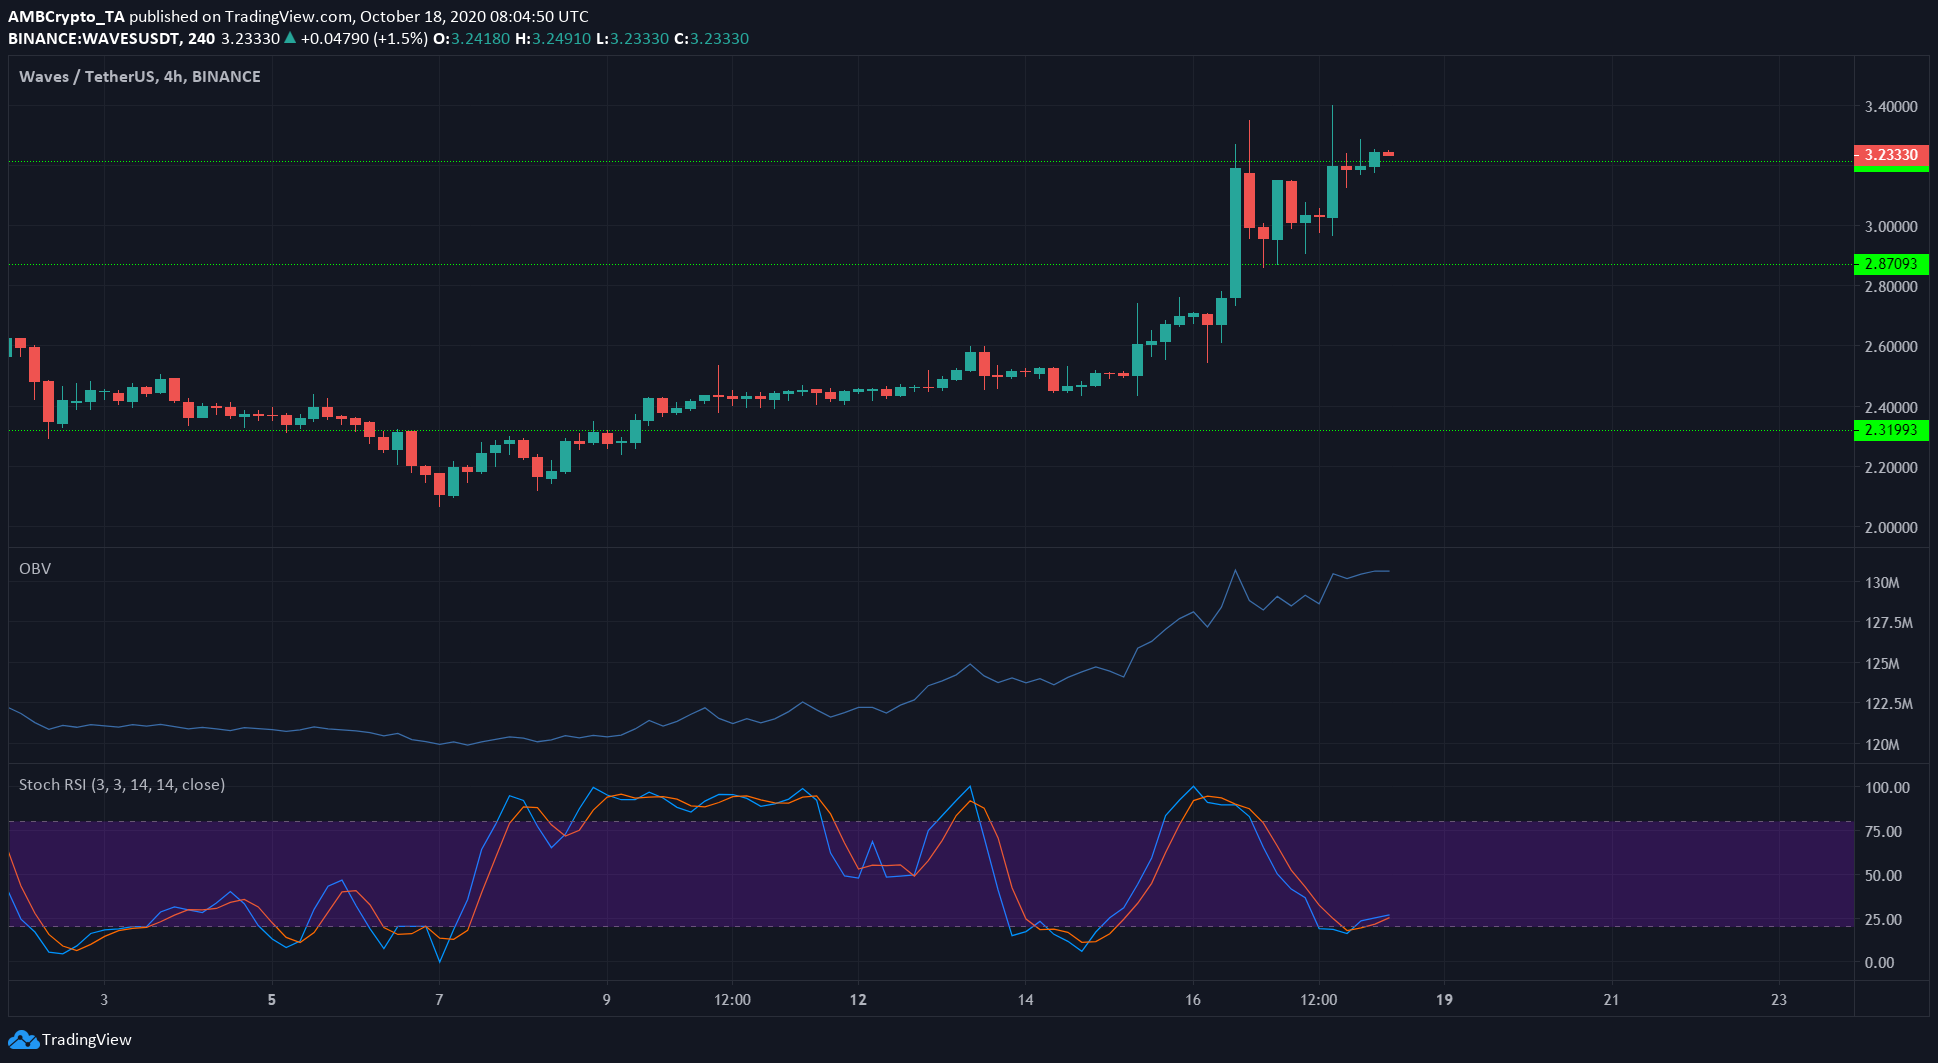
Waves surged past its resistance level at $2.8 and $3.2 over the last few days. Further, the Stochastic RSI showed that the crypto-asset was near the oversold region on the back of its recent rejection at the resistance level of $3.2.
The OBV also showed strong buying volumes in the market and highlighted that the latest surge had the backing of buyer interest.
The next level of resistance for the crypto-asset was observed to be at $3.75, although it can also expect to face some resistance at the $3.4-level.
Nano [NANO]


Source: NANO/USDT on TradingView
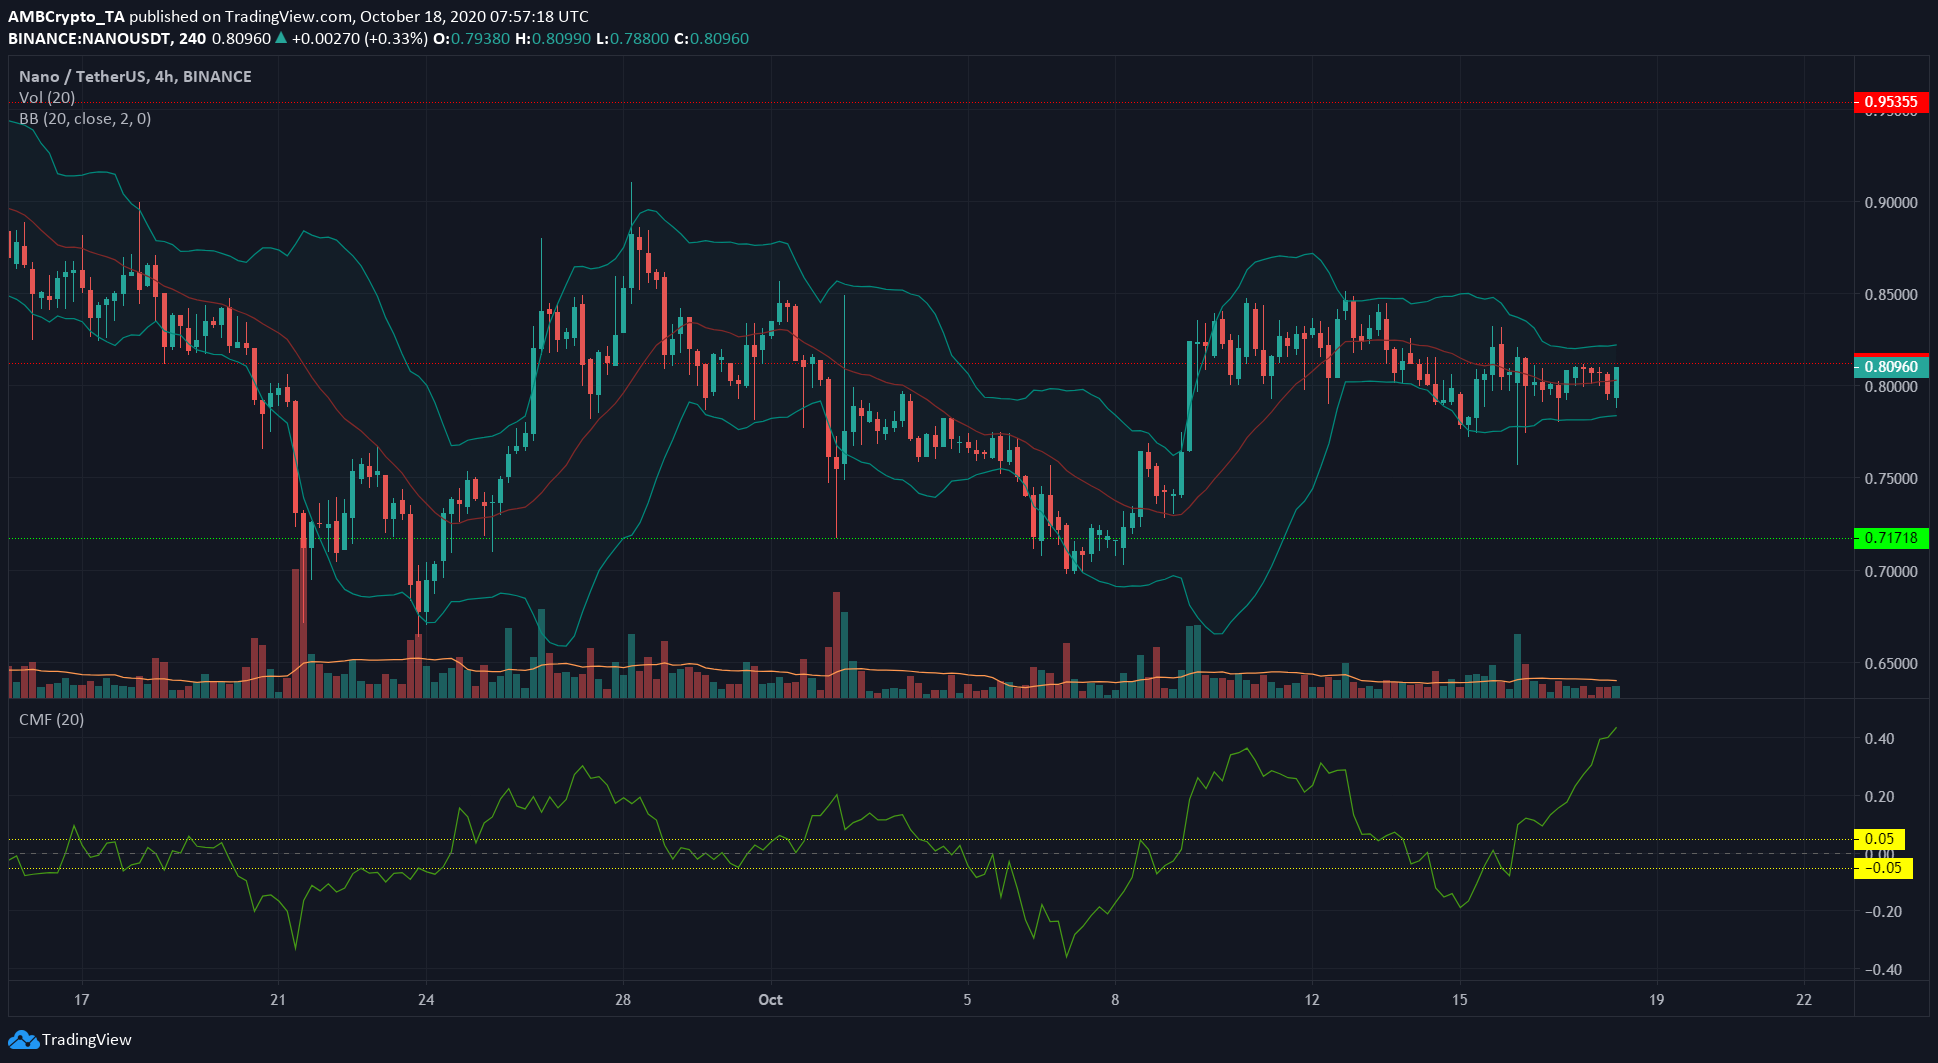
The crypto-asset was noting a phase of low volatility, something highlighted by the relatively tight Bollinger Bands. The trading volume was also lower than average over the past few days.
Further, the Chaikin Money Flow showed that strong capital inflows into the market were present, making a bullish case for the asset as it traded beneath the resistance at $0.8.
The cryptocurrency’s price had attempted to breach the resistance over the previous week, but was rejected. However, it formed a higher low at $0.77 as buyers were willing to step in when the price was quite close to the resistance level, reinforcing the bullish outlook in the near-term for the asset.
The post appeared first on AMBCrypto


