Over the past couple of months, Ethereum has been in the bears’ territory. The 2nd largest asset slumped by 42.65 percent since July 8th and the coin ended up breaching key supports which were active resistances at press time.
However, there may be an imminent trend reversal for the coin in the future as the long-term charts indicated bullish possibilities.
12-hour charts

Source: Trading View
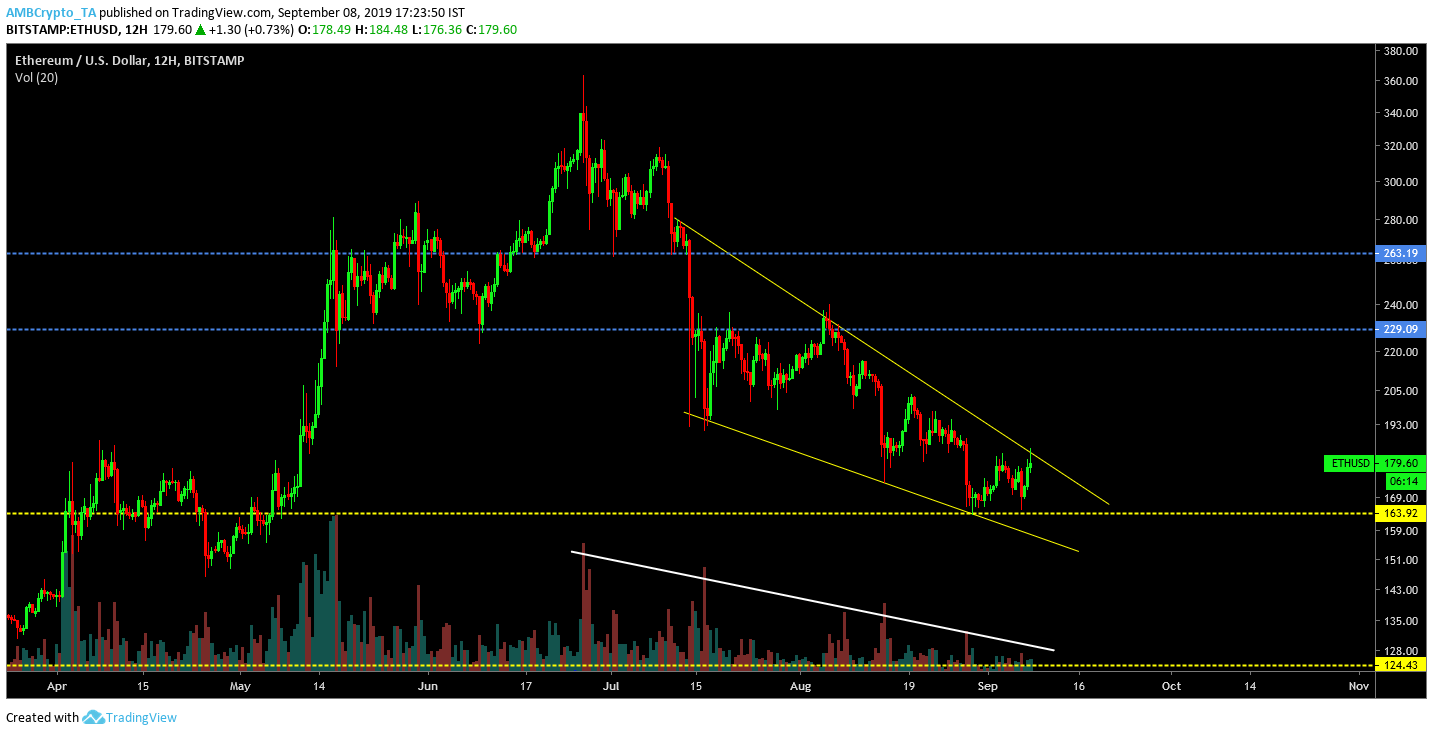
The 12-hour chart exhibited bearish signs. The price was on a consistent decline over the past 74 days as the valuation dropped from $340.23 to $180.21 at press time. Ethereum breached support line of $229.09 on 14th July and continued to bounce off it for 25 days before suffering from another fall.
However, a prominent bullish pattern forming in the market would offer ETH supporters a sliver of hope. Over the past 59 days, Ethereum’s price navigated under a falling wedge pattern and the valuation continued to move between trend lines. The price movement steered within the pattern formed and an imminent bullish breakout may soon transpire. Decreasing trade volume confirmed the validity of the pattern that was forming in the trend charts.
1-day chart

Source: Trading View
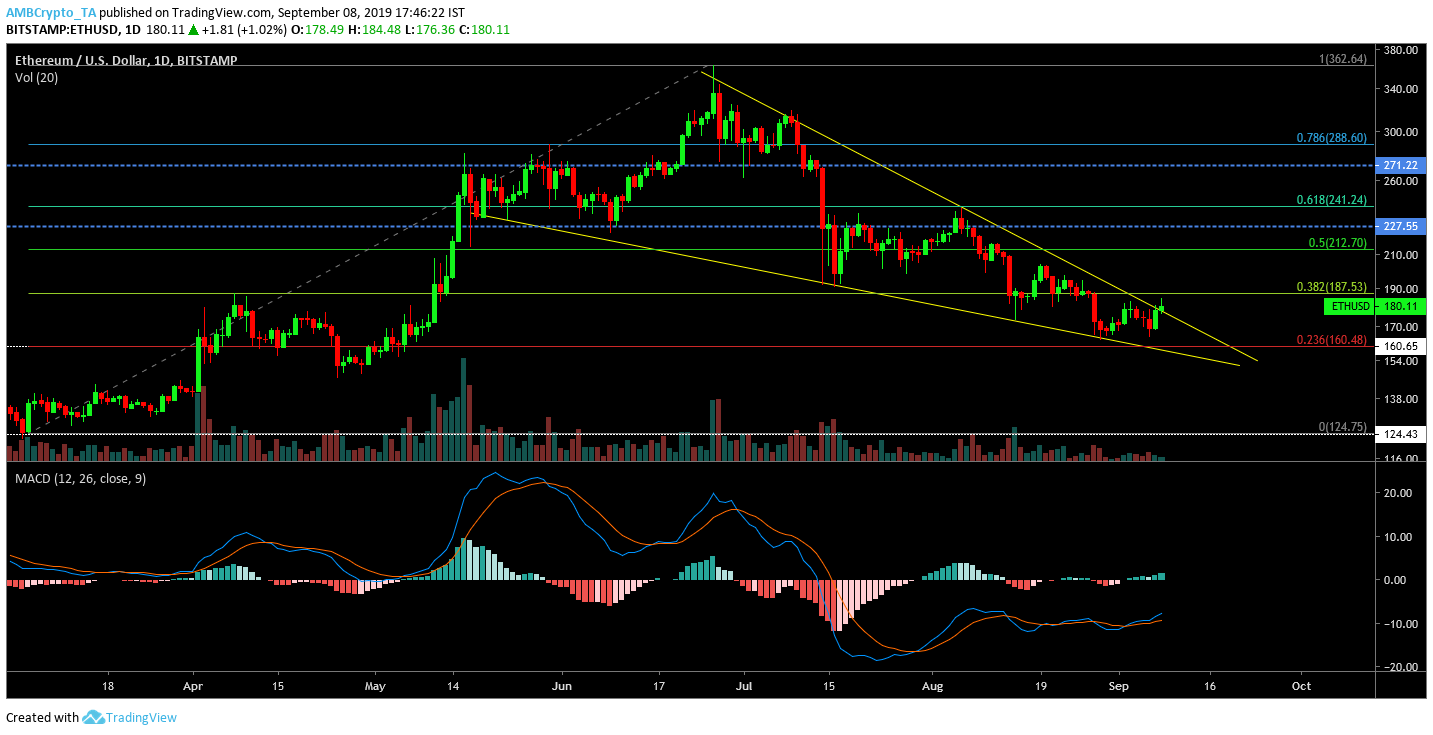
Looking at the 1-hour chart, a similar bullish pattern could be identified. The chart indicated formation of a similar falling wedge suggesting a bullish breakout before the end of the month.
Fibonacci retracement lines marked the resistance points, with the immediate one standing at $187.53, followed by $212.70.
MACD indicator line also exhibited bullish traits at press time, increasing possibility of a bullish trend reversal. However, in case of an unexpected fall, Fibonacci lines suggested the price may drop down to $160.48, which was the next immediate support.
Conclusion
Both long-term charts echoed a change for Ethereum, as indicators and price movement get set for the bullish breakout ahead.
The post appeared first on AMBCrypto


