The second-largest cryptocurrency aka Ethereum [ETH] has pumped more than 7% in the last 4 hours or so. In terms of BTC, it has pumped by 4.25% making 1 ETH equivalent to 0.0202 BTC at press time. However, this rally is running on fumes and is bound to head lower in the upcoming day.
Pumping on Fumes

Source: ETH/USD TradingView
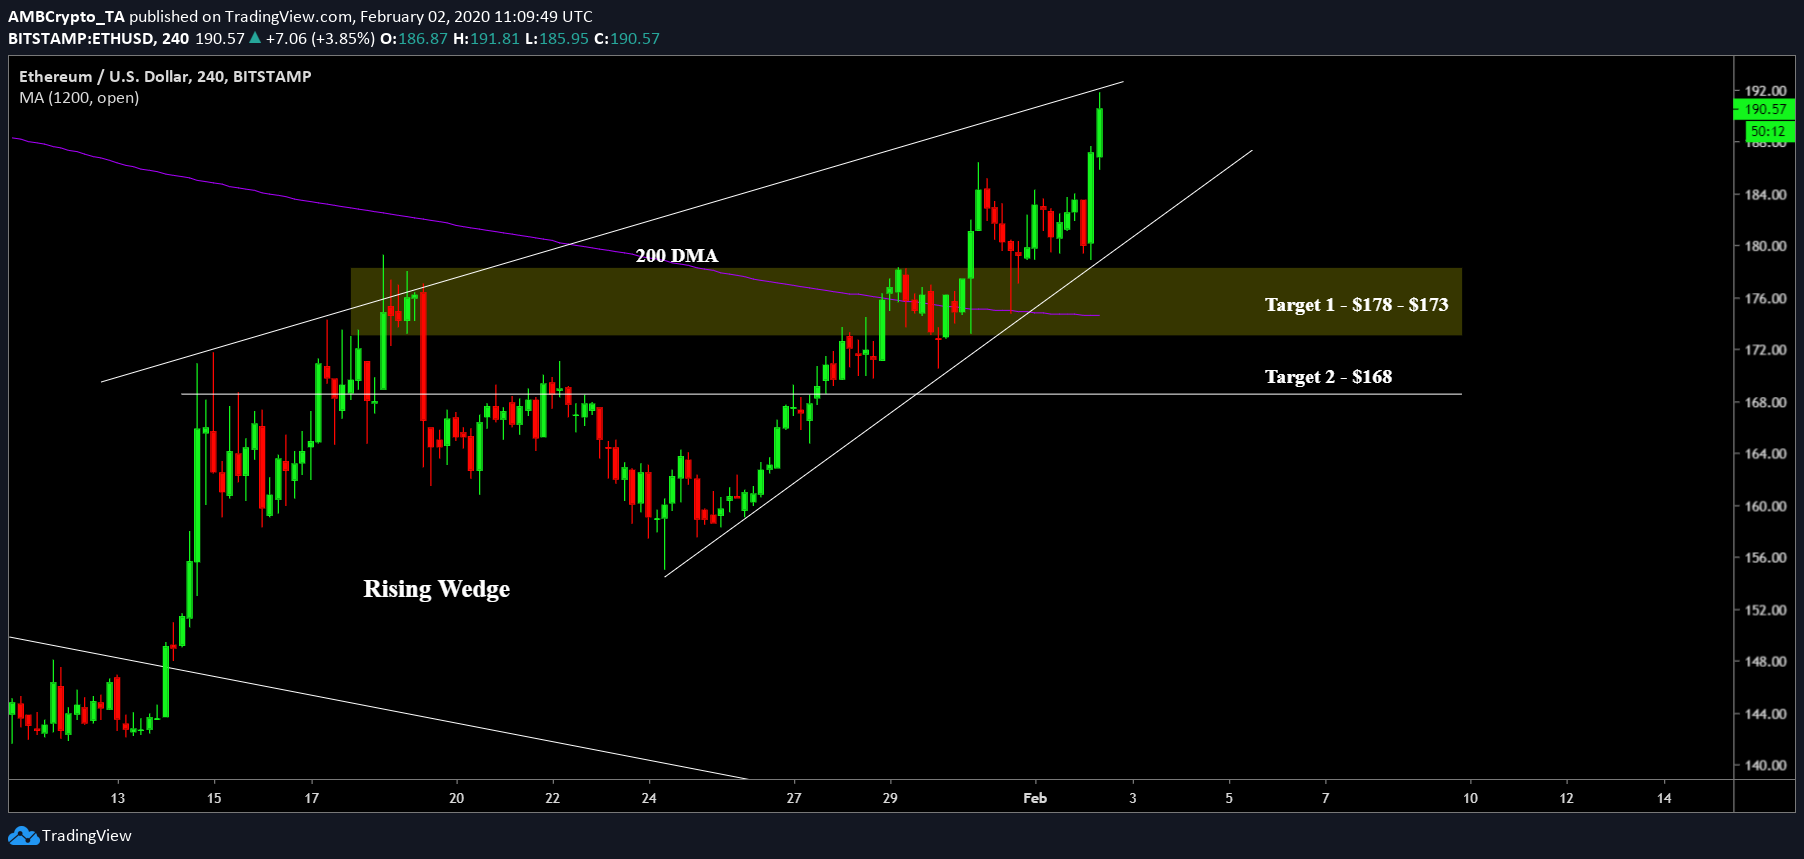
The 4-hour chart for Ethereum showed the formation of a bearish rising wedge pattern with a current age of 18+ days. As the price nears the narrow-end of the wedge, the breakout becomes more palpable. As for the breakout, the price will take a tumble from its current seating at $191 to a low range of $170 to $168. Supporting this collapse, to an extent is the 200-DMA [purple] which is below the price, for now; there will be another retest of this important level, currently at $178.

Source: ETH/USD TradingView
In addition to the 200-DMA, the collapse is supported by the OBV which shows a plateauing after hitting a volume peak at $777,000. Furthermore, the RSI has also hit the overbought zone at press time, indicating a bounce lower from this point.
Bitcoin and Ethereum’s Tango

Source: CoinMetrics
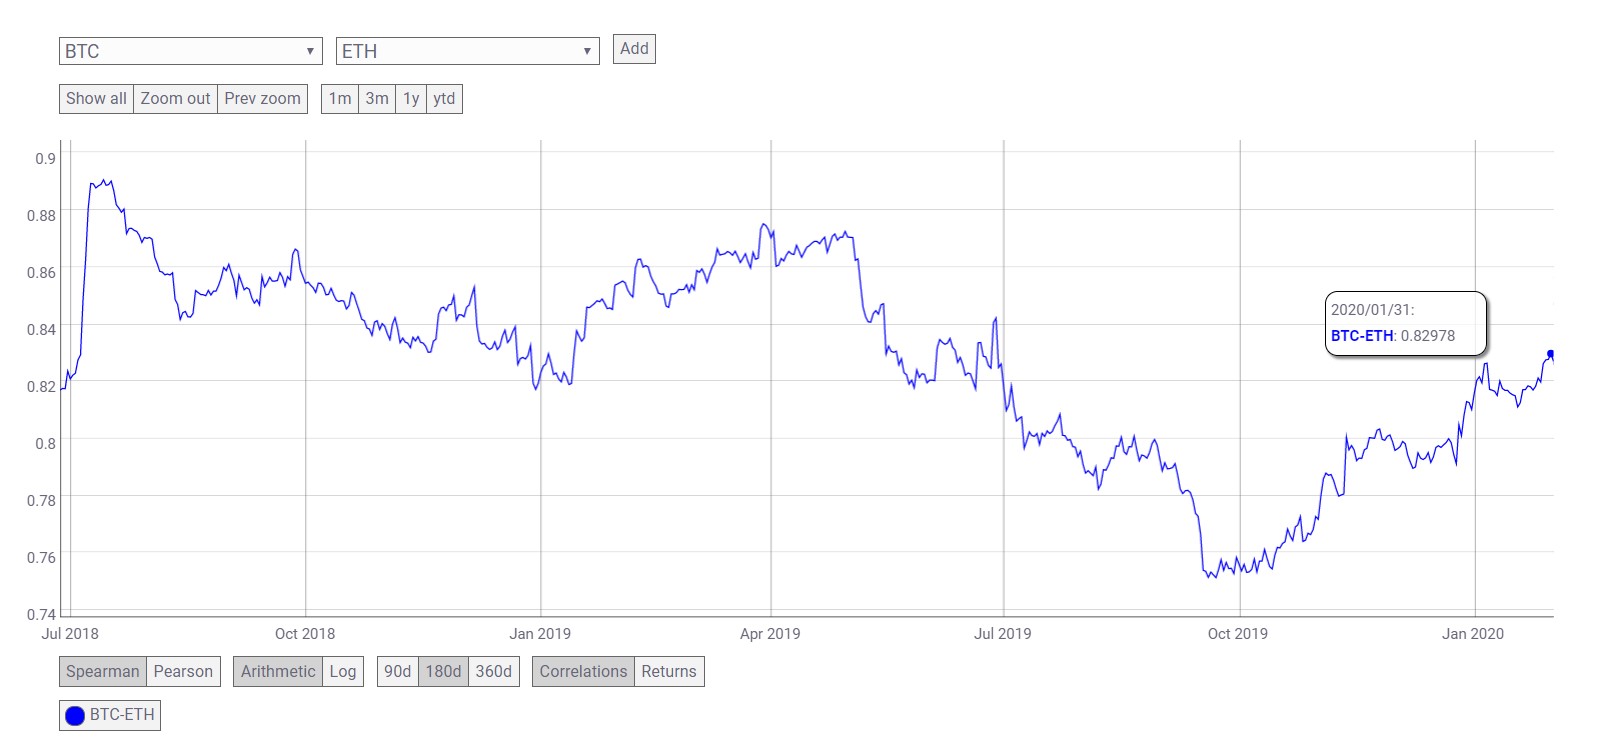
Since Ethereum is the second-most successful cryptocurrency in terms of market cap, there is bound to be a direct correlation between these assets. However, the correlation [180-day] seems to have plateaued since hitting an ATH of 0.89 in July 2018. Since then the correlation has varied between a band ranging from 0.89 to 0.75. At press time, however, the correlation stood at 0.82, a relatively higher correlation.
ETH/BTC

Source: ETH/USD TradingView
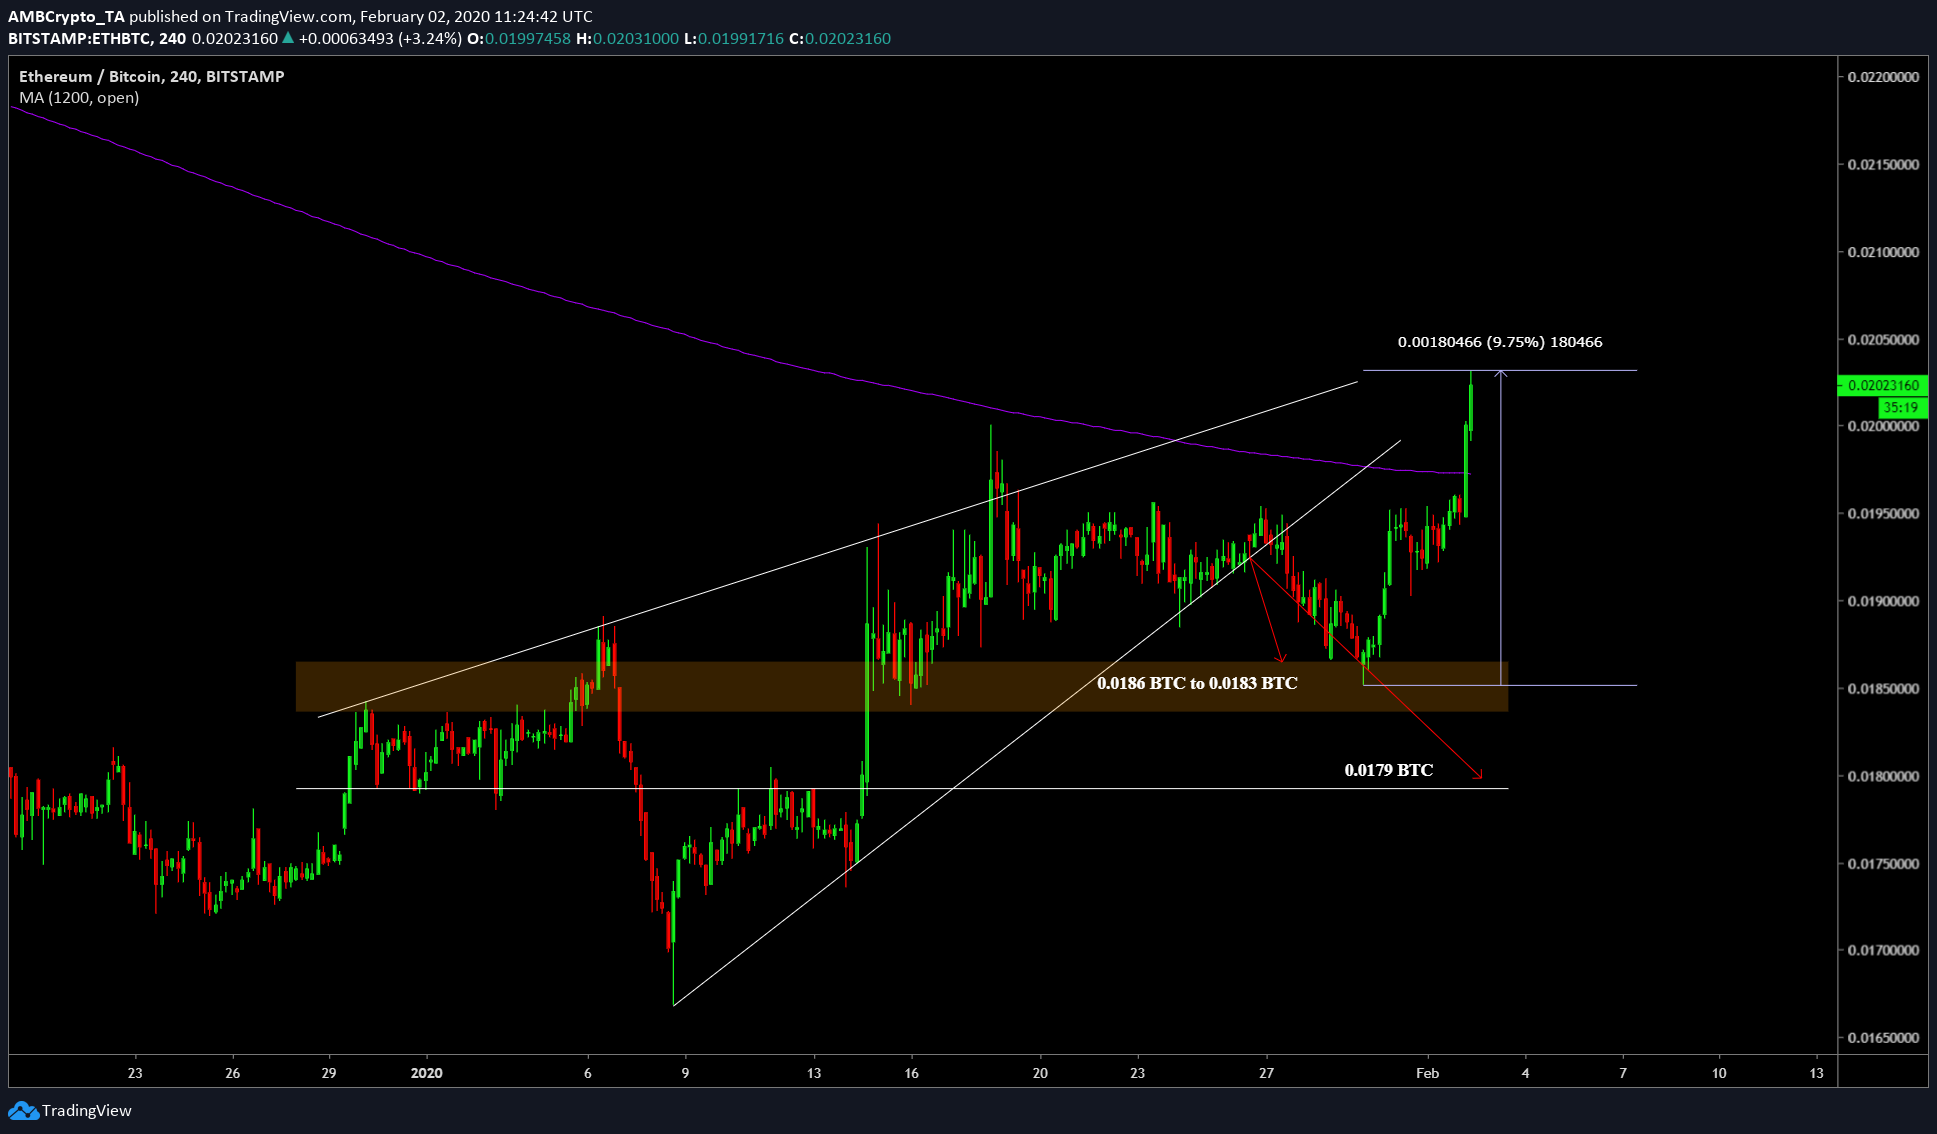
As mentioned in a previous article, Ethereum managed to hit a low range between 0.0186 BTC to 0.0183 BTC. This lower-range breach confirmed the breakout of the rising wedge pattern. Since this breakout, the price has managed to surge by a total of 9.75% in terms of BTC and shows no sign of stopping.
Conclusion
The price of ETH in USD or BTC looks bleak. In terms of USD, the price will drop to a low range of $170 to $168 after breaching the 200-DMA on its way. In terms of BTC, the price has hit a ceiling at 0.0203 and seems to be heading down, possibly to 0.019 BTC.
The post appeared first on AMBCrypto


