
Let’s rock 2020?
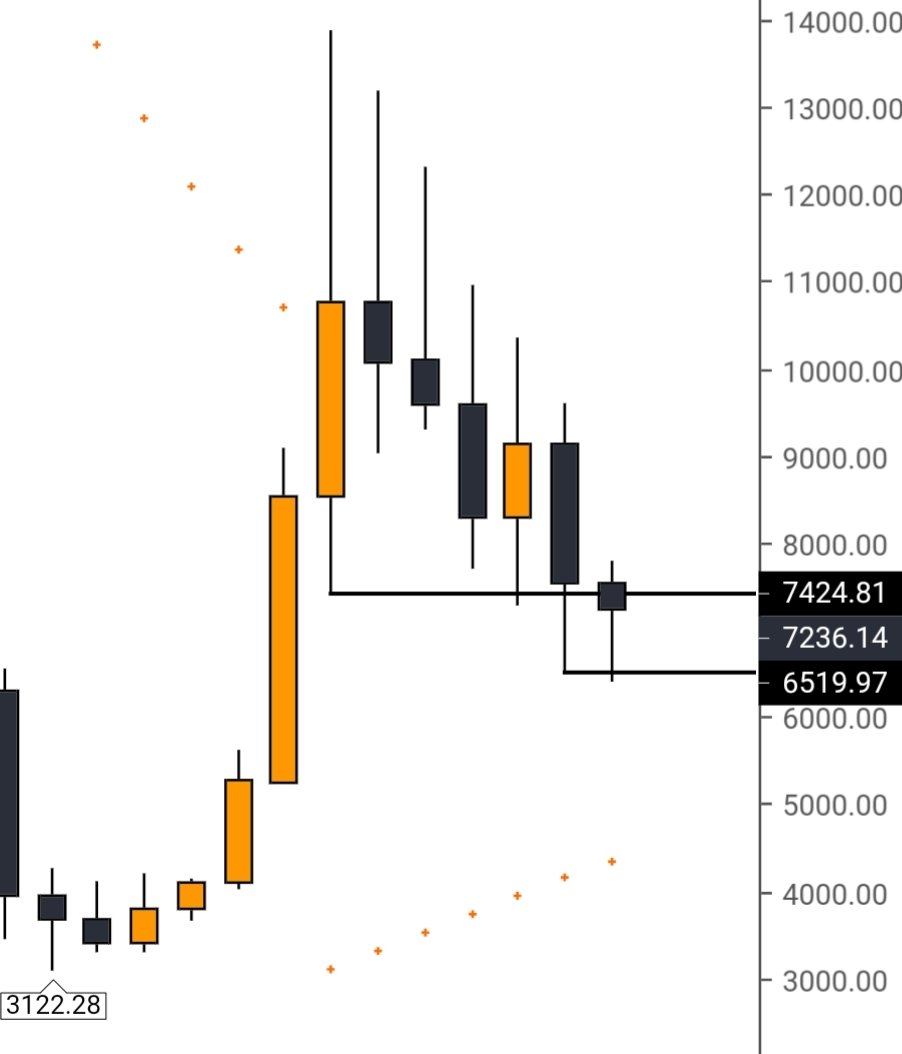
Who’s with me? pic.twitter.com/SmbIu5CgFB— Crypto₿irb (@crypto_birb) December 23, 2019Number 1: Bitcoin Sees Long-Term Golden CrossEarlier this month, Bitcoin’s long-term chart saw an extremely bullish sign from a macro perspective: the 50-week and 100-week simple moving averages saw a crossover, with the former crossing above the latter, signaling that bulls are in control of the long-term cryptocurrency trend.This was last seen in mid-2016, prior to the parabolic run-up that brought Bitcoin from $500 to nearly $20,000 in a few years’ time.Related Reading: Need to Explain Bitcoin to Friends and Family? Here’s a Strategy Or TwoNumber 2: BTC Painting Bull FlagBitcoin’s chart is painting a massive bull flag, which some say has a high likelihood of breaking to the upside. Should the bull flag break higher, there’s a good likelihood BTC could enter the $10,000 range, then potentially rocket to encounter previous all-time highs.Number 3: Growing Bitcoin Futures InterestOver the past few months, Bitcoin derivatives on an array of platforms have begun to see an uptick in volume and open interest, implying investment activity from institutions.Analysts say that institutional inflows will be a catalyst behind the next bull run.Related Reading: Wyckoff Analysis: Bitcoin Bottom Is In, Price Poised to Break Past $8,000Number 4: Strong Buying Pressure Underneath $7,000The analyst noted that there exists strong buying pressure under $7,000, as marked by the long wicks on the chart that can be seen below. This suggests that there is strong long-term buying interest in the $6,000s and that this is a region in which BTC should find a macro bottom.
 Number 5: An Existing Regulated Bitcoin Market (eg. Bakkt)In a similar vein to number 3, Bakkt — the Intercontinental Exchange-, Starbucks-, and Microsoft-backed cryptocurrency infrastructure upstart and exchange — recently launched its regulated Bitcoin futures contracts.The analyst suggested that this is a bullish fact that should boost the market in the coming years.Indeed, countless analysts have told this writer that Bakkt’s futures and similar derivatives like it will be a catalyst for widespread institutional investment in the coming years.Related Reading: Bitcoin Price Likely to Jump After Christmas; Here’s WhyFeatured Image from ShutterstockThe post appeared first on NewsBTC


